MQL4, MQL5로 프랙탈을 이용한 추세선 그리기
목차
- 개요
- 1. 입력 변수, DeInit() 함수 및 초기 변수 선언
- 2. 가장 근접한 프랙탈 검색
- 3. 프랙탈 가격 및 시간 값 설정
- 4. 객체 생성 및 프로퍼티 설정 라인 리드로잉
- 5. 로딩된 바 기록 확인
- 6. 추세선 돌파 시그널 및 푸시 알림
- 7. 추세선의 실제 적용
- 결론
개요
요즘 추세선에 대해 생각하고 있는데요. 어떤 방법을 이용해서 선 시작점을 찾을지, 어떻게 하면 보다 정확한 추세선을 그릴 수 있을지에 대해 고민해 봤습니다. 프랙탈 구조를 이용해 보기로 했습니다.
저는 평소에 일하면서 종종 시장 분석을 하는데요. 참, 큰 타임프레임에는 추세선을 그릴 수가 없습니다. 최대 15분의 타임프레임 내에 위치한 극점을 이용해 그려야 합니다. 타임프레임이 커지면 M15의 경우 그 결과가 달라질 수도 있거든요. 자동화가 필요한 이유이기도 하죠. 저는 처음에는 MQL5로 코드를 작성했는데요. 그러다가 MQL4로 옮겼습니다. MetaTrader4에 적용할 프로그램이 필요해서요.
본문에서는 MQL4와 MQL5 모두를 다룰 겁니다. 두 솔루션을 비교할 수 있도록 작성했지만 MQL4와 MQL5의 효율성을 비교하는 건 적절하지 않은 것 같네요. 참고로, 제 솔루션보다 훨씬 효과적인 다른 솔루션도 있을 겁니다. MQL4 또는 MQL5를 이용해 스크립트를 작성하는 초보 개발자에게 적합한 글입니다. 특히 프랙탈과 추세선을 이용하고자 한다면요.
1. 입력 변수, DeInit() 함수 및 초기 변수 선언
저는 다음의 변수를 인풋 변수로 이용했습니다.
input color Resistance_Color=Red;       // setting the resistance line color
input ENUM_LINE_STYLE Resistance_Style; // setting the resistance line style
input int Resistance_Width=1;           // setting the resistance line width
input color Support_Color=Red;          // setting the support line color
input ENUM_LINE_STYLE Support_Style;    // setting the support line style
input int Support_Width=1;              // setting the support line width
-->
MQL4에서나 MQL5에서나 동일하게 나타나죠.
MQL5 사용 시 인디케이터를 미리 만들어야합니다.
//--- iFractals indicator handle
int Fractal;
//+------------------------------------------------------------------+
//| Expert initialization function                                   |
//+------------------------------------------------------------------+
int OnInit()
  {
//--- getting the iFractals indicator handle
   Fractal=iFractals(Symbol(),PERIOD_D1);
//---
   return(INIT_SUCCEEDED);
  }
-->
해당 프로그램이 그래픽 객체를 그릴 것이므로 차트에서 EA 제거 시 함께 제거하는 게 좋겠죠.
void OnDeinit(const int reason)
  {
   ObjectDelete(0,"TL_Resistance");
   ObjectDelete(0,"TL_Support");
  }
-->
저항선과 지지선 두 개의 선을 그리려면 네 개의 점이 필요합니다. 선이 지나는 점을 찾으려면 시간과 가격을 알아야 하죠.
좌표는 다음의 순서로 결정됩니다. 우선 극단 바를 찾습니다. 극단 바를 찾으면 극점의 가격과 시간을 알 수 있습니다.
OnTick() 함수 변수 선언하기
| MQL4 |
|---|
//--- declaration of variables
int n,UpperFractal_1,UpperFractal_2,LowerFractal_1,LowerFractal_2;
--> |
| MQL5 |
|---|
//--- declaration of variables
int n,UpperFractal_1,UpperFractal_2,LowerFractal_1,LowerFractal_2;
//--- declaring the arrays for writing values of the iFractal indicator buffer
double FractalDown[],FractalUp[];
double UpFractal_1,UpFractal_2,LowFractal_1,LowFractal_2;
--> |
프랙탈이 형성된 바의 인덱스를 저장하는 변수를 우선 선언합니다.
MQL4의 경우
- n-루프 연산자를 이용해 가장 근접한 프랙탈을 찾는 데에 필요한 변수
- UpperFractal_1, UpperFractal_2, LowerFractal_1, LowerFractal_2-최고값과 최저값을 갖는 첫 번째와 두 번째 극점에 위치한 바 인덱스 저장에 필요한 변수
MQL5에서는 변수가 몇 개 더 추가됩니다.
- FractalDown[],FractalUp[]-iFractals 인디케이터 버퍼 값 저장을 위한 더블 값 배열 선언
- 마지막으로 더블형 변수 UpFractal_1, UpFractal_2, LowFractal_1, LowFractal_2가 있습니다. 극점의 가격 값이 여기에 저장되죠.
2. 가장 근접한 프랙탈 검색
루프 연산자를 이용해 프랙탈이 형성된 바의 인덱스를 찾습니다.
첫 번째와 두 번째 상위 프랙탈에 해당하는 두 바의 인덱스를 설정하겠습니다.
| MQL4 |
|---|
//--- finding the bar index of the first nearest upper fractal
   for(n=0; n<(Bars-1);n++)
     {
      if(iFractals(NULL,1440,MODE_UPPER,n)!=NULL)
         break;
      UpperFractal_1=n+1;
     }
//--- finding the bar index of the second nearest upper fractal
   for(n=UpperFractal_1+1; n<(Bars-1);n++)
     {
      if(iFractals(NULL,1440,MODE_UPPER,n)!=NULL)
         break;
      UpperFractal_2=n+1;
     }
--> |
| MQL5 |
|---|
//--- first, we need to write the Fractal indicator buffer values into the arrays
//--- filling arrays with buffer values
   CopyBuffer(Fractal,0,TimeCurrent(),Bars(Symbol(),PERIOD_D1),FractalUp);
   CopyBuffer(Fractal,1,TimeCurrent(),Bars(Symbol(),PERIOD_D1),FractalDown);
//--- indexing like in timeseries
   ArraySetAsSeries(FractalUp,true);
   ArraySetAsSeries(FractalDown,true);
//--- next, we use the for loop operator to find the first upper fractal
   for(n=0; n<Bars(Symbol(),PERIOD_D1); n++)
     {
      //--- if the value is not empty, break the loop
      if(FractalUp[n]!=EMPTY_VALUE)
         break;
     }
//--- writing the price value of the first fractal into the variable
   UpFractal_1=FractalUp[n];
//--- writing the index of the first fractal into the variable
   UpperFractal_1=n;
//--- finding the second upper fractal
   for(n=UpperFractal_1+1; n<Bars(Symbol(),PERIOD_D1); n++)
     {
      if(FractalUp[n]!=EMPTY_VALUE) //if the value is not empty, break the loop
         break;
     }
//--- writing the price value of the second fractal into the variable
   UpFractal_2=FractalUp[n];
//--- writing the index of the second fractal into the variable
   UpperFractal_2=n;
--> |
MQL5와 MQL4의 가장 큰 차이점 중 하나가 여기서 나타납니다. 바로 시계열 액세스 함수이죠.
MQL4의 경우 곧바로 해당 인덱스를 찾을 수 있지만 MQL5의 경우는 FractalUp[]과 FractalDown[] 배열을 설정하여 상위 및 하위 프랙탈의 가격 값을 저장하도록 했습니다. CopyBuffer() 함수를 이용해 iFractals 인디케이터에 액세스하면 되죠. 그런 다음 ArraySetAsSeries() 함수로 해당 배열의 인덱싱을 시계열로 설정합니다.
MQL4로는 이미 알려진 프랙탈에 해당하는 바의 인덱스만 알 수 있지만 MQL5로는 CopyBuffer() 함수를 이용해 해당 프랙탈의 바 인덱스와 가격 값을 알 수 있습니다.
같은 방법으로 처음 두 개의 하위 프랙탈을 찾습니다.
| MQL4 |
|---|
//--- finding the bar index of the first nearest lower fractal
   for(n=0; n<(Bars-1);n++)
     {
      if(iFractals(NULL,1440,MODE_LOWER,n)!=NULL)
         break;
      LowerFractal_1=n+1;
     }
//--- finding the bar index of the second nearest lower fractal
   for(n=LowerFractal_1+1; n<(Bars-1);n++)
     {
      if(iFractals(NULL,1440,MODE_LOWER,n)!=NULL)
         break;
      LowerFractal_2=n+1;
     }
--> |
| MQL5 |
|---|
//--- finding the values of the lower fractals
//--- finding the first lower fractal
   for(n=0; n<Bars(Symbol(),PERIOD_D1); n++)
     {
      //--- if the value is not empty, break the loop
      if(FractalDown[n]!=EMPTY_VALUE)
         break;
     }
//--- writing the price value of the first fractal into the variable
   LowFractal_1=FractalDown[n];
//--- writing the index of the first fractal into the variable
   LowerFractal_1=n;
//--- finding the second lower fractal
   for(n=LowerFractal_1+1; n<Bars(Symbol(),PERIOD_D1); n++)
     {
      if(FractalDown[n]!=EMPTY_VALUE)
         break;
     }
//--- writing the price value of the second fractal into the variable
   LowFractal_2=FractalDown[n];
//--- writing the index of the second fractal into the variable
   LowerFractal_2=n;
--> |
보시다시피 코드는 두 언어에서 비슷하게 나타납니다. 신택스에 약간의 차이가 있죠.
3. 프랙탈 가격 및 시간 값 설정
라인을 그리려면 프랙탈의 시간과 가격을 알아야 합니다. 물론 QL4의 경우이미 설정된 시계열 High[]와 Low[], iTime() 함수를 이용해 쉽게 구할 수 있지만 추세선을 정확히 그리기 위해서는 보다 정확한 시간 좌표가 필요합니다.
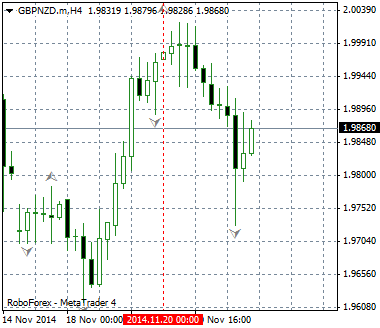
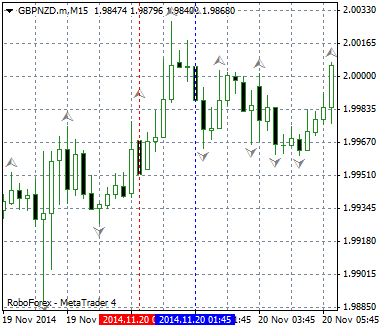
그림 1과 2는 H4와 M15 타임프레임의 극점 시간 값의 차이를 나타냅니다.

그림 1. H4 극점 시간 값

그림 2. M15 극점 시간 값
제가 쓰기에는 15분 내의 타임프레임이 적절했습니다.
일반적으로 MQL4와 MQL5 모두 동일한 극점 지정 방법을 갖지만 몇 가지 디테일에 차이가 있습니다.
| MQL4 | MQL5 |
|---|---|
|
|
단계 별 코드는 다음과 같습니다.
| MQL4 |
|---|
// Step 1. Determining the extreme point time value on a larger timeframe:
//--- determining the time of fractals
   datetime UpFractalTime_1=iTime(NULL, 1440,UpperFractal_1);
   datetime UpFractalTime_2=iTime(NULL, 1440,UpperFractal_2);
   datetime LowFractalTime_1=iTime(NULL, 1440,LowerFractal_1);
   datetime LowFractalTime_2=iTime(NULL, 1440,LowerFractal_2);
--> |
// Step 2.  Determining the index of the extreme bar on a smaller timeframe:
//--- finding the fractal index on M15
   int UpperFractal_1_m15=iBarShift(NULL, 15, UpFractalTime_1,true);
   int UpperFractal_2_m15=iBarShift(NULL, 15, UpFractalTime_2,true);
   int LowerFractal_1_m15=iBarShift(NULL, 15, LowFractalTime_1,true);
   int LowerFractal_2_m15=iBarShift(NULL, 15, LowFractalTime_2,true);
--> |
// Step 3. Using the arrays to find the clarified extreme points on М15:
//--- using the arrays to find the clarified extreme points
//--- introducing the i variable to use in the for loop operator
   int i;
//--- 1. First, find the lower extreme points
//--- 3.1 Finding the first lower extreme point
//--- declaring the array for storing the index values of the bars
   int Lower_1_m15[96];
//--- declaring the array for storing the price values
   double LowerPrice_1_m15[96];
//--- starting the for loop:
   for(i=0;i<=95;i++)
     {
      //--- filling the array with the bar index values
      Lower_1_m15[i]=LowerFractal_1_m15-i;
      //--- filling the array with the price values
      LowerPrice_1_m15[i]=iLow(NULL,15,LowerFractal_1_m15-i);
     }
//--- determining the minimum price value in the array
   int LowestPrice_1_m15=ArrayMinimum(LowerPrice_1_m15,WHOLE_ARRAY,0);
//--- determining the bar with the lowest price in the array
   int LowestBar_1_m15=Lower_1_m15[LowestPrice_1_m15];
//--- determining the time of the lowest price bar
   datetime LowestBarTime_1_m15=iTime(NULL,15,Lower_1_m15[LowestPrice_1_m15]);

//--- 3.2 Finding the second lower extreme point
   int Lower_2_m15[96];
   double LowerPrice_2_m15[96];
   for(i=0;i<=95;i++)
     {
      //--- filling the array with the bar index values
      Lower_2_m15[i]=LowerFractal_2_m15-i;
      //--- filling the array with the price values
      LowerPrice_2_m15[i]=iLow(NULL,15,LowerFractal_2_m15-i);
     }
//--- determining the minimum price value in the array
   int LowestPrice_2_m15=ArrayMinimum(LowerPrice_2_m15,WHOLE_ARRAY,0);
//--- determining the bar with the lowest price in the array
   int LowestBar_2_m15=Lower_2_m15[LowestPrice_2_m15];
//--- determining the time of the lowest price bar
   datetime LowestBarTime_2_m15=iTime(NULL,15,Lower_2_m15[LowestPrice_2_m15]);

//--- 3.3 Finding the first upper extreme point
   int Upper_1_m15[96];
   double UpperPrice_1_m15[96];
   for(i=0;i<=95;i++)
     {
      //--- filling the array with the bar index values
      Upper_1_m15[i]=UpperFractal_1_m15-i;
      //--- filling the array with the price values
      UpperPrice_1_m15[i]=iHigh(NULL,15,UpperFractal_1_m15-i);
     }
//--- determining the maximum price value in the array
   int HighestPrice_1_m15=ArrayMaximum(UpperPrice_1_m15,WHOLE_ARRAY,0);
//--- determining the bar with the highest price in the array
   int HighestBar_1_m15=Upper_1_m15[HighestPrice_1_m15];
//--- determining the time of the highest price bar
   datetime HighestBarTime_1_m15=iTime(NULL,15,Upper_1_m15[HighestPrice_1_m15]);

//--- 3.4 Finding the second upper extreme point
   int Upper_2_m15[96];
   double UpperPrice_2_m15[96];
   for(i=0;i<=95;i++)
     {
      //--- filling the array with the bar index values
      Upper_2_m15[i]=UpperFractal_2_m15-i;
      //--- filling the array with the price values
      UpperPrice_2_m15[i]=iHigh(NULL,15,UpperFractal_2_m15-i);
     }
--> |
| MQL5 |
|---|
// Step 1. Determining the extreme point time value on a larger timeframe:
//--- declaring the arrays for storing the time values of the corresponding bar index on a larger timeframe
   datetime UpFractalTime_1[],LowFractalTime_1[],UpFractalTime_2[],LowFractalTime_2[];
//--- determining the time of fractals on a larger timeframe
   CopyTime(Symbol(),PERIOD_D1,UpperFractal_1,1,UpFractalTime_1);
   CopyTime(Symbol(),PERIOD_D1,LowerFractal_1,1,LowFractalTime_1);
   CopyTime(Symbol(),PERIOD_D1,UpperFractal_2,1,UpFractalTime_2);
   CopyTime(Symbol(),PERIOD_D1,LowerFractal_2,1,LowFractalTime_2);
--> |
// Step 2. Determining the generation time of the next day bar:
//--- determining the generation time of the next day bar (the stop time for CopyHigh(), CopyLow() and CopyTime())
   datetime UpFractalTime_1_15=UpFractalTime_1[0]+86400;
   datetime UpFractalTime_2_15=UpFractalTime_2[0]+86400;
   datetime LowFractalTime_1_15=LowFractalTime_1[0]+86400;
   datetime LowFractalTime_2_15=LowFractalTime_2[0]+86400;
--> |
// Step 3. Declaring and filling the arrays for storing the price and time values for the 15-minute timeframe:
//--- declaring the arrays for storing the maximum and minimum price values
   double High_1_15[],Low_1_15[],High_2_15[],Low_2_15[];
//--- filling the arrays with the CopyHigh() and CopyLow() functions
   CopyHigh(Symbol(),PERIOD_M15,UpFractalTime_1[0],UpFractalTime_1_15,High_1_15);
   CopyHigh(Symbol(),PERIOD_M15,UpFractalTime_2[0],UpFractalTime_2_15,High_2_15);
   CopyLow(Symbol(),PERIOD_M15,LowFractalTime_1[0],LowFractalTime_1_15,Low_1_15);
   CopyLow(Symbol(),PERIOD_M15,LowFractalTime_2[0],LowFractalTime_2_15,Low_2_15);
//--- declaring the arrays for storing the time values corresponding to the extreme bar indexes
   datetime High_1_15_time[],High_2_15_time[],Low_1_15_time[],Low_2_15_time[];
//--- filling the arrays
   CopyTime(Symbol(),PERIOD_M15,UpFractalTime_1[0],UpFractalTime_1_15,High_1_15_time);
   CopyTime(Symbol(),PERIOD_M15,UpFractalTime_2[0],UpFractalTime_2_15,High_2_15_time);
   CopyTime(Symbol(),PERIOD_M15,LowFractalTime_1[0],LowFractalTime_1_15,Low_1_15_time);
   CopyTime(Symbol(),PERIOD_M15,LowFractalTime_2[0],LowFractalTime_2_15,Low_2_15_time);
--> |
// Step 4. Finding the lowest and highest price values, and the time values of the clarified extreme points:
//--- determining the highest and lowest price and time values with the ArrayMaximum() and ArrayMinimum() functions
   int Max_M15_1=ArrayMaximum(High_1_15,0,96);
   int Max_M15_2=ArrayMaximum(High_2_15,0,96);
   int Min_M15_1=ArrayMinimum(Low_1_15,0,96);
   int Min_M15_2=ArrayMinimum(Low_2_15,0,96);
--> |
그 결과 다음의 추세선 좌표가 구해집니다.
1. 지지선
| MQL4 | MQL5 |
|---|---|
|
|
2. 저항선
| MQL4 | MQL5 |
|---|---|
|
|
4. 객체 생성 및 프로퍼티 설정 라인 리드로잉
각 선의 좌표를 얻었으니 이제 그래픽 객체를 생성할 일만 남았습니다.
| MQL4 |
|---|
//--- creating the support line
   ObjectCreate(0,"TL_Support",OBJ_TREND,0,LowestBarTime_2_m15,LowerPrice_2_m15[LowestPrice_2_m15],
                LowestBarTime_1_m15,LowerPrice_1_m15[LowestPrice_1_m15]);
   ObjectSet("TL_Support",OBJPROP_COLOR,Support_Color);
   ObjectSet("TL_Support",OBJPROP_STYLE,Support_Style);
   ObjectSet("TL_Support",OBJPROP_WIDTH,Support_Width);
//--- creating the resistance line
   ObjectCreate(0,"TL_Resistance",OBJ_TREND,0,HighestBarTime_2_m15,UpperPrice_2_m15[HighestPrice_2_m15],
                HighestBarTime_1_m15,UpperPrice_1_m15[HighestPrice_1_m15]);
   ObjectSet("TL_Resistance",OBJPROP_COLOR,Resistance_Color);
   ObjectSet("TL_Resistance",OBJPROP_STYLE,Resistance_Style);
   ObjectSet("TL_Resistance",OBJPROP_WIDTH,Resistance_Width);
--> |
| MQL5 |
|---|
//--- creating the support line
   ObjectCreate(0,"TL_Support",OBJ_TREND,0,Low_2_15_time[Min_M15_2],Low_2_15[Min_M15_2],Low_1_15_time[Min_M15_1],Low_1_15[Min_M15_1]);
   ObjectSetInteger(0,"TL_Support",OBJPROP_RAY_RIGHT,true);
   ObjectSetInteger(0,"TL_Support",OBJPROP_COLOR,Support_Color);
   ObjectSetInteger(0,"TL_Support",OBJPROP_STYLE,Support_Style);
   ObjectSetInteger(0,"TL_Support",OBJPROP_WIDTH,Support_Width);
//--- creating the resistance line
   ObjectCreate(0,"TL_Resistance",OBJ_TREND,0,High_2_15_time[Max_M15_2],High_2_15[Max_M15_2],High_1_15_time[Max_M15_1],High_1_15[Max_M15_1]);
   ObjectSetInteger(0,"TL_Resistance",OBJPROP_RAY_RIGHT,true);
   ObjectSetInteger(0,"TL_Resistance",OBJPROP_COLOR,Resistance_Color);
   ObjectSetInteger(0,"TL_Resistance",OBJPROP_STYLE,Resistance_Style);
   ObjectSetInteger(0,"TL_Resistance",OBJPROP_WIDTH,Resistance_Width);
--> |
필요한 선을 그리고 입력 매개 변수를 기준으로 변수를 설정했죠.
이제 추세선을 다시 그려야 합니다.
시장 상황에 변동이 있는 경우, 예를 들어 새로운 극점이 나타나는 경우, 기존의 선을 지우면 됩니다.
| MQL4 |
|---|
//--- redrawing the support line
//--- writing the values of the support line time coordinates into the variables
   datetime TL_TimeLow2=ObjectGet("TL_Support",OBJPROP_TIME2);
   datetime TL_TimeLow1=ObjectGet("TL_Support",OBJPROP_TIME1);
//--- if the line coordinates don't match the current coordinates
   if(TL_TimeLow2!=LowestBarTime_1_m15 && TL_TimeLow1!=LowestBarTime_2_m15)
     {
      //--- remove the line
      ObjectDelete(0,"TL_Support");
     }
//--- redrawing the resistance line
//--- writing the values of the resistance line time coordinates into the variables
   datetime TL_TimeUp2=ObjectGet("TL_Resistance",OBJPROP_TIME2);
   datetime TL_TimeUp1=ObjectGet("TL_Resistance",OBJPROP_TIME1);
//--- if the line coordinates don't match the current coordinates
   if(TL_TimeUp2!=HighestBarTime_1_m15 && TL_TimeUp1!=HighestBarTime_2_m15)
     {
      //--- remove the line
      ObjectDelete(0,"TL_Resistance");
     }
--> |
| MQL5 |
|---|
//--- redrawing the support line
//--- writing the values of the support line time coordinates into the variables
   datetime TL_TimeLow2=(datetime)ObjectGetInteger(0,"TL_Support",OBJPROP_TIME,0);
   datetime TL_TimeLow1=(datetime)ObjectGetInteger(0,"TL_Support",OBJPROP_TIME,1);
//--- if the line coordinates don't match the current coordinates
   if(TL_TimeLow2!=Low_2_15_time[Min_M15_2] && TL_TimeLow1!=Low_1_15_time[Min_M15_1])
     {
      //--- remove the line
      ObjectDelete(0,"TL_Support");
     }
//--- redrawing the resistance line
//--- writing the values of the resistance line time coordinates into the variables
   datetime TL_TimeUp2=(datetime)ObjectGetInteger(0,"TL_Resistance",OBJPROP_TIME,0);
   datetime TL_TimeUp1=(datetime)ObjectGetInteger(0,"TL_Resistance",OBJPROP_TIME,1);
//--- if the line coordinates don't match the current coordinates
   if(TL_TimeUp2!=High_2_15_time[Max_M15_2] && TL_TimeUp1!=High_1_15_time[Max_M15_1])
     {
      //--- remove the line
      ObjectDelete(0,"TL_Resistance");
     }
--> |
5. 로딩된 바 기록 확인
테스트를 하다 보니 선이 항상 제대로 그려지는 건 아니더군요.
처음에는 코드에 버그가 있거나 제 솔루션이 완전히 잘못됐나 싶었지만 알고 보니 바 과거 기록이 충분하지 않아서 였습니다. 제 경우 M15 타임프레임을 사용해서 그랬죠. 다른 사용자들이 해당 문제를 겪지 않도록 M15에 바가 있는지 확인하는 추가 프로그램을 작성했습니다.
MQL4의 iBarShift() 함수 기능을 이용했는데요. 앞서 '프랙탈 가격 및 시간 값 설정'에서 사용한 바 있습니다.
바가 없으면 iBarShift() 함수는 -1을 반환합니다. 따라서 다음의 경고 메세지를 보낼 수 있죠.
| MQL4 |
|---|
//--- checking the bars history loading
//--- if at least one bar is not found on M15
   if(UpperFractal_1_m15==-1 || UpperFractal_2_m15==-1
      || LowerFractal_1_m15==-1 || LowerFractal_2_m15==-1)
     {
      Alert("The loaded history is insufficient for the correct work!");
     }
--> |
MQL5의 경우 Bars() 함수를 이용했는데요. 터미널에서 시계열 데이터가 생성되지 않은 경우 빈 값을 반환하게 됩니다.
//--- checking the bars history loading
//--- 1. determining the number of bars on a specified timeframe
   int High_M15_1=Bars(Symbol(),PERIOD_M15,UpFractalTime_1[0],UpFractalTime_1_15);
   int High_M15_2=Bars(Symbol(),PERIOD_M15,UpFractalTime_2[0],UpFractalTime_2_15);
   int Low_M15_1=Bars(Symbol(),PERIOD_M15,LowFractalTime_1[0],LowFractalTime_1_15);
   int Low_M15_2=Bars(Symbol(),PERIOD_M15,LowFractalTime_2[0],LowFractalTime_2_15);
//--- 2. check if the loaded history is insufficient for the correct line drawing
//--- if at least one bar is not found
   if(High_M15_1==0 || High_M15_2==0 || Low_M15_1==0 || Low_M15_2==0)
     {
      Alert("The loaded history is insufficient for the correct work!");
     }
--> |
6. 추세선 돌파 시그널 및 푸시 알림
추세선 돌파 시그널도 구현하기로 했습니다. 추세선은 일간 타임프레임의 극점을 이용해 그려집니다. 하지만 그 전에 돌파점을 구하려면 H4 추세선보다 낮거나 높은 곳에서 바가 닫혀야 합니다.
다음의 세 가지 단계로 과정을 나누어 보겠습니다.
- 바 클로징 가격 및 추세선 가격 판단
- 추세선 돌파 조건 판단
- 돌파에 대한 푸쉬 알림 전송
| MQL4 |
|---|
// 1. Getting the price parameters of the trend line
//--- determining the closing price of a bar with index 1
   double Price_Close_H4=iClose(NULL,240,1);
//--- determining the time of a bar with index 1
   datetime Time_Close_H4=iTime(NULL,240,1);
//--- determining the bar index on H4
   int Bar_Close_H4=iBarShift(NULL,240,Time_Close_H4);
//--- determining the price of the line on H4
   double Price_Resistance_H4=ObjectGetValueByShift("TL_Resistance",Bar_Close_H4);
//--- determining the price of the line on H4
   double Price_Support_H4=ObjectGetValueByShift("TL_Support",Bar_Close_H4);
--> |
// 2. Conditions for trend line breakthroughs
//--- for breaking through the support line
   bool breakdown=(Price_Close_H4<Price_Support_H4);
//--- for braking through the resistance line
   bool breakup=(Price_Close_H4>Price_Resistance_H4);
--> |
// 3. Delivering the push notifications
   if(breakdown==true)
     {
      //--- send no more than one notification per 4 hours
      int SleepMinutes=240;
      static int LastTime=0;
      if(TimeCurrent()>LastTime+SleepMinutes*60)
        {
         LastTime=TimeCurrent();
         SendNotification(Symbol()+"The price has broken through the support line");
        }
     }
   if(breakup==true)
     {
      //--- send no more than one notification per 4 hours
      SleepMinutes=240;
      LastTime=0;
      if(TimeCurrent()>LastTime+SleepMinutes*60)
        {
         LastTime=TimeCurrent();
         SendNotification(Symbol()+"The price has broken through the resistance line");
        }
     }
--> |
| MQL5 |
|---|
// 1. Getting the price parameters of the trend line
   double Close[];
   CopyClose(Symbol(),PERIOD_H4,TimeCurrent(),10,Close);
//--- setting the array indexing order
   ArraySetAsSeries(Close,true);
//---
   datetime Close_time[];
   CopyTime(Symbol(),PERIOD_H4,TimeCurrent(),10,Close_time);
//--- setting the array indexing order
   ArraySetAsSeries(Close_time,true);
//---
   double Price_Support_H4=ObjectGetValueByTime(0,"TL_Support",Close_time[1]);
   double Price_Resistance_H4=ObjectGetValueByTime(0,"TL_Resistance",Close_time[1]);
--> |
// 2. Conditions for trend line breakthroughs
   bool breakdown=(Close[1]<Price_Support_H4);
   bool breakup=(Close[1]>Price_Resistance_H4);
--> |
// 3. Delivering the push notifications
   if(breakdown==true)
     {
      //--- send no more than one notification per 4 hours
      int SleepMinutes=240;
      static int LastTime=0;
      if(TimeCurrent()>LastTime+SleepMinutes*60)
        {
         LastTime=(int)TimeCurrent();
         SendNotification(Symbol()+"The price has broken through the support line");
        }
     }
   if(breakup==true)
     {
      //--- send no more than one notification per 4 hours
      int SleepMinutes=240;
      static int LastTime=0;
      if(TimeCurrent()>LastTime+SleepMinutes*60)
        {
         LastTime=(int)TimeCurrent();
         SendNotification(Symbol()+"The price has broken through the resistance line");
        }
     }
--> |
돌파 지점 판단에는 MQL4의 ObjectGetValueByShift() 함수와 MQL5의 ObjectGetValueByTime() 함수가 사용됐습니다.
어쩌면 Bar_Close_H4 대신에 1을 ObjectGetValueByShift()의 매개 변수로 설정할 수도 있겠는데요. 그래도 우선 H4에 대한 인덱스를 구하기로 했습니다. 전송된 메세지 수를 제한하기 위해 이 포럼 글에 소개된 방법을 이용했습니다. 작성자에게 고맙다는 말을 전합니다.
7. 추세선의 실제 적용
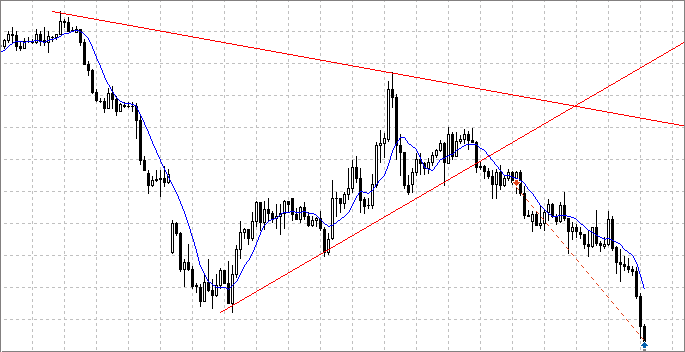
가장 간단한 방법은 돌파 지점을 찾은 후 풀백을 기다렸다가 그 후에 시장에 진입하는 겁니다.
아마 다음과 같은 결과가 나올 겁니다.

그림 3. 추세선 돌파
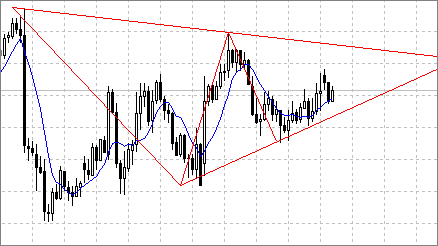
그 후에는 기술적 분석 패턴이랄지 어떤 패턴을 찾아볼 수 있죠. 예를 들어 삼각형이 있겠네요.

그림 4. 삼각형 패턴
위의 경우 보다 좁은 타임프레임에 대해서는 적용해 보지 않았습니다.
결론
이번 글이 여러분에게 도움이 되었으면 좋겠네요. 저같은 프로그래밍 초보자들을 대상으로 쓴 글입니다.
이 글을 쓰면서 저도 많이 배웠습니다. 좀 더 의미있는 코드 코멘트를 작성하게 됐고, 극점을 찾는 솔루션이 처음에는 아주 복잡했는데 더 간단한 방법을 찾을 수 있었죠.
읽어 주셔서 고맙습니다. 피드백은 항상 환영합니다.
MetaQuotes 소프트웨어 사를 통해 러시아어가 번역됨.
원본 기고글: https://www.mql5.com/ru/articles/1201
경고: 이 자료들에 대한 모든 권한은 MetaQuotes(MetaQuotes Ltd.)에 있습니다. 이 자료들의 전부 또는 일부에 대한 복제 및 재출력은 금지됩니다.
이 글은 사이트 사용자가 작성했으며 개인의 견해를 반영합니다. Metaquotes Ltd는 제시된 정보의 정확성 또는 설명 된 솔루션, 전략 또는 권장 사항의 사용으로 인한 결과에 대해 책임을 지지 않습니다.
 리퀴드 차트
 MQL5 쿡북: BookEvent 핸들링
 MQL5 프로그래밍 기초: 터미널 글로벌 변수
 일반 VPS보다 MetaTrader4, MetaTrader5 가상 호스팅이 더 나은 이유
안녕하세요 - 모든 코딩을 이해하는 척할 수는 없지만, 제가 직접 코딩하려고 시도했던 것과 정확히 일치하므로 (매우 초보자로서 심하게) 코딩을 진행 중입니다.
EA를 다시 만들고 MQL4에서 성공적으로 준수했으며 처음 초기화 할 때 지지선과 저항선을 그리고 알림을 보내지 만 새로운 극한 점 프랙탈이 나타날 때 새로운 지지선과 저항선을 다시 그리지 않습니다-그런가요? 제가 뭔가 놓친 것이 있나요?
또한 차트에 프랙탈을 표시 할 수 없었지만 전략 테스터에서 EA를 테스트하면 테스트를 중지 한 후 프랙탈이 올바르게 표시됩니까? 내가 무엇을 다시 놓치고 있는지 어떤 아이디어가 있습니까?
그런데 천재적인 작업, 프랙탈과 극한 지점에 대한 추세선은 코딩은 말할 것도없고 설명하기가 쉽지 않습니다 :)
최고의 안부
Andy
안녕하세요, 첫 번째 질문에 대해 : 새 추세선이 다시 그려지지 않으면 생성 된 개체를 삭제하는 코드를 사용하지 않았을 수 있습니다. 글의 4번째 부분을 보세요. 두 번째 질문에 대해 : 테스터 용 프랙탈로 새 템플릿을 만들고 "tester.tpl"이라고 할 수 있습니다. 그 후 테스터를 사용할 때 프랙탈이 항상 차트에 표시됩니다.
안녕하세요, 첫 번째 질문에 대해: 새 추세선이 다시 그려지지 않는다면 생성된 개체를 삭제하는 코드를 사용하지 않은 것일 수 있습니다. 글의 4번째 부분을 보세요. 두 번째 질문 : 테스터 용 프랙탈로 새 템플릿을 만들고 "tester.tpl"이라고 할 수 있습니다. 그 이후에는 테스터를 사용할 때 항상 차트에 프랙탈이 표시됩니다.
답변 주셔서 감사합니다. 밤새 두 개의 차트 (4 시간 차트 1 개와 15m = M 차트 1 개)에 EA를 첨부하여 다시 그렸으므로 인내심이 부족하여 죄송합니다.
tester.pl에 대한 팁을 주셔서 감사합니다.
많은 감사
테스터에서 드로잉 라인을 올바르게 작동하고 첫 번째 시점에 달라 붙지 않으려면 추세선 생성 위의 하단에서 선 제어를 넣어야합니다.
귀하의 기사에 감사드립니다. 아이디어를 살펴보고 제 EA에 적용하도록 노력하겠습니다.
다시 한번 감사드리며 행복한 거래 되세요.
전문가 어드바이저로서도, MQL4의 지표로서도 전혀 징후가 보이지 않습니다!!!!!!!!!!!!!!!!!!!. 등급을 올리기 위해 무엇이든 많이 업로드하는 것이 그렇게 재미 있습니까?
초기화 후 OnTick 기능을 추가하여 새로운 가격이 도착할 때가 아니라 주말에 그리고 일반적으로 차트에 붙이는 즉시 작동하도록 해 보겠습니다.