EA Performance Ledger
- Utilità
- Versione: 1.0
- Attivazioni: 10

EA Performance Ledger shows what every Expert Advisor on your account really earns. MetaTrader shows one balance for the whole account; when several EAs, manual trades and copied signals share it, you cannot see which one carries the account and which one drains it. The Ledger reads the account history, rebuilds every closed position and splits the results by EA, symbol, strategy tag, direction and manual vs automated trading, in one clear dashboard.
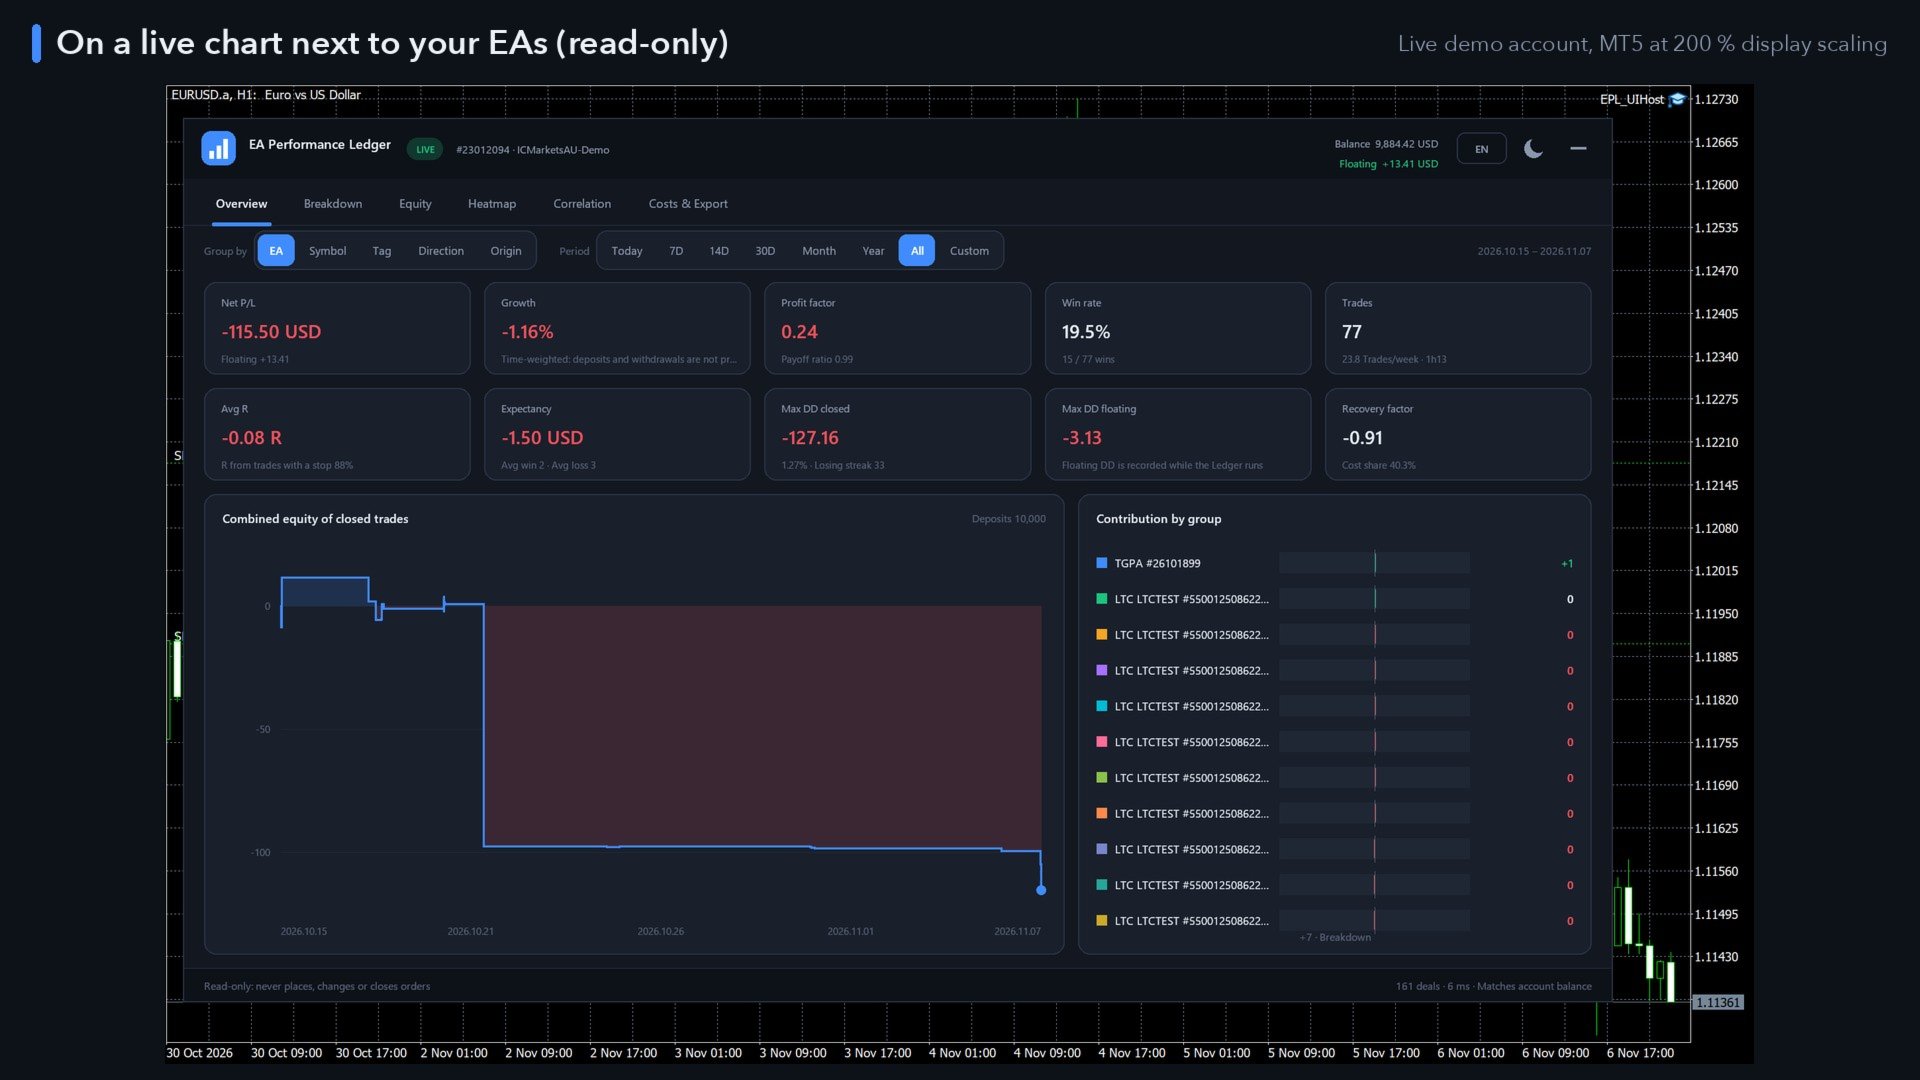
Read-only. The Ledger never places, modifies or closes an order. It contains no trading strategy and works next to any EA, on any symbol and timeframe, on hedging and netting accounts.
Group your results five ways
- EA – by magic number; optionally split one EA into strategies by its order comment. Names are learned from the comments, and you can give every EA your own name (click its name, or use the Names input, e.g. 1101=Trend Rider; 2202=Mean Reversion).
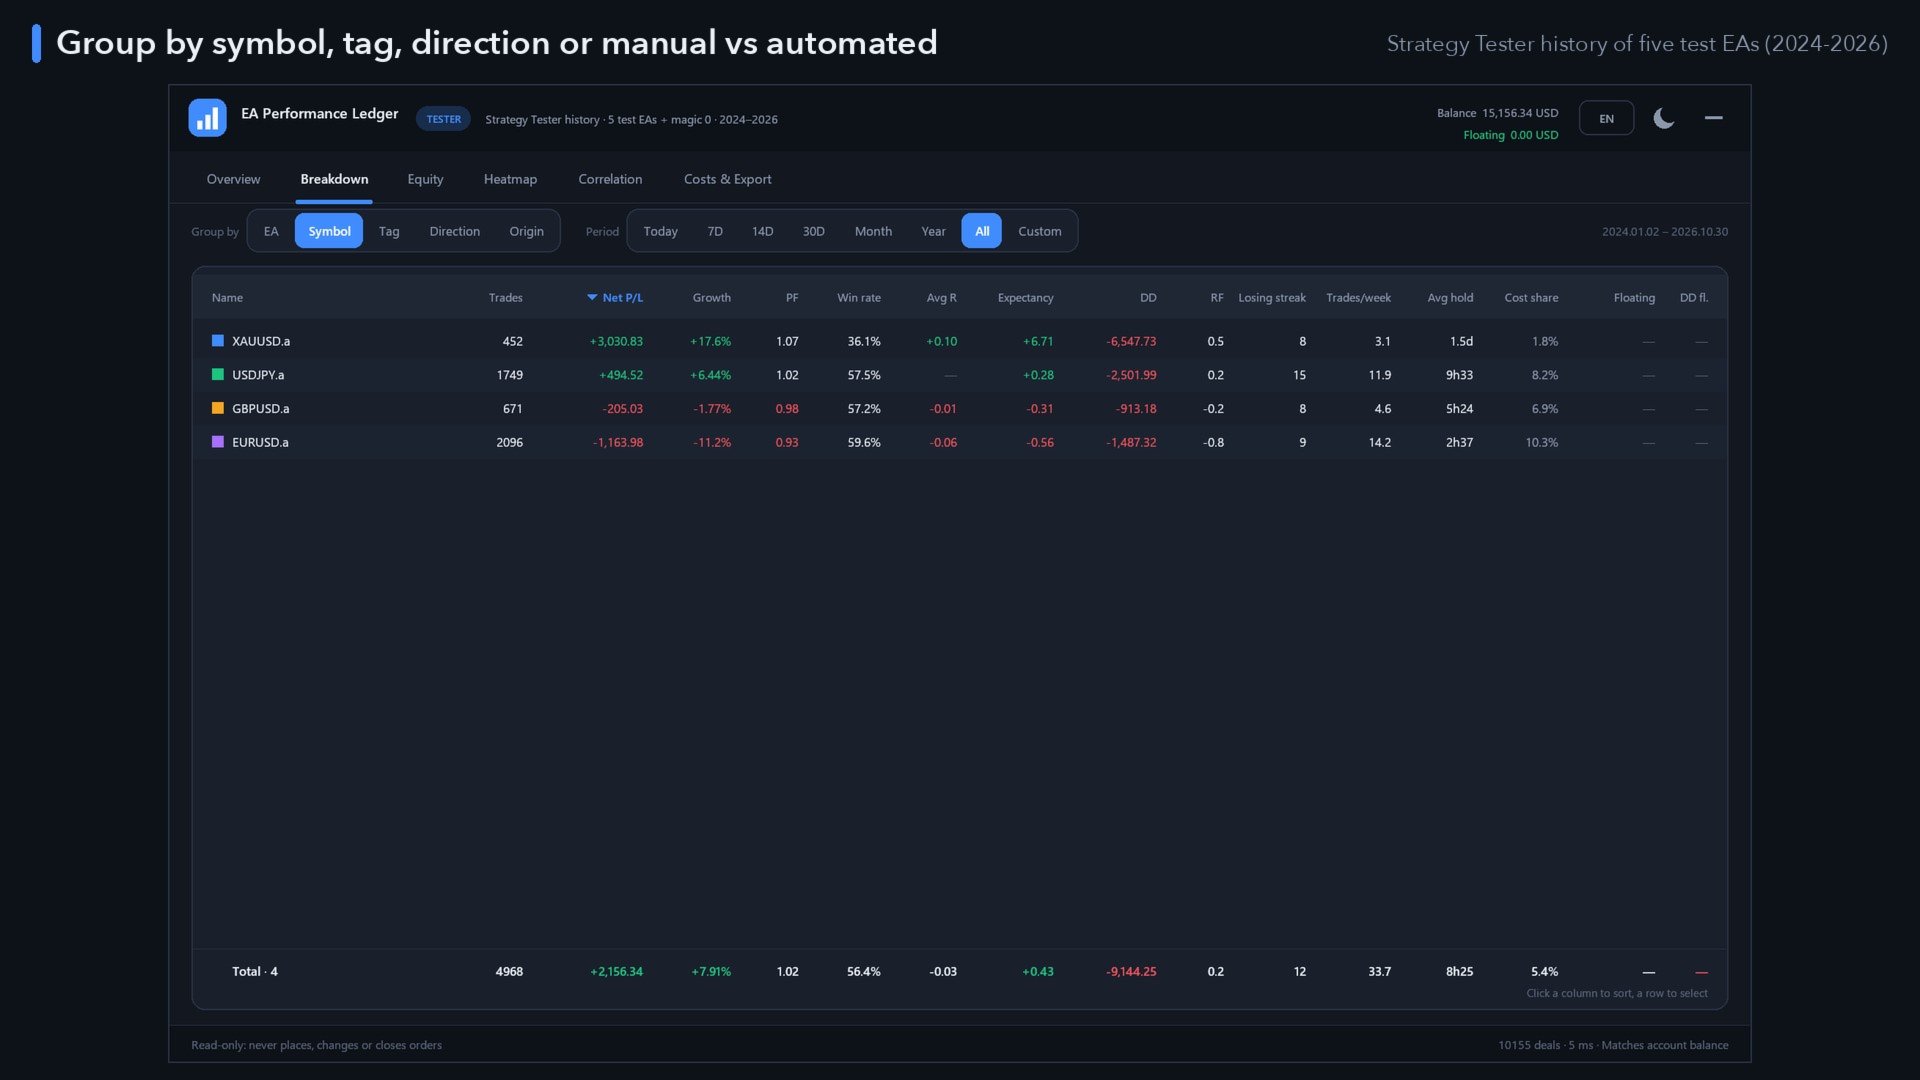
- Symbol, strategy tag (first word of the comment), direction (buy / sell) and origin (manual vs automated).
- Manual trades can be included or left out with one switch.
Metrics for every group and for the total
- Net P/L and growth % – time-weighted, so deposits and withdrawals never count as profit or loss.
- Profit factor, win rate, payoff ratio, best and worst trade.
- Average R and expectancy – R is measured from each position's first stop loss; trades without a stop are left out and the coverage is shown, nothing is guessed.
- Max drawdown closed (money and % of the balance at the high) and max drawdown floating (closed result plus open P/L, recorded while the Ledger runs).
- Recovery factor, longest losing streak, trades per week, average holding time.
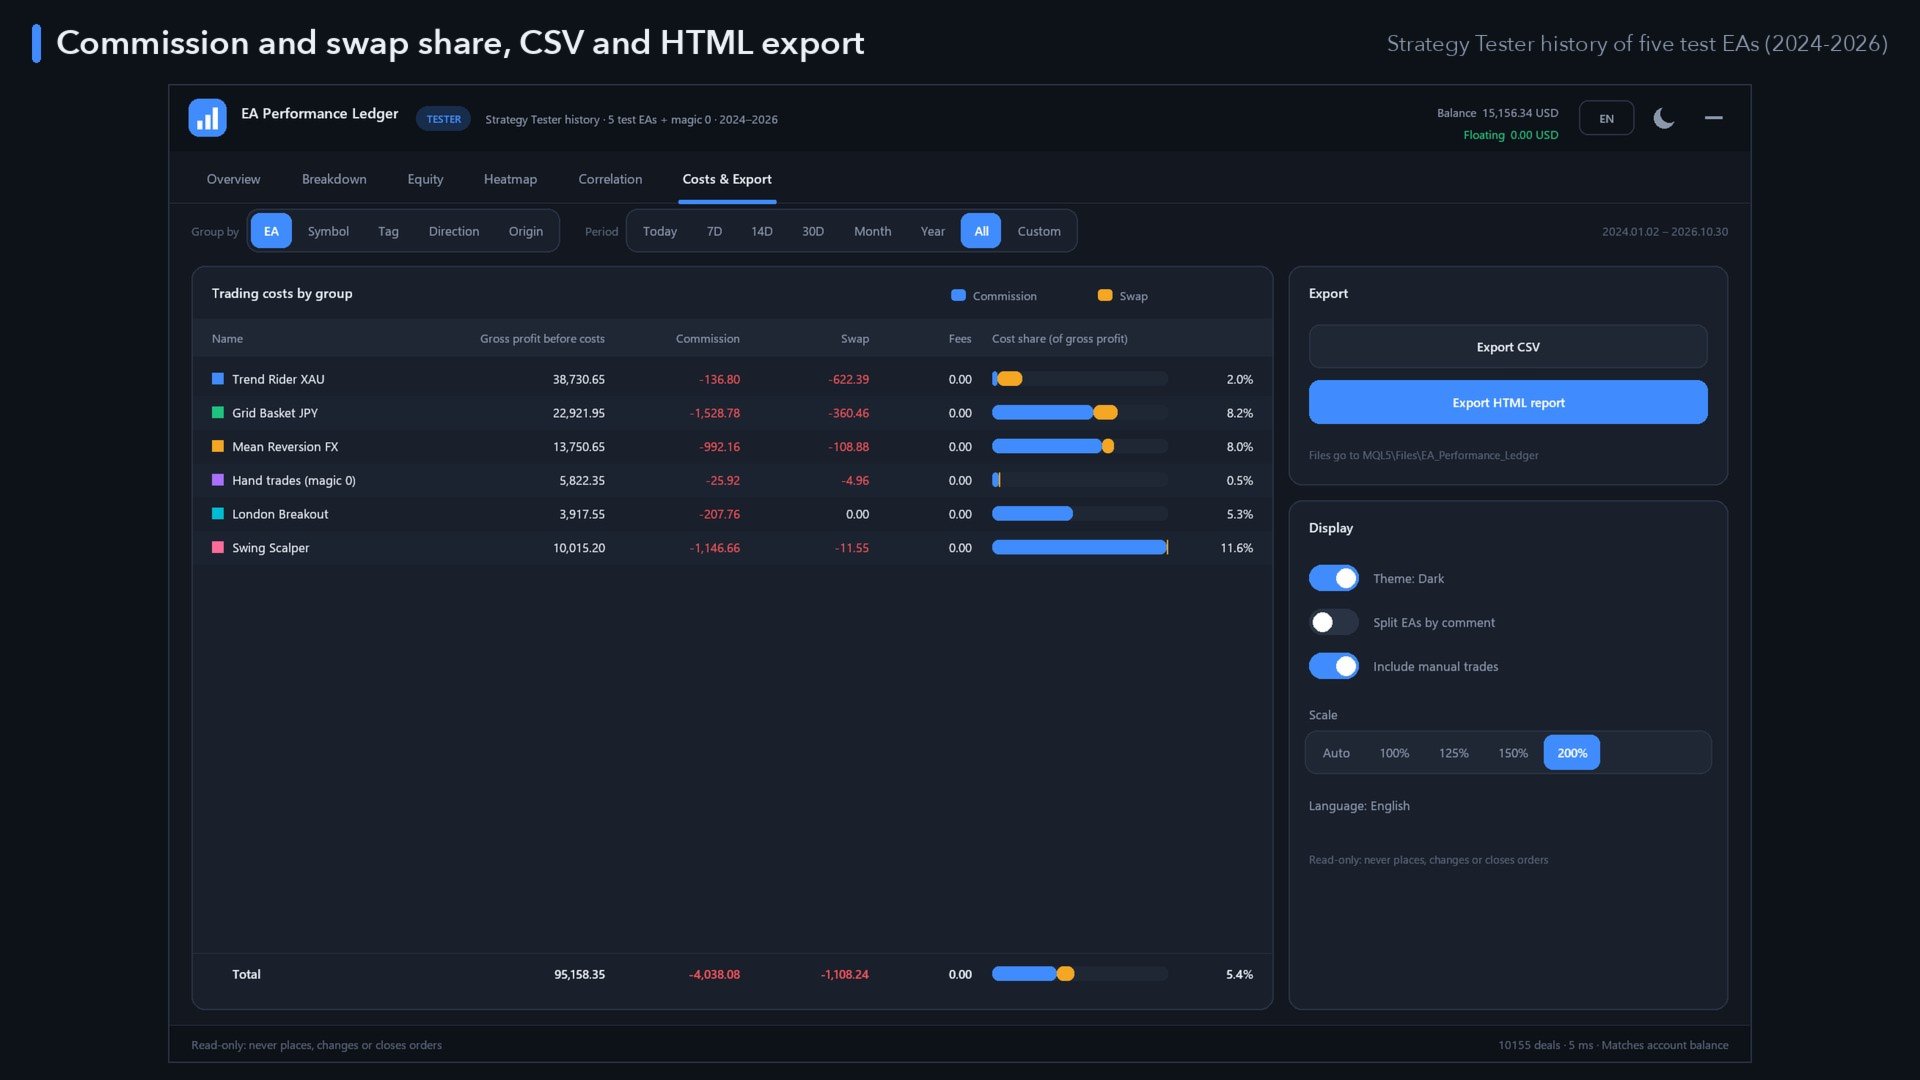
- Commission and swap share – how much of the gross profit your costs eat.
- Floating P/L and number of open positions per group.
Six tabs
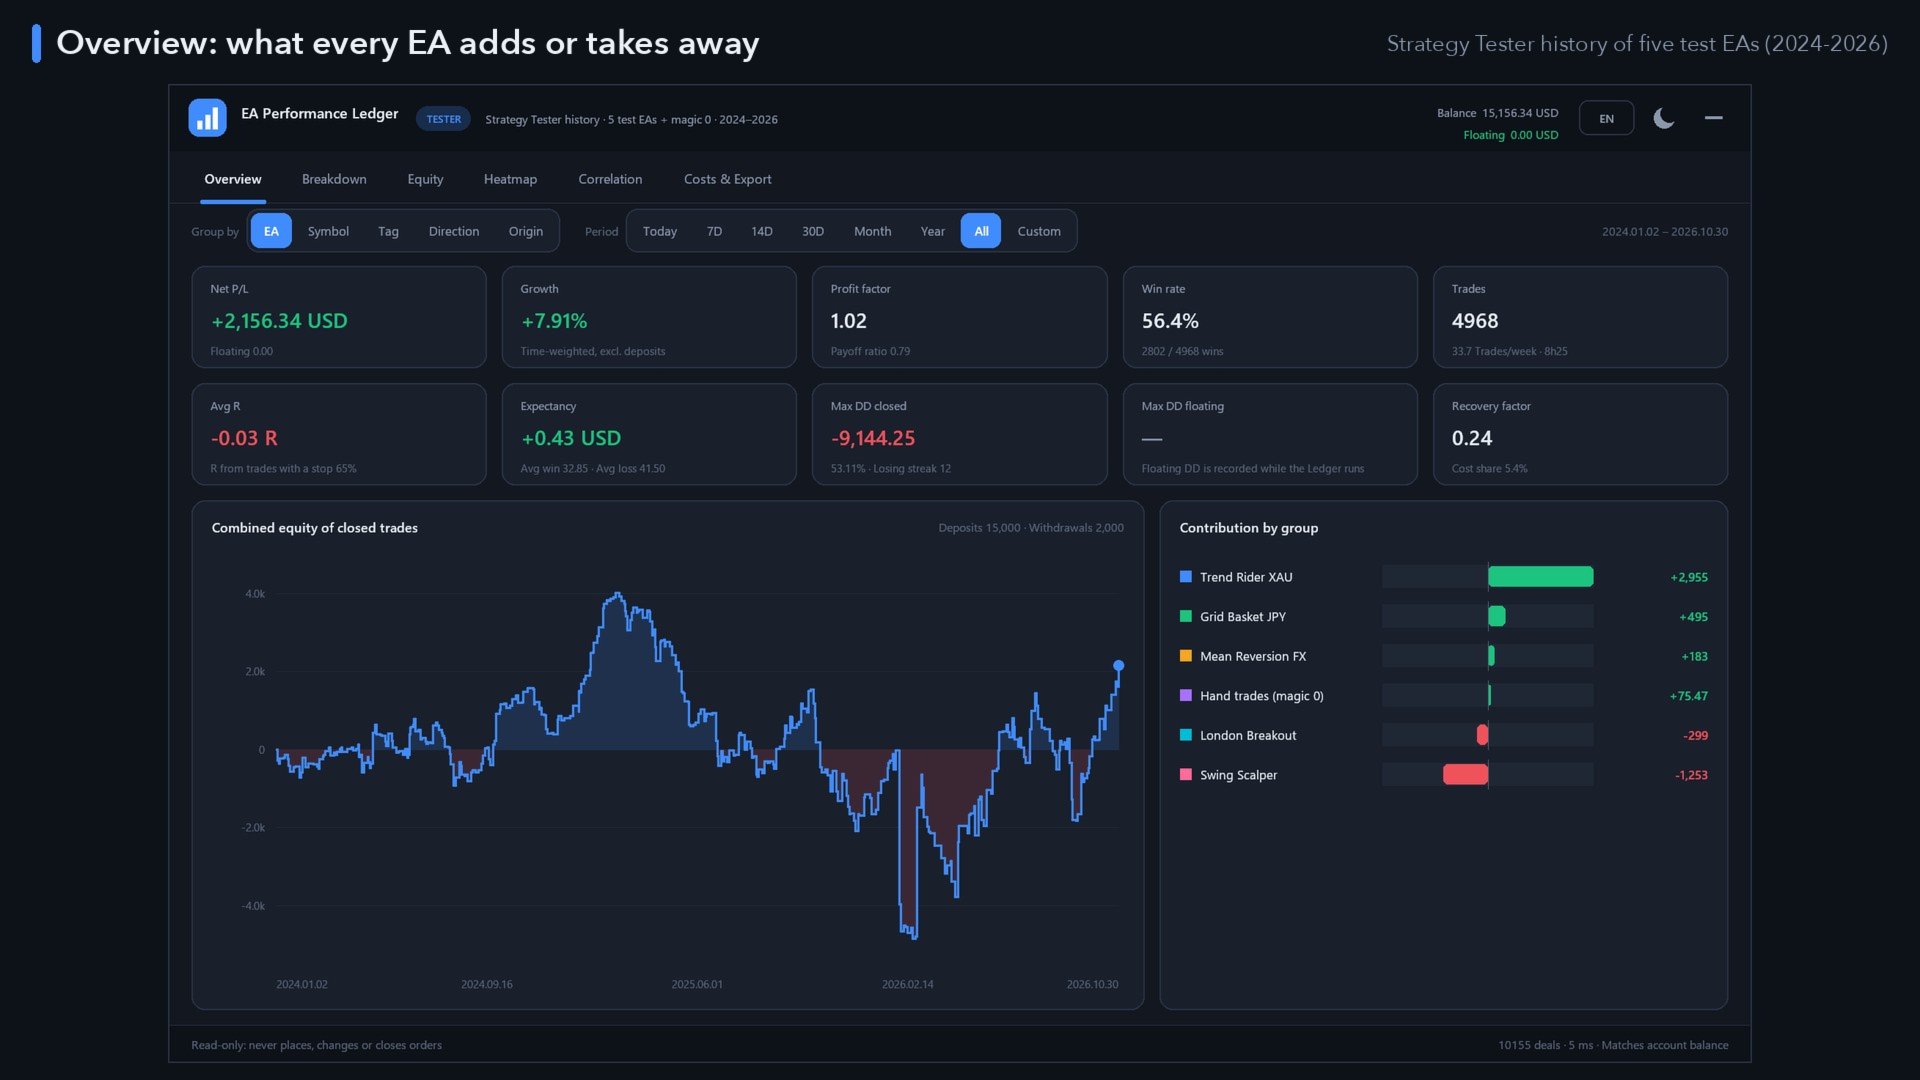
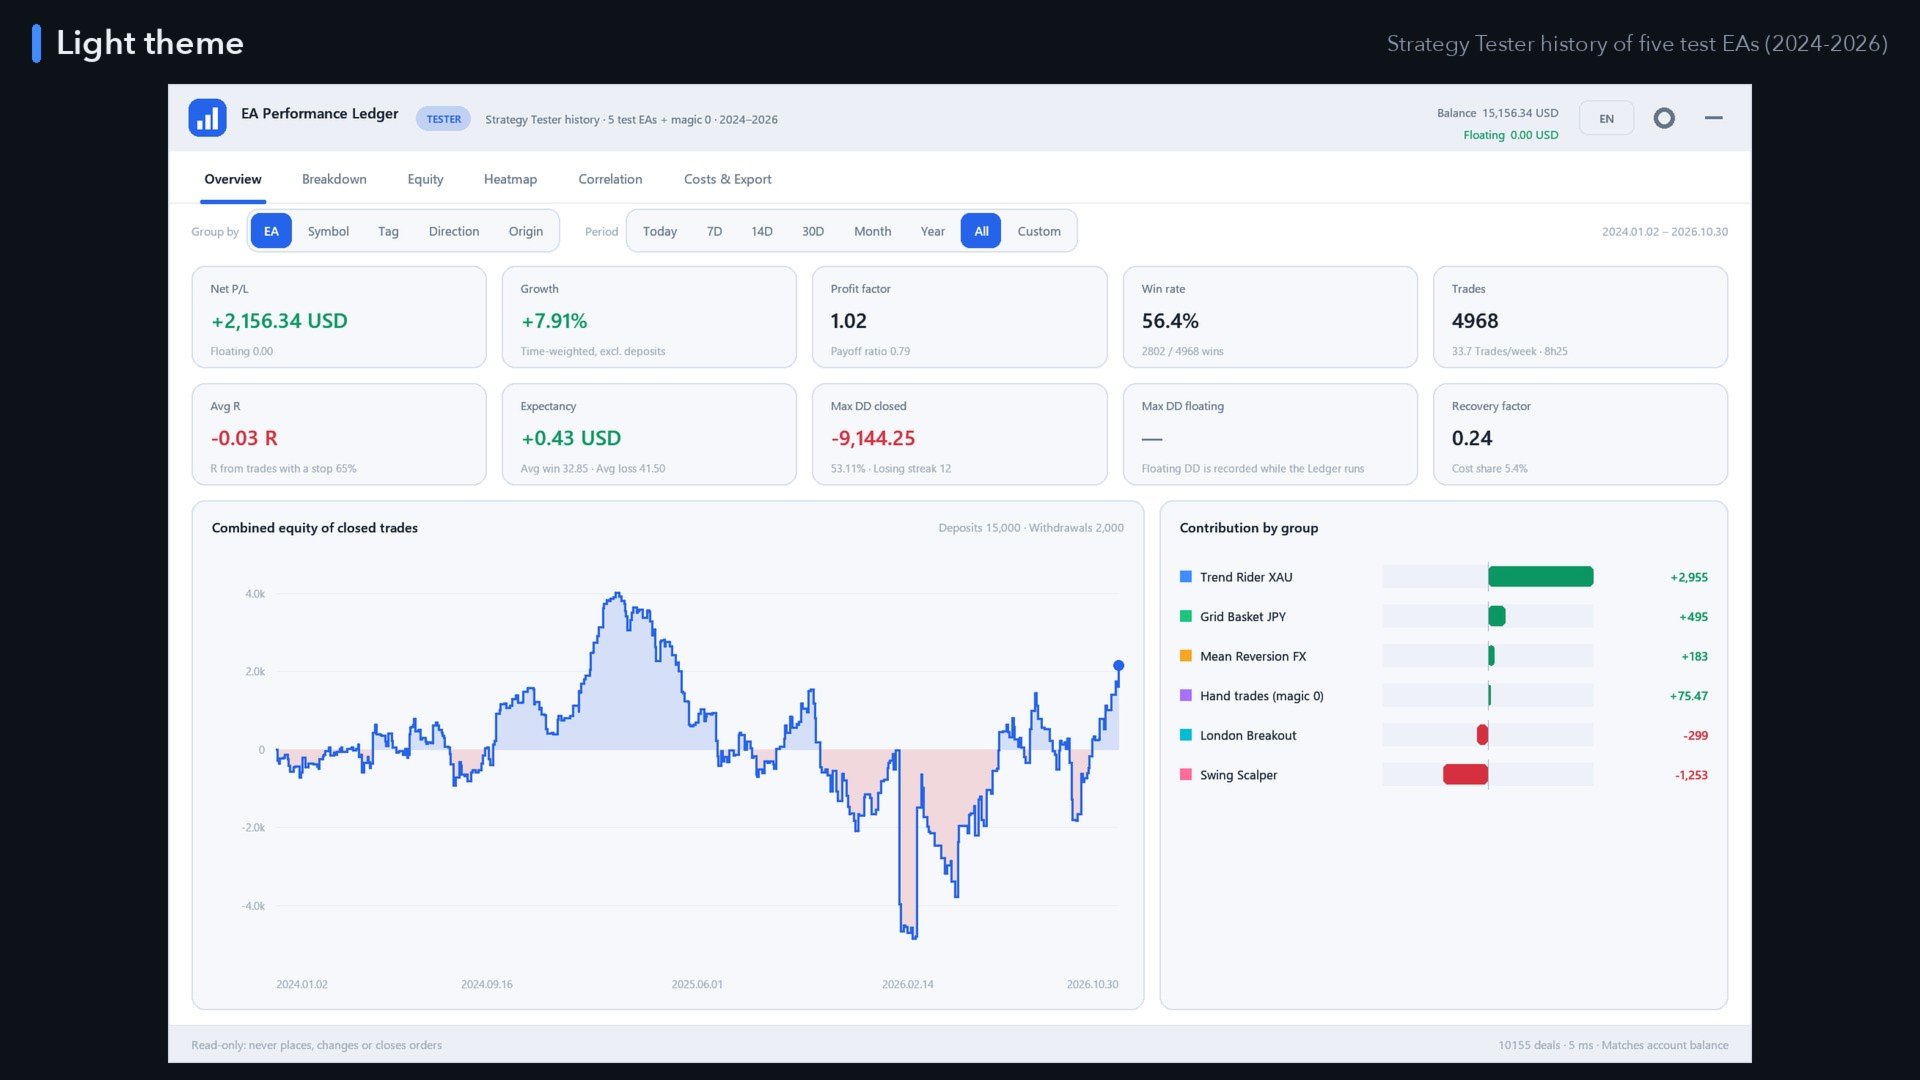
- Overview – ten key figures, the combined equity curve of closed trades with deposits and withdrawals noted, and a contribution chart: who adds, who takes away.
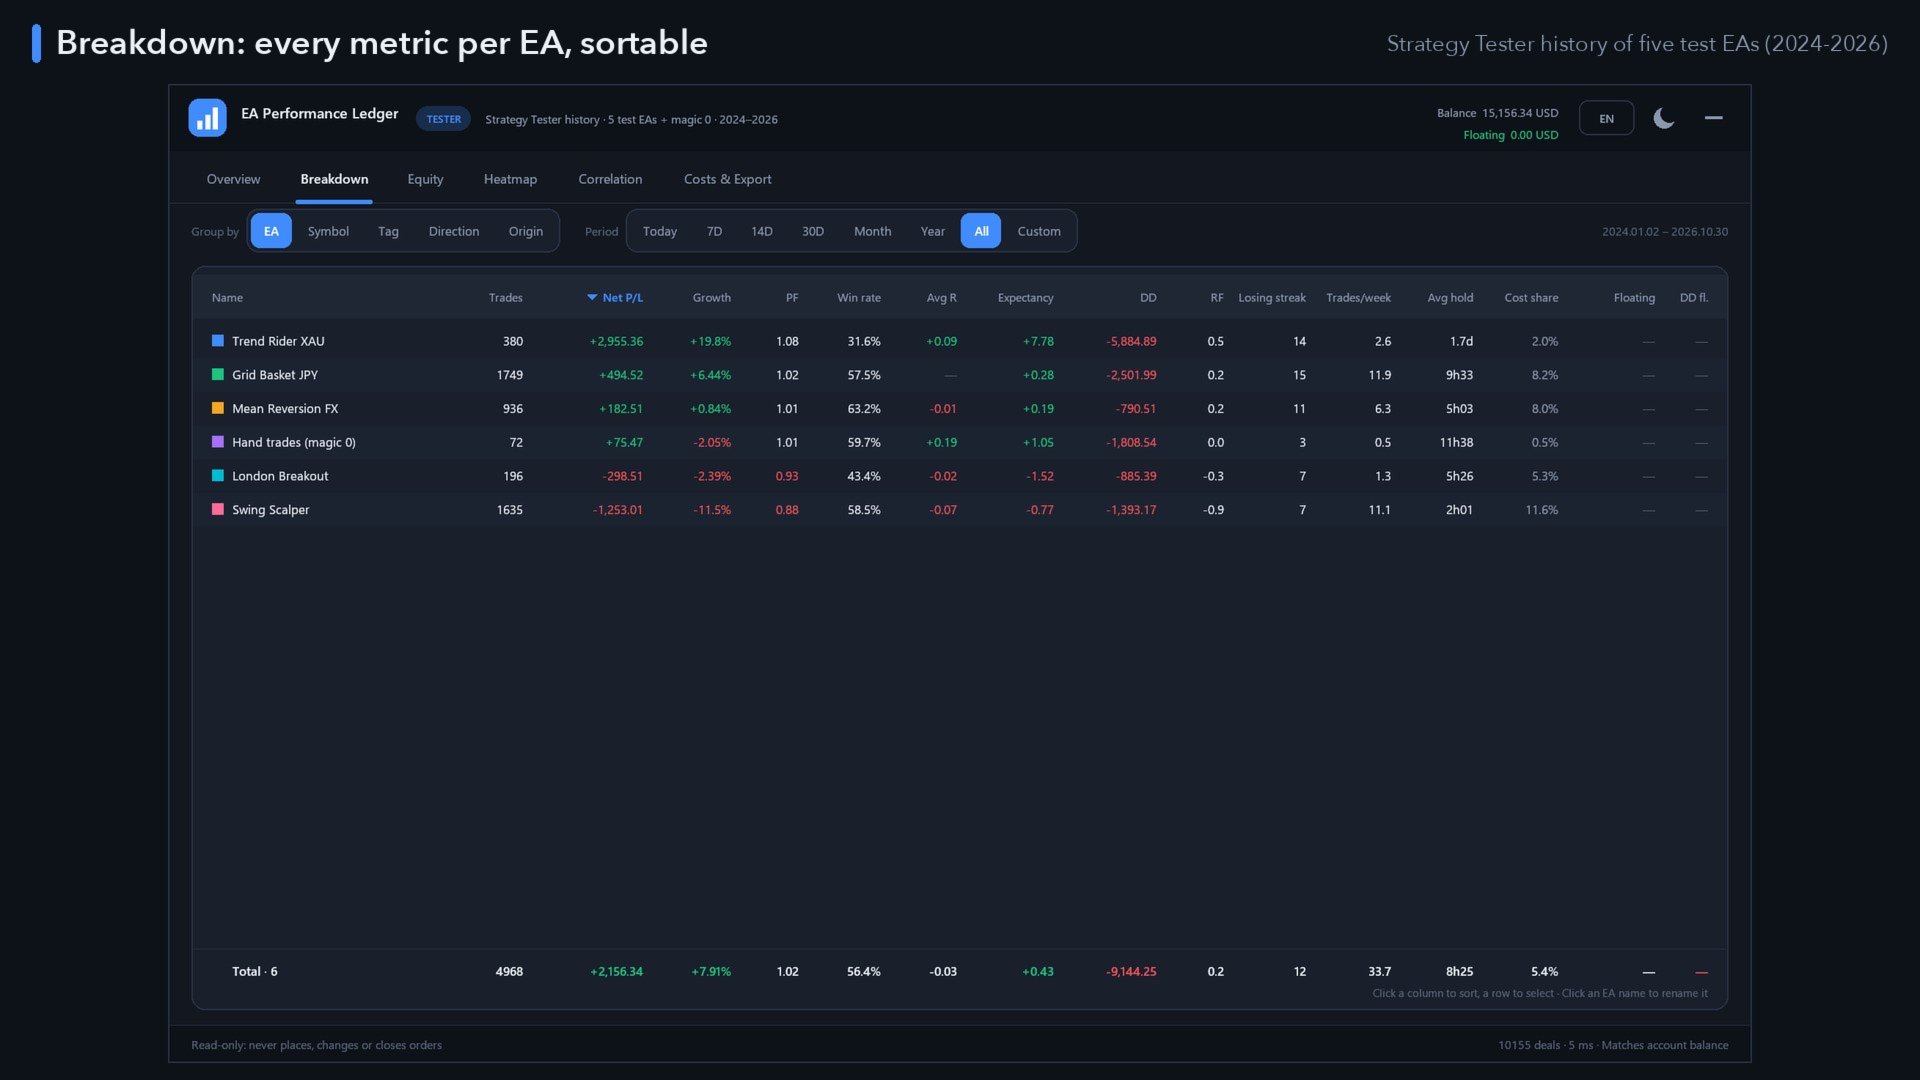
- Breakdown – a sortable table with every metric per group and a total row; click a row to select it, click a name to rename the EA.
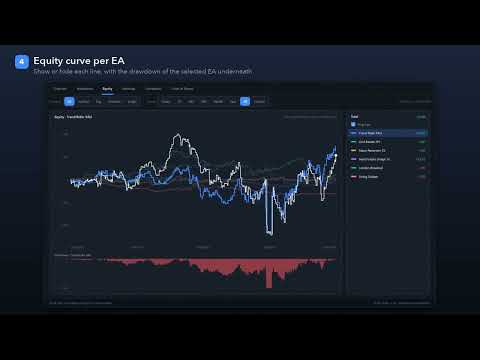
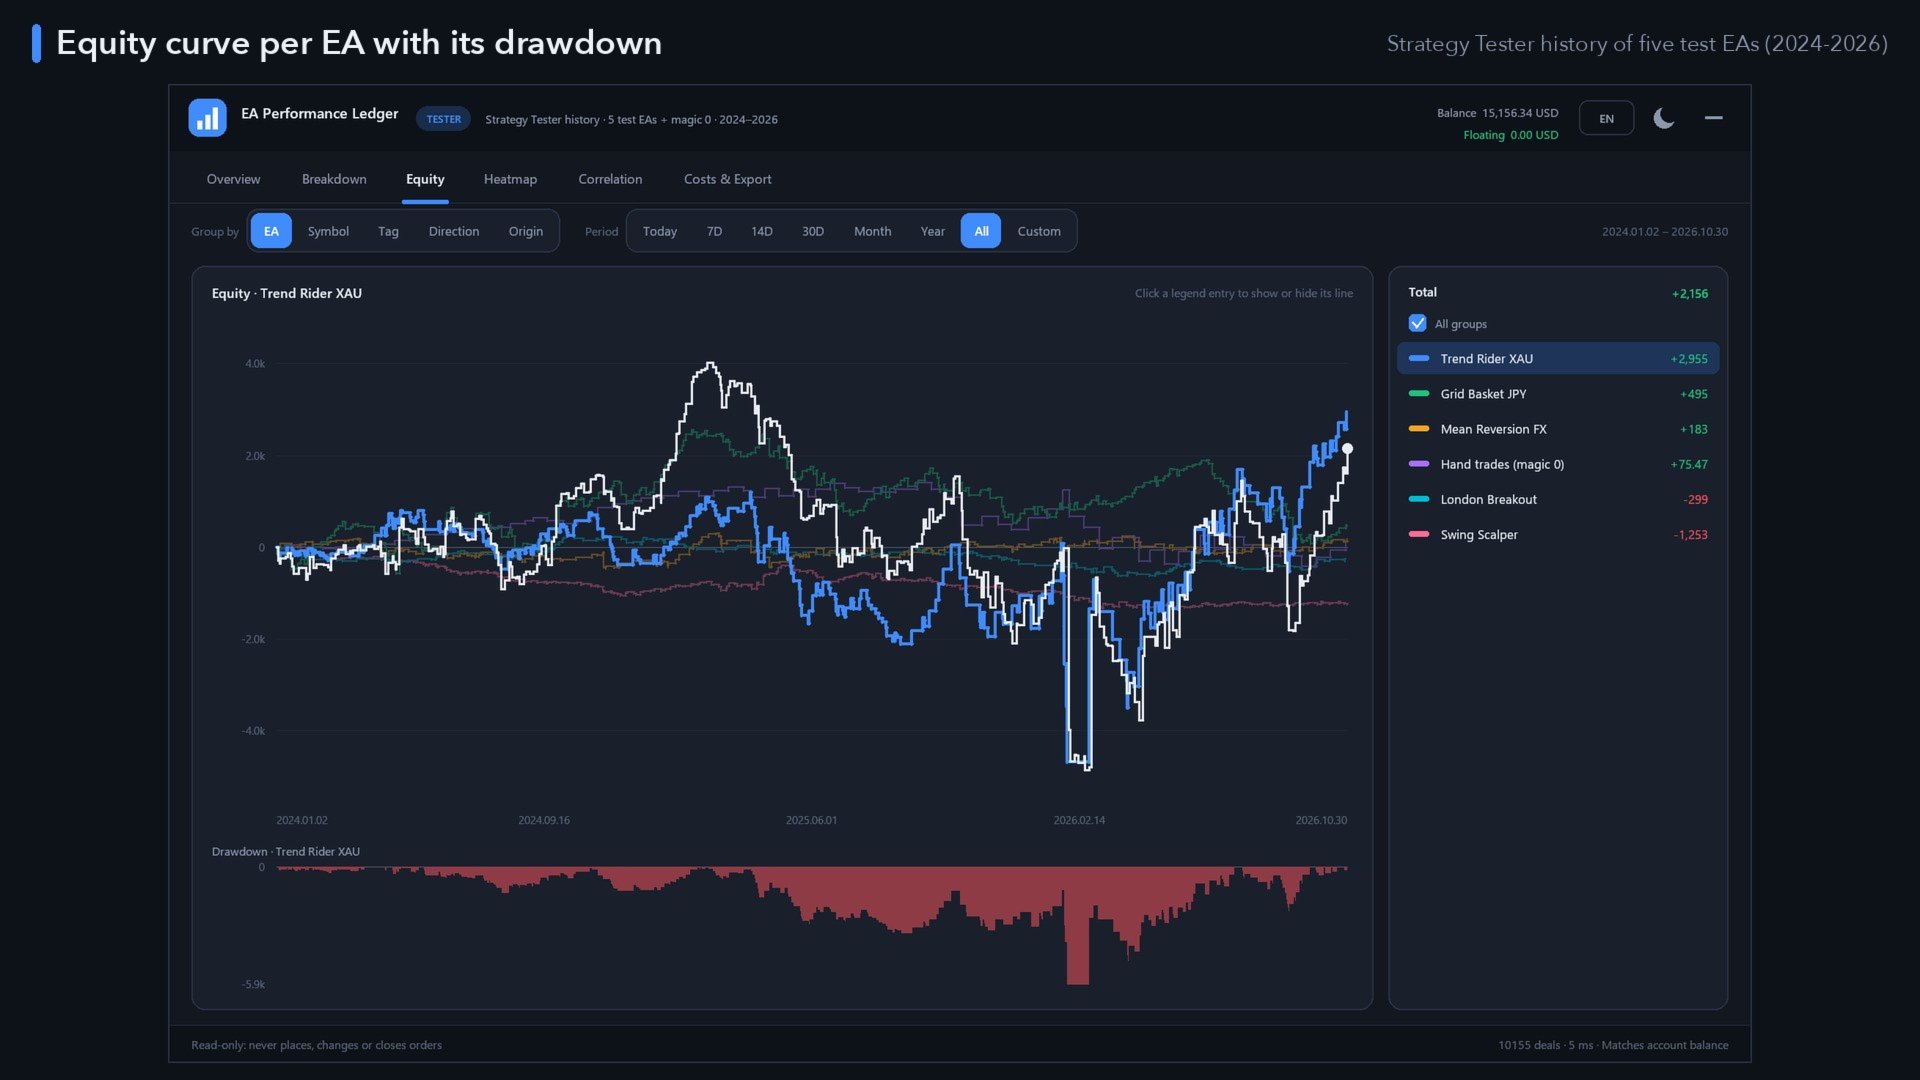
- Equity – an equity curve per group plus the combined curve, a legend to show or hide lines, and the drawdown ("underwater") chart of the selected group.
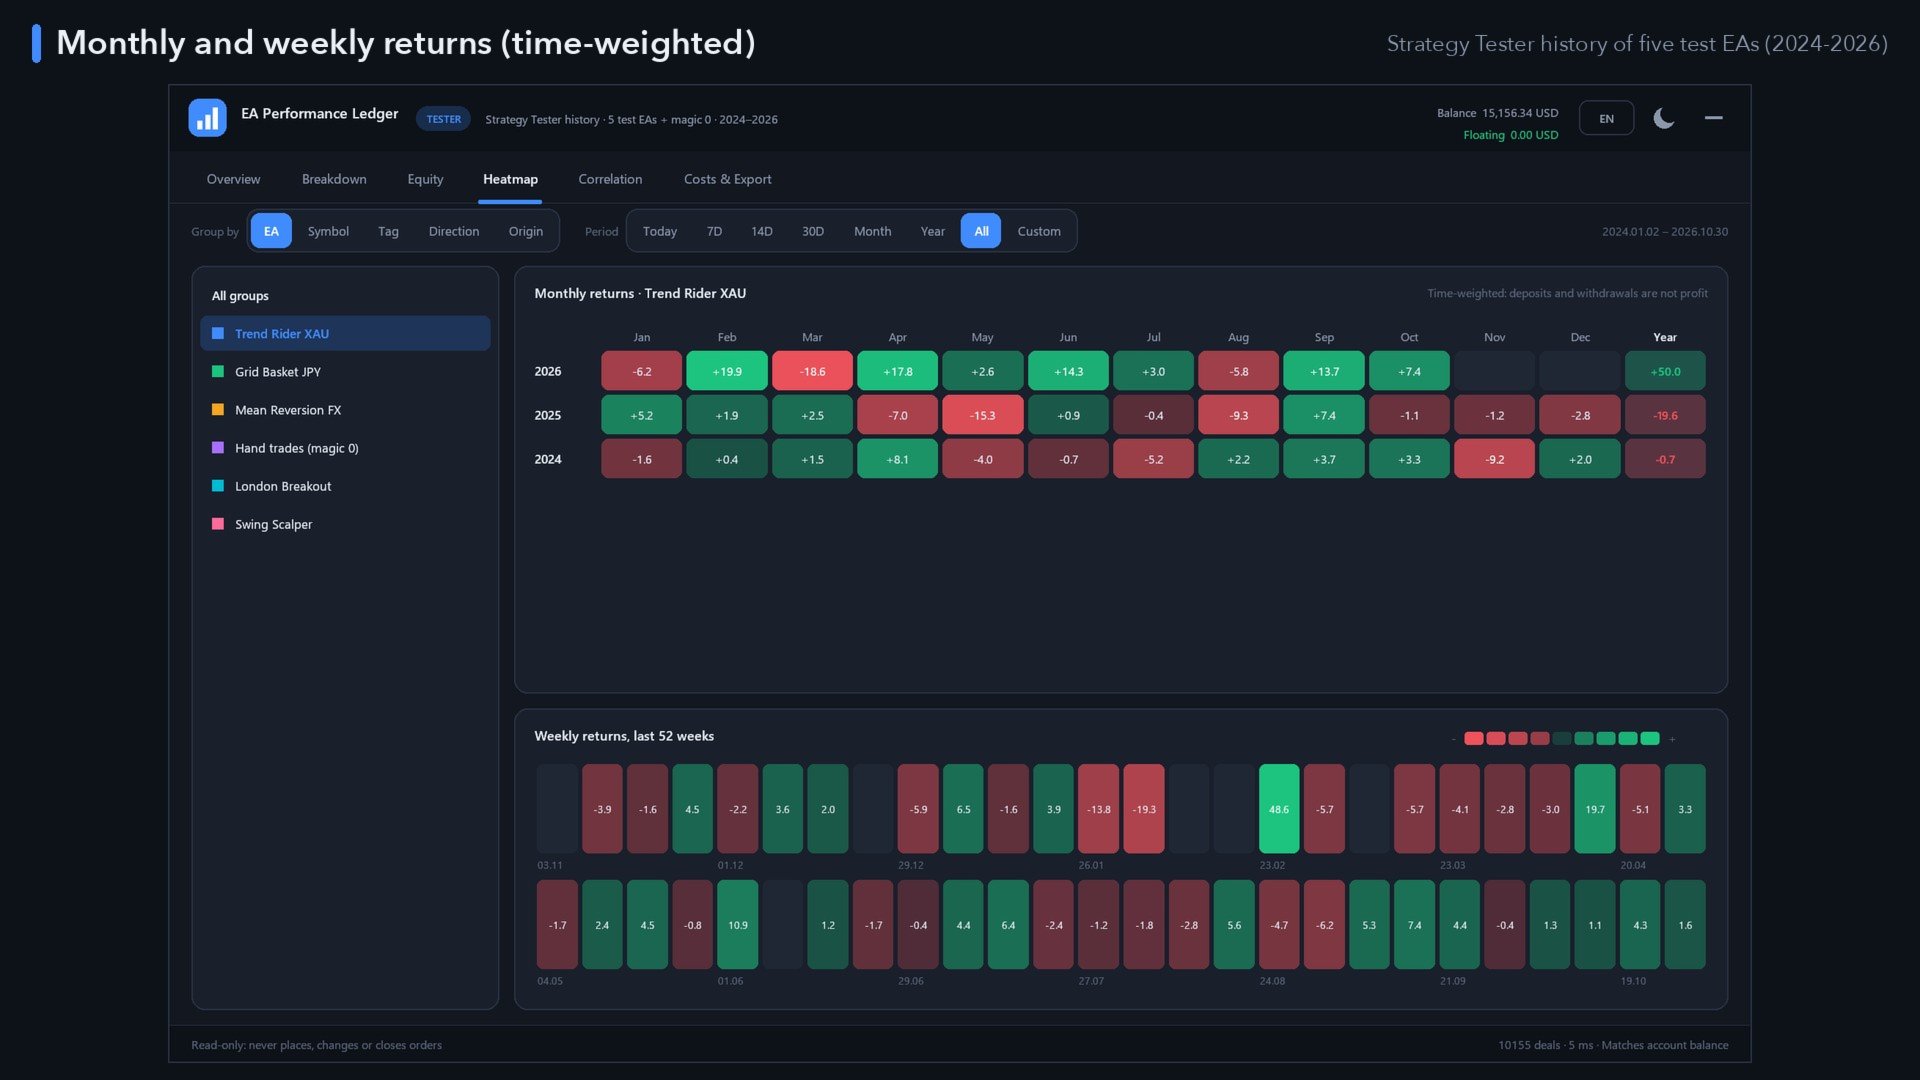
- Heatmap – monthly returns (year × month with year totals) and the last 52 weeks, for all groups or one selected EA.
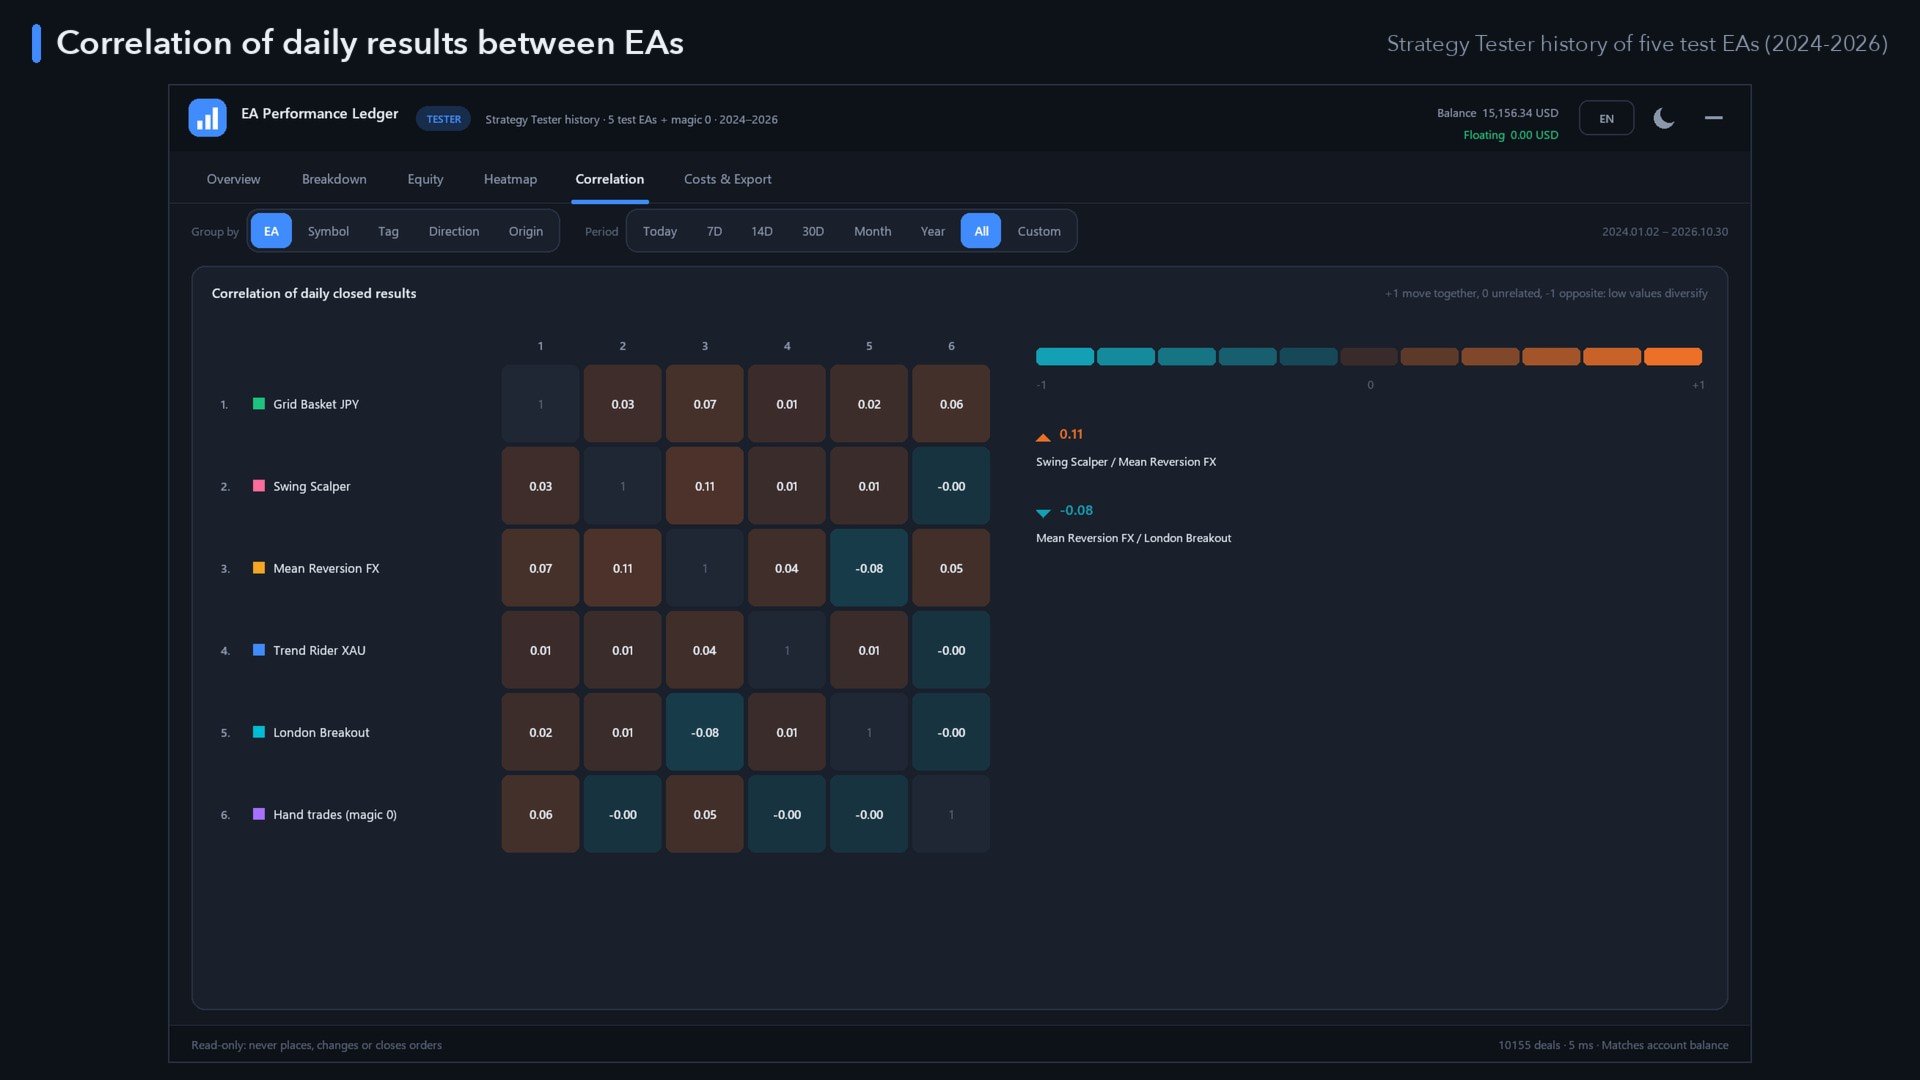
- Correlation – correlation of the daily closed results of up to 12 EAs, with the most and the least correlated pair: see whether your EAs really diversify.
- Costs & Export – gross profit, commission, swap and fees per group, CSV export (groups and every trade with its R) and a self-contained HTML report you can open in any browser or share.
Periods
One click: Today, 7 days, 14 days, 30 days, this month, this year, all history, or a custom date range.
Built for real accounts
- Partial closes, several entries per position and netting reversals are merged into correct trades.
- The rebuilt result is reconciled with your account balance; any difference is shown in the footer.
- Fast: tens of thousands of deals load in a fraction of a second, and the panel updates as soon as a deal closes.
Dashboard
- Dark and light themes (automatic from your chart colours), sharp on any screen: automatic DPI scaling or 100–200 % (up to 300 % via input).
- Movable (drag the header) and minimisable to one line with the period's net result.
- 11 languages: English, Deutsch, Español, Français, Italiano, Português, Русский, Türkçe, 中文, 日本語, 한국어 – switch in the panel at any time.
- Your choices (tab, grouping, period, theme, language, names, position) are remembered per account.
Free demo
The Market runs demos in the Strategy Tester, where an account has no trading history. So that you can still try every tab, the demo shows a clearly labelled sample portfolio (five EAs and manual trades over two years). On your own account the Ledger shows only your real history.
How to use
- Attach EA Performance Ledger to any chart (one chart is enough; it does not need trading permission).
- Pick a grouping and a period at the top of the panel.
- Click EA names to rename them; use the Costs & Export tab to save CSV or HTML (files go to MQL5\Files\EA_Performance_Ledger).
Inputs
- Group results by, Period, Split an EA by comment, Include manual trades, EA names.
- Language, Theme, Scale %, Panel X / Y position, Refresh of open positions (seconds).
The Ledger reports past results of your account; past results do not guarantee future results.