Volume Profile OrderFlow Suite
- Indicatori
- Versione: 1.0
- Attivazioni: 10

Volume Profile OrderFlow Suite puts volume profiles, VWAP and tick order flow on one MetaTrader 5 chart, with one panel. It also measures how price actually reacted at the profile levels on your symbol, so you can see from your broker's own data whether a level has been worth watching.
The panel always shows which data is used. Forex and CFD symbols in MT5 only have tick volume (the number of price changes), so on those symbols the buy/sell side is an estimate. Symbols with exchange trades use real volume, and the side then comes from the trade data.
Volume profiles
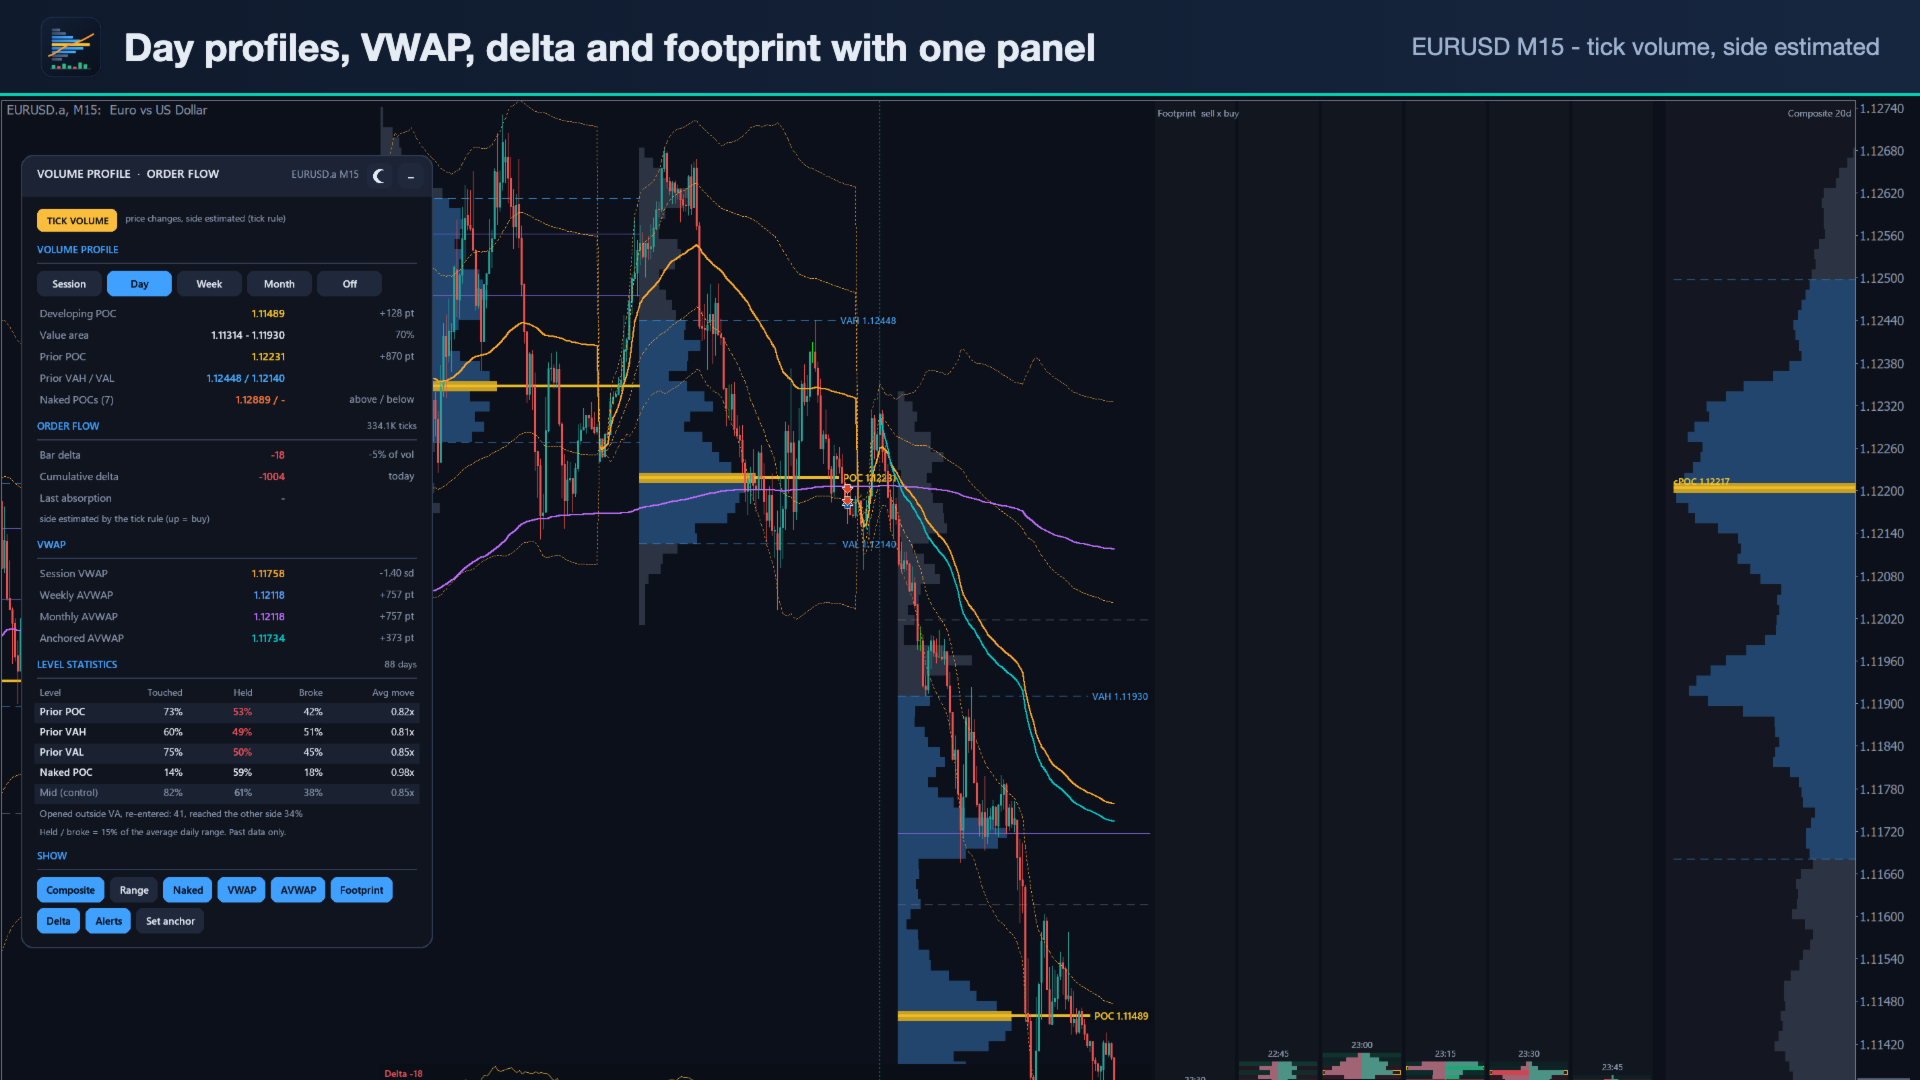
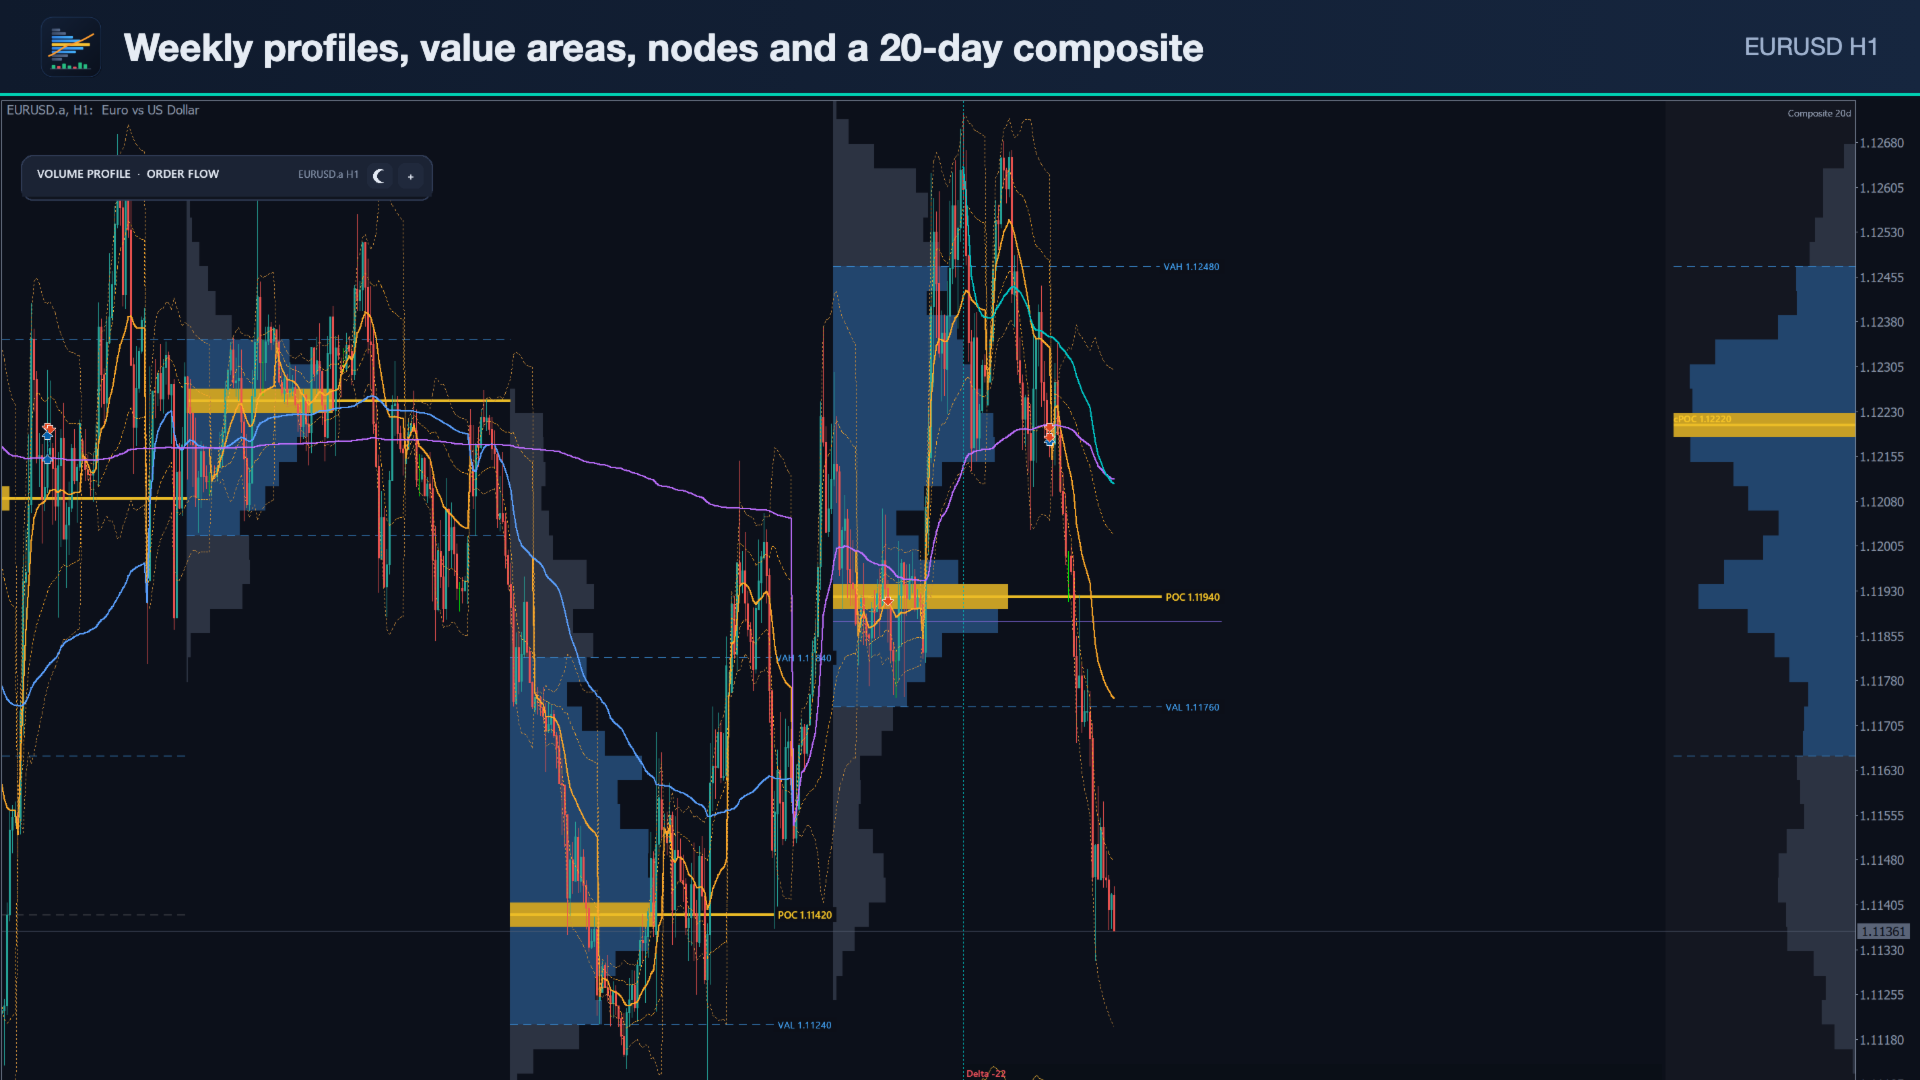
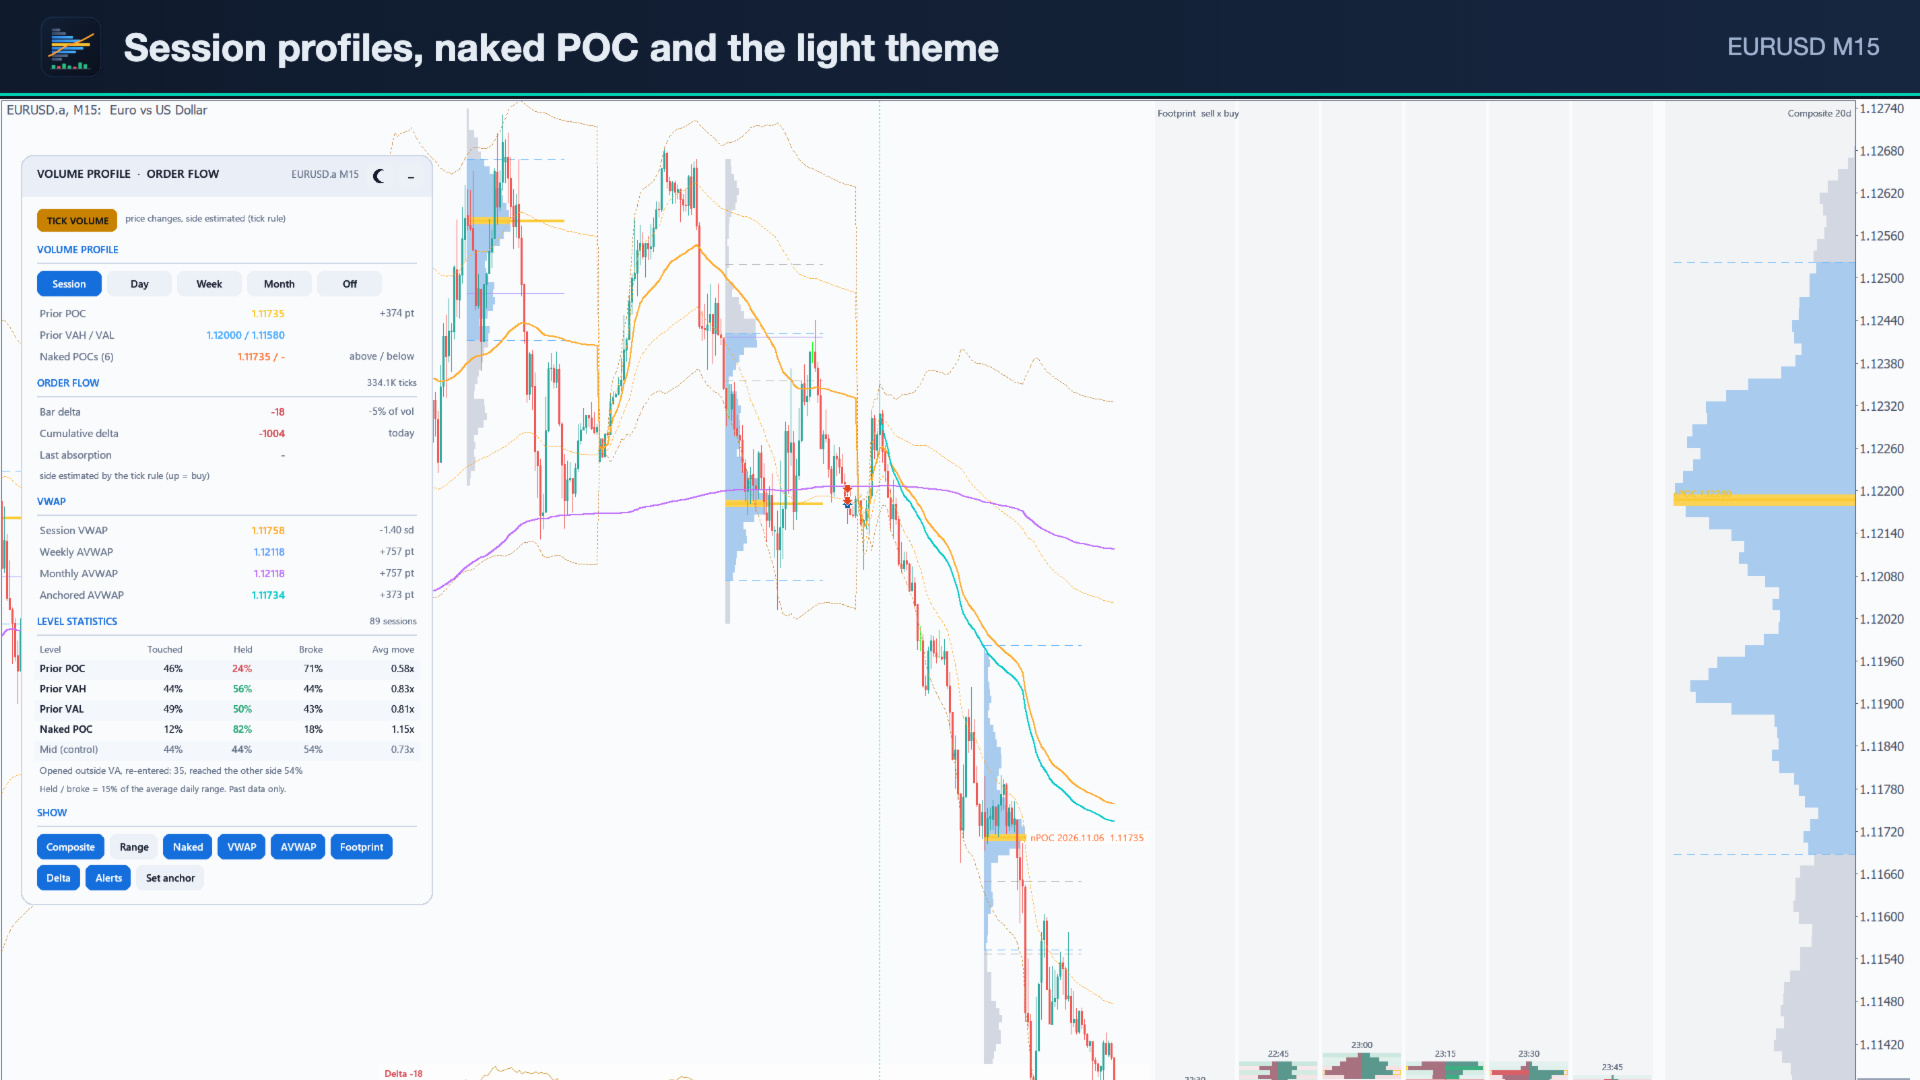
- Periodic profiles: Session (your own start and end time), Day, Week or Month. Auto mode picks one that suits the chart timeframe. You can switch with one click on the panel.
- POC, value area high and value area low. The value area % can be set (default 70 %), and it is built with the standard two-rows-at-a-time rule.
- High- and low-volume nodes are marked on every profile.
- Naked POCs: a POC that price has not traded at again is extended to the right until price comes back to it. The panel shows the nearest naked POC above and below price.
- Composite profile of the last N days at the right edge of the chart.
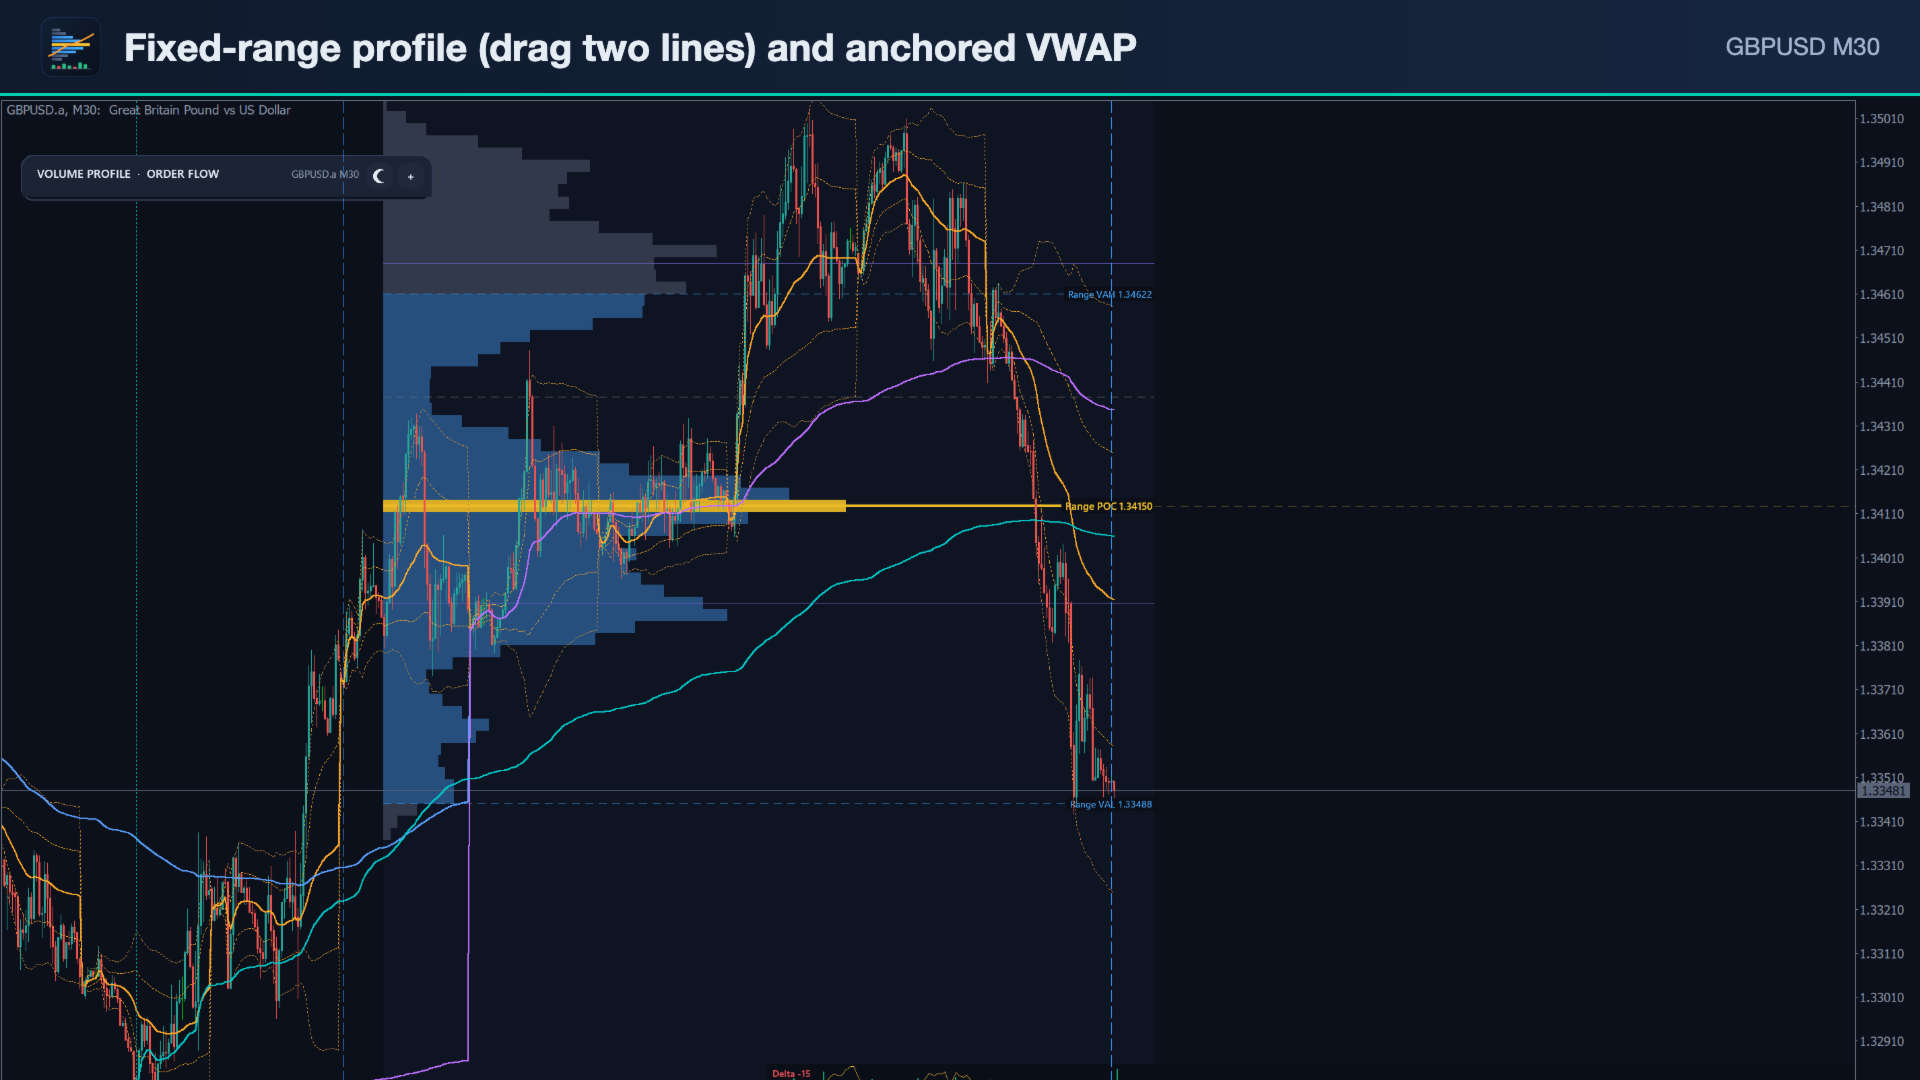
- Fixed-range profile: drag two vertical lines to any part of the chart and the profile is rebuilt at once.
- Row height is set automatically from the average period range, so forex, gold, indices and crypto all work without tuning. You can also set it in points.
VWAP
- Session VWAP with up to three standard-deviation bands. It resets each trading day, with an adjustable day start.
- Three anchored VWAPs. Each one can restart every day, week or month, or start from an anchor line.
- Anchor by click: press "Set anchor" on the panel and click a bar, or drag the anchor line. Bands at 1 and 2 standard deviations are optional.
- Anchors are stored by time, so the lines stay in the same place on every timeframe.
Order flow from ticks
- Every tick is classified as buyer- or seller-initiated. The indicator uses trade flags when the broker sends them, then last price against bid/ask, then the tick rule.
- Per-bar delta and cumulative delta are drawn in a strip at the bottom of the chart. The cumulative delta resets each day or runs continuously.
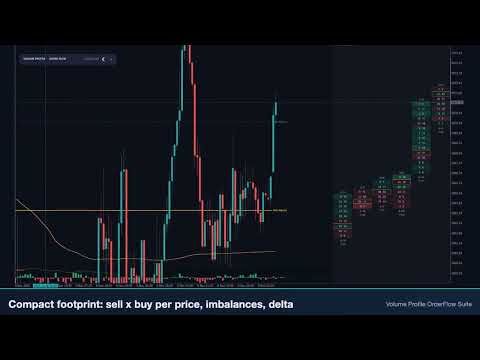
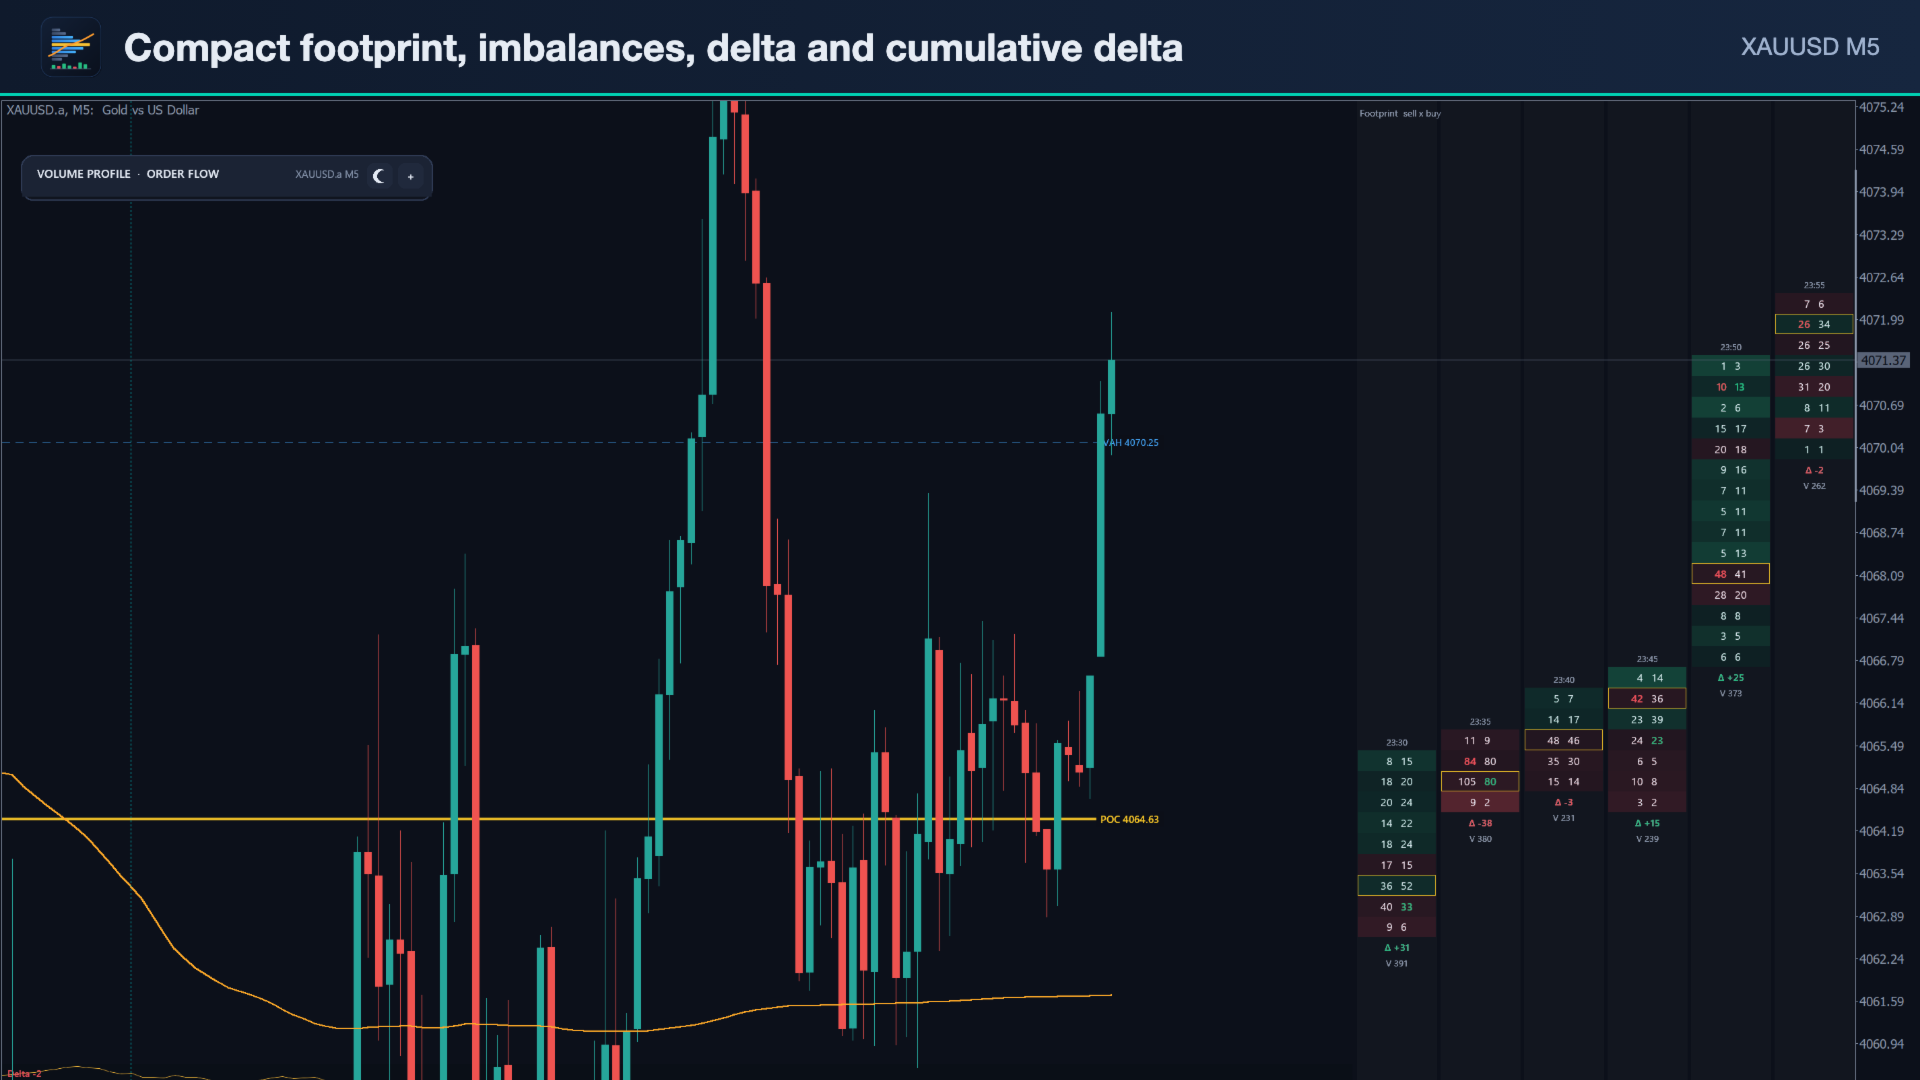
- Compact footprint of the latest bars, shown beside the chart and aligned to the price scale. Each price row shows sell x buy volume, and the busiest row of each bar is outlined.
- Diagonal imbalances (ratio can be set, default 300 %) and stacked imbalances are highlighted.
- Absorption marks show bars with heavy volume and strong delta that did not move price.
- Tick history is loaded in the background (1-20 days) and then updated tick by tick.
Level statistics
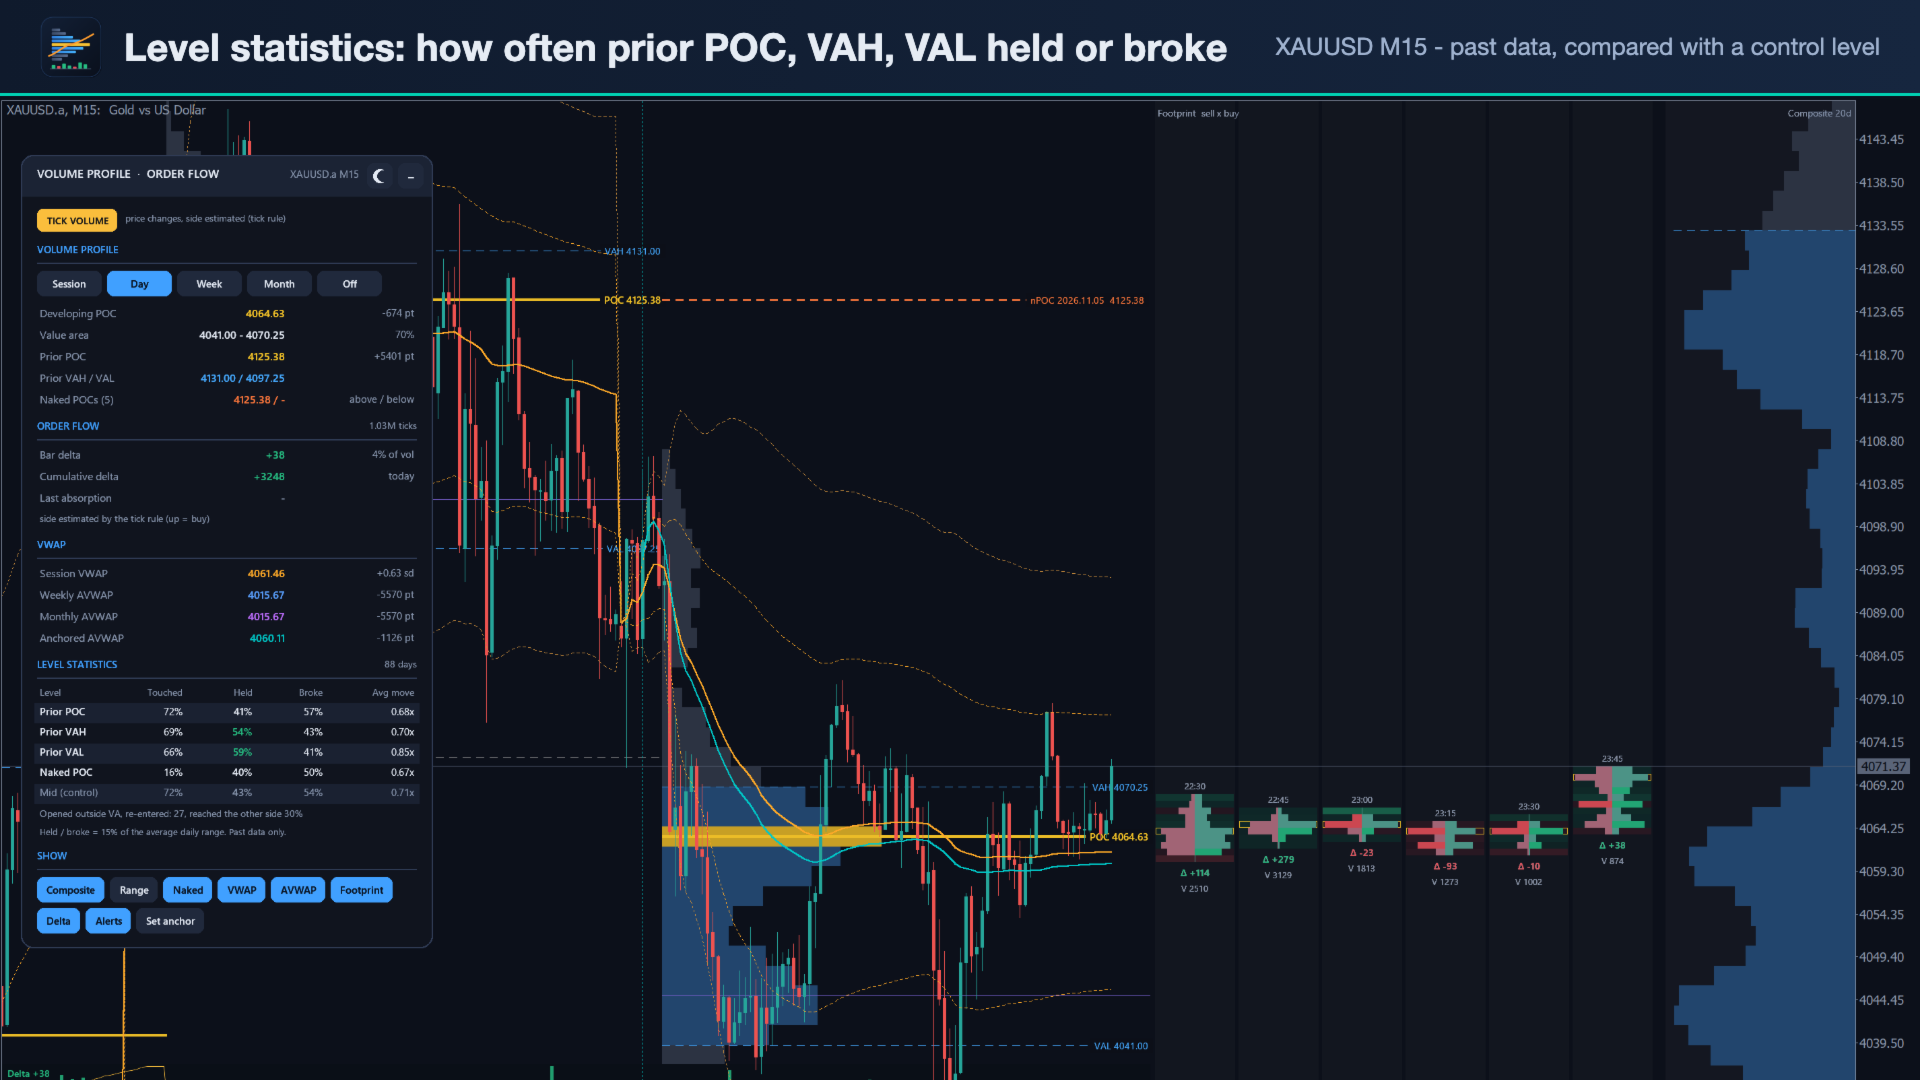
- For each past period the indicator tests the levels of the period before it: prior POC, prior VAH, prior VAL, and the naked POCs that were still open.
- It counts how often a level was touched, held (price moved away by the reaction distance first) or broke (price closed the same distance beyond it first). It also shows the average move away from the level.
- A neutral control level (the middle of the prior range) is tested the same way, so you can compare the profile levels with a level that has no special meaning.
- Value-area re-entry: when a period opens outside the prior value area and comes back inside, the panel shows how often price then reached the other side.
- All counts come from closed periods of your chart's symbol. They describe the past and are not a forecast.
Alerts
- Price touches the prior POC or a naked POC.
- A bar closes outside the prior value area, or closes back inside it.
- Delta divergence (a new high or low that cumulative delta does not confirm) and absorption. These two are optional.
- Alerts can go to a popup, a push notification or a sound. Each signal is sent only once.
Panel and performance
- A dedicated panel that you can move and minimise. It has dark and light themes and scales with screen DPI.
- One-click switches: profile type, composite, fixed range, naked POCs, VWAP, anchored VWAP, footprint, delta strip and alerts. Your settings are kept per chart.
- All chart graphics are drawn on one background canvas instead of thousands of objects. The indicator stays fast with long history.
- Closed periods and closed bars never change (no repainting). Only the developing period and the current bar update.
- Buffers for Expert Advisors: session VWAP and bands, anchored VWAPs, bar delta, cumulative delta, and prior period POC / VAH / VAL.
- Works on any symbol and broker suffix, from M1 to D1. Order flow is switched off on W1 and MN1.
Notes
- MT5 does not provide volume per price level for forex/CFD symbols. Profiles spread each bar's volume over its range, and the order-flow side on tick-volume symbols is an estimate. The panel says which case applies.
- The indicator is an analysis tool. It does not open trades. Past statistics do not guarantee future results.