EA Robustness Lab
- Utilità
- Versione: 1.0
- Attivazioni: 10

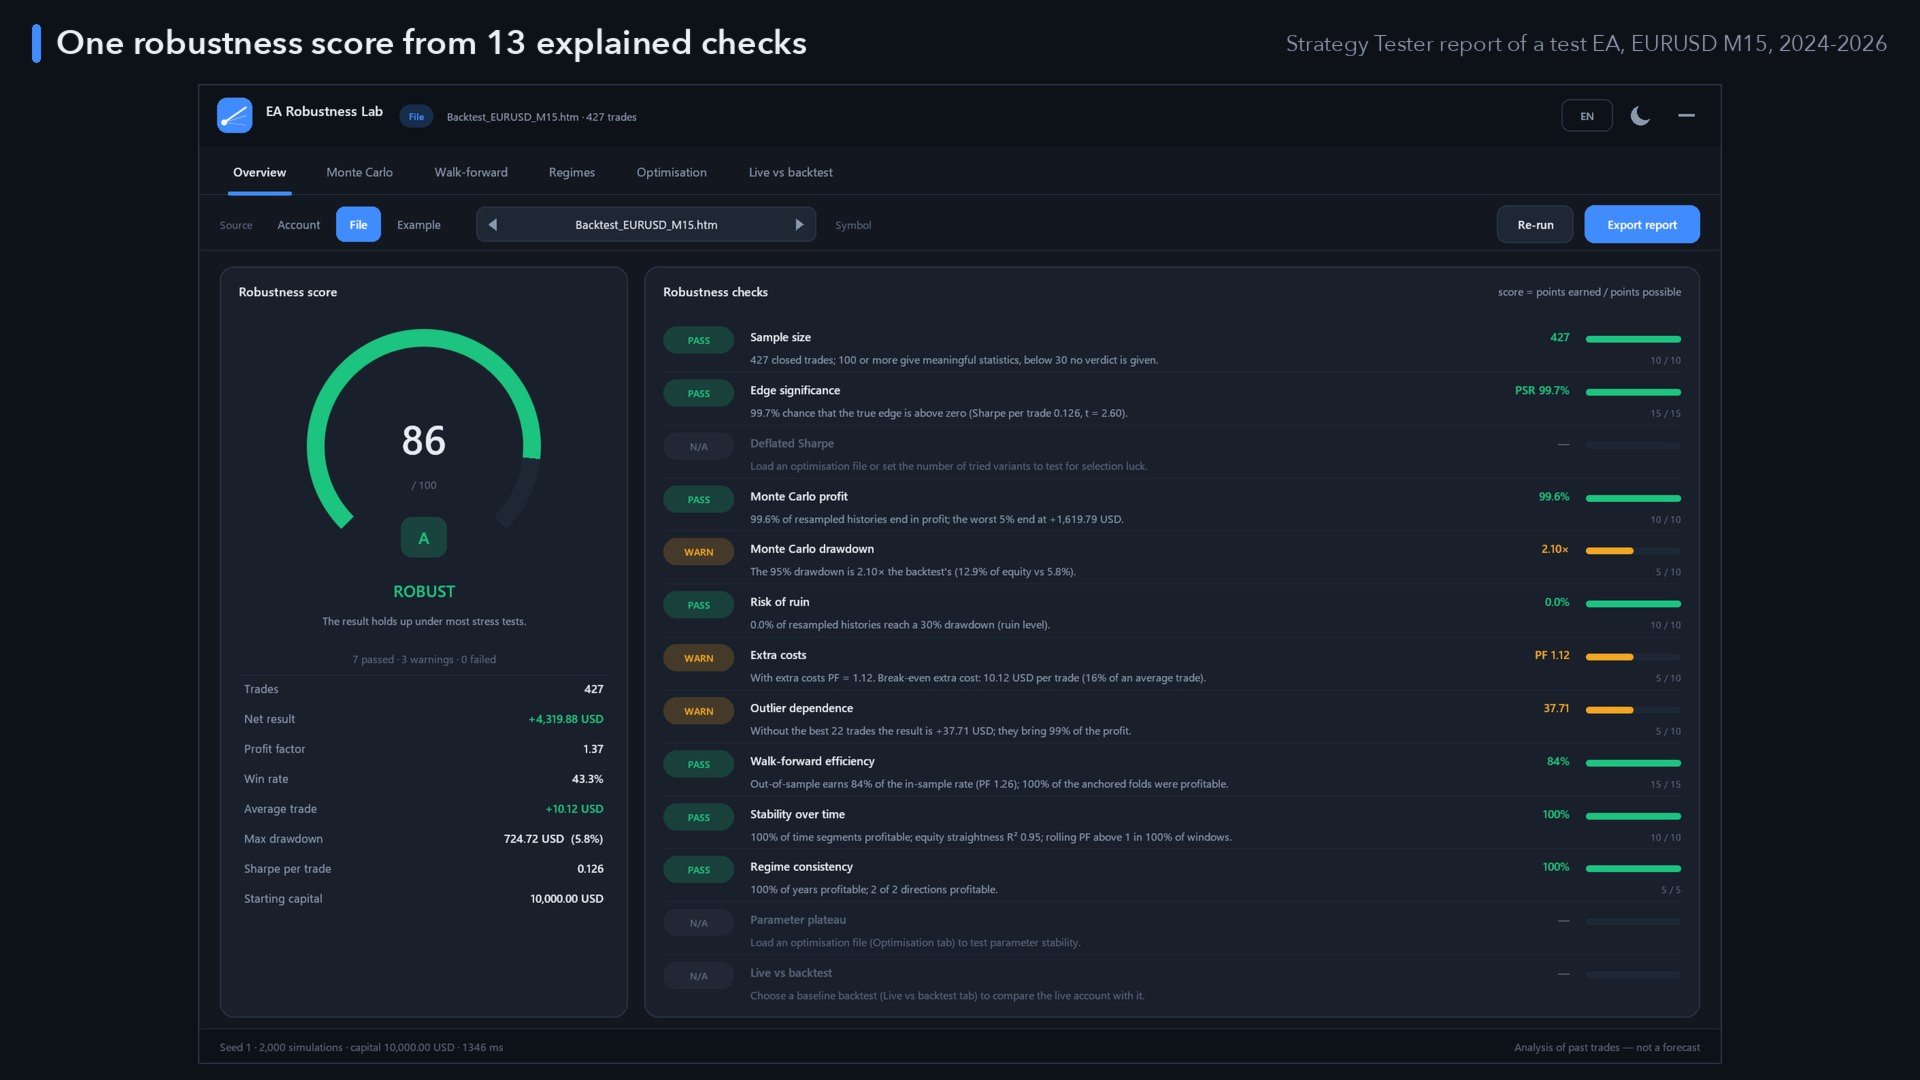
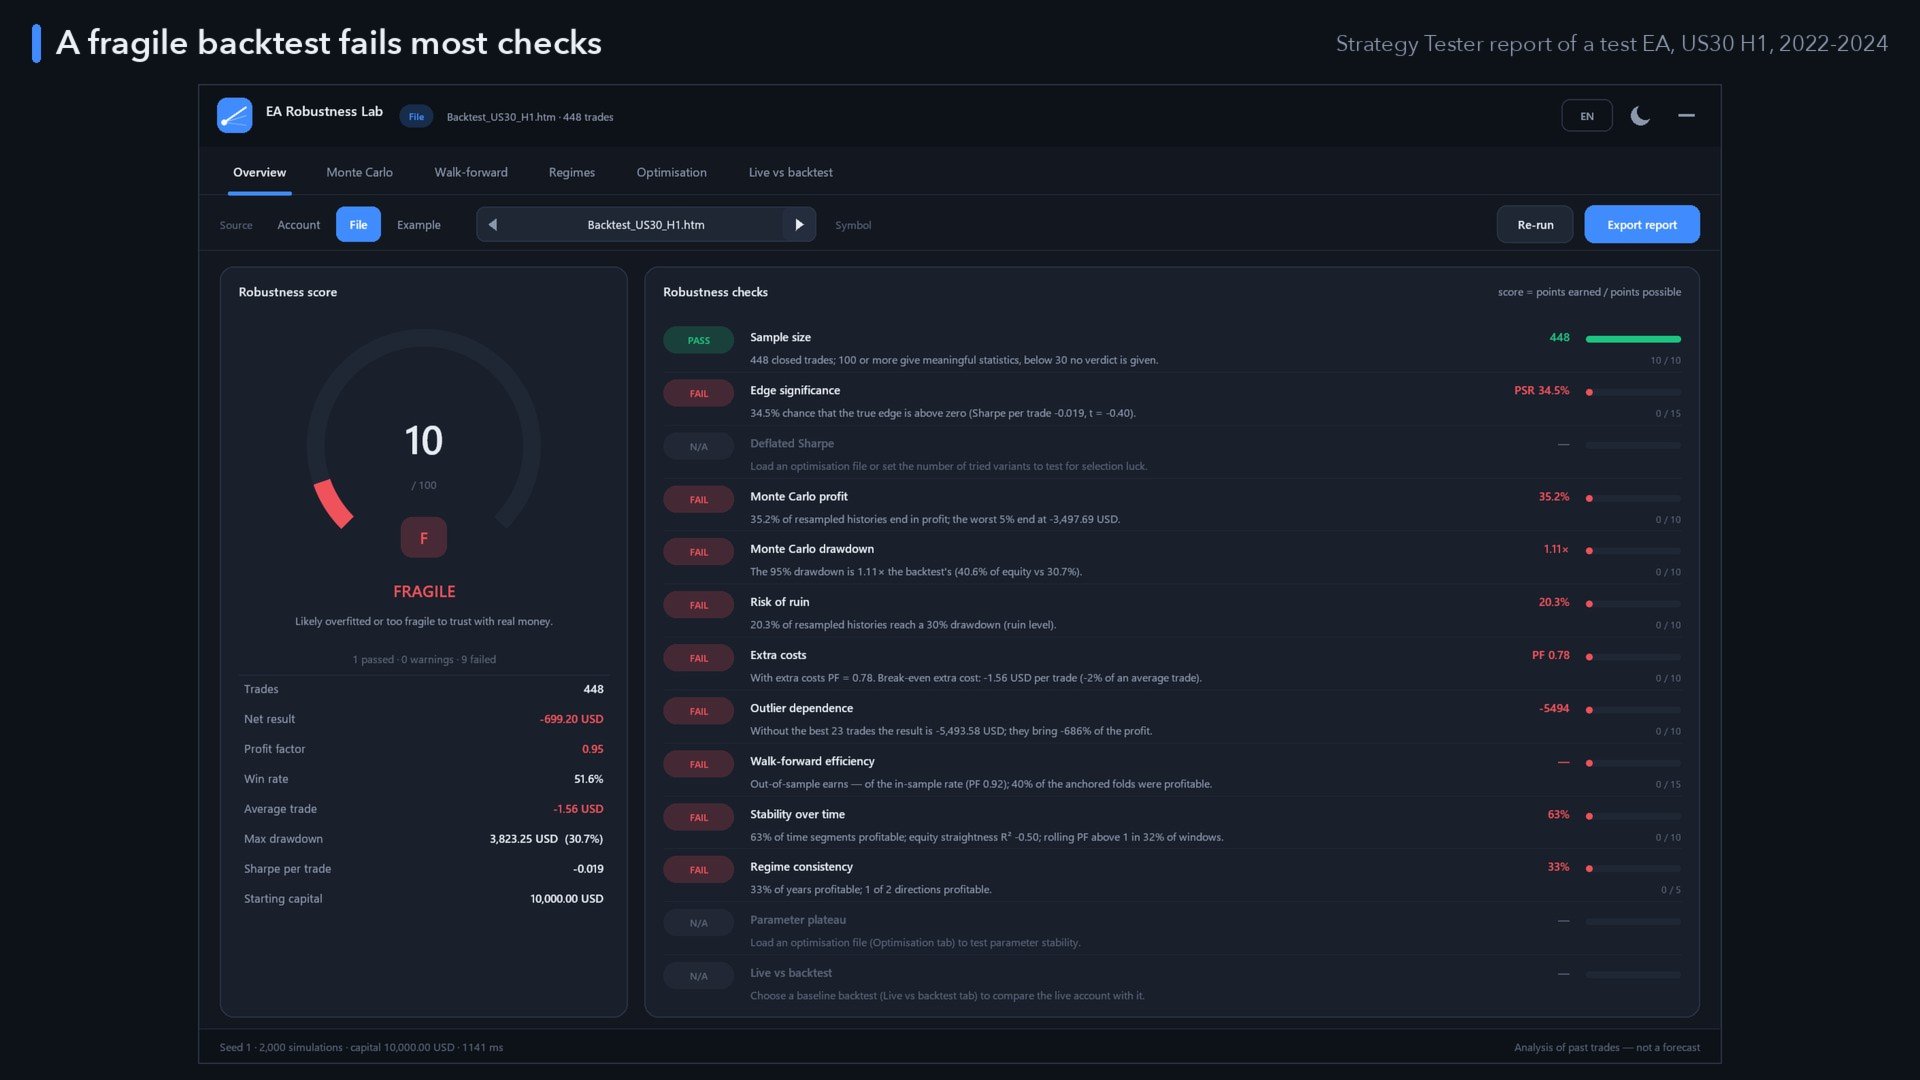
EA Robustness Lab tells you whether an Expert Advisor's results are robust or overfitted. A good backtest is not proof: it can come from a lucky order of trades, a few outsized wins, costs that were too optimistic, parameters fitted to the past, or a market regime that is gone. The Lab takes the closed trades of a strategy, puts them through Monte Carlo, walk-forward, stability, regime and optimisation tests, compares live trading with the backtest, and sums it all up in one robustness score from 0 to 100 with an A–F grade and a plain-language explanation of every check.
Read-only. It never places, modifies or closes an order. No DLL, no web requests. Works on any symbol, timeframe and account type.
Three trade sources
- Account history – every closed position (partial closes merged, commission, swap and fees included), filtered by magic numbers, symbol, comment and date range. The starting balance is detected from the history.
- Report files – a Strategy Tester report saved as HTML or XML, or an account history report. Trades are rebuilt from the deals (entry commissions matched to their exits) and checked against the report's balance column; the initial deposit becomes the starting capital.
- CSV trade lists – comma, semicolon or tab separated, any common number and date format, with or without a header.
Put files in MQL5\Files\EA_Robustness_Lab (or the common Files folder) and pick them with the arrows on the panel.
Monte Carlo – four methods
- Shuffle order – the same trades in random order: how lucky was the real sequence?
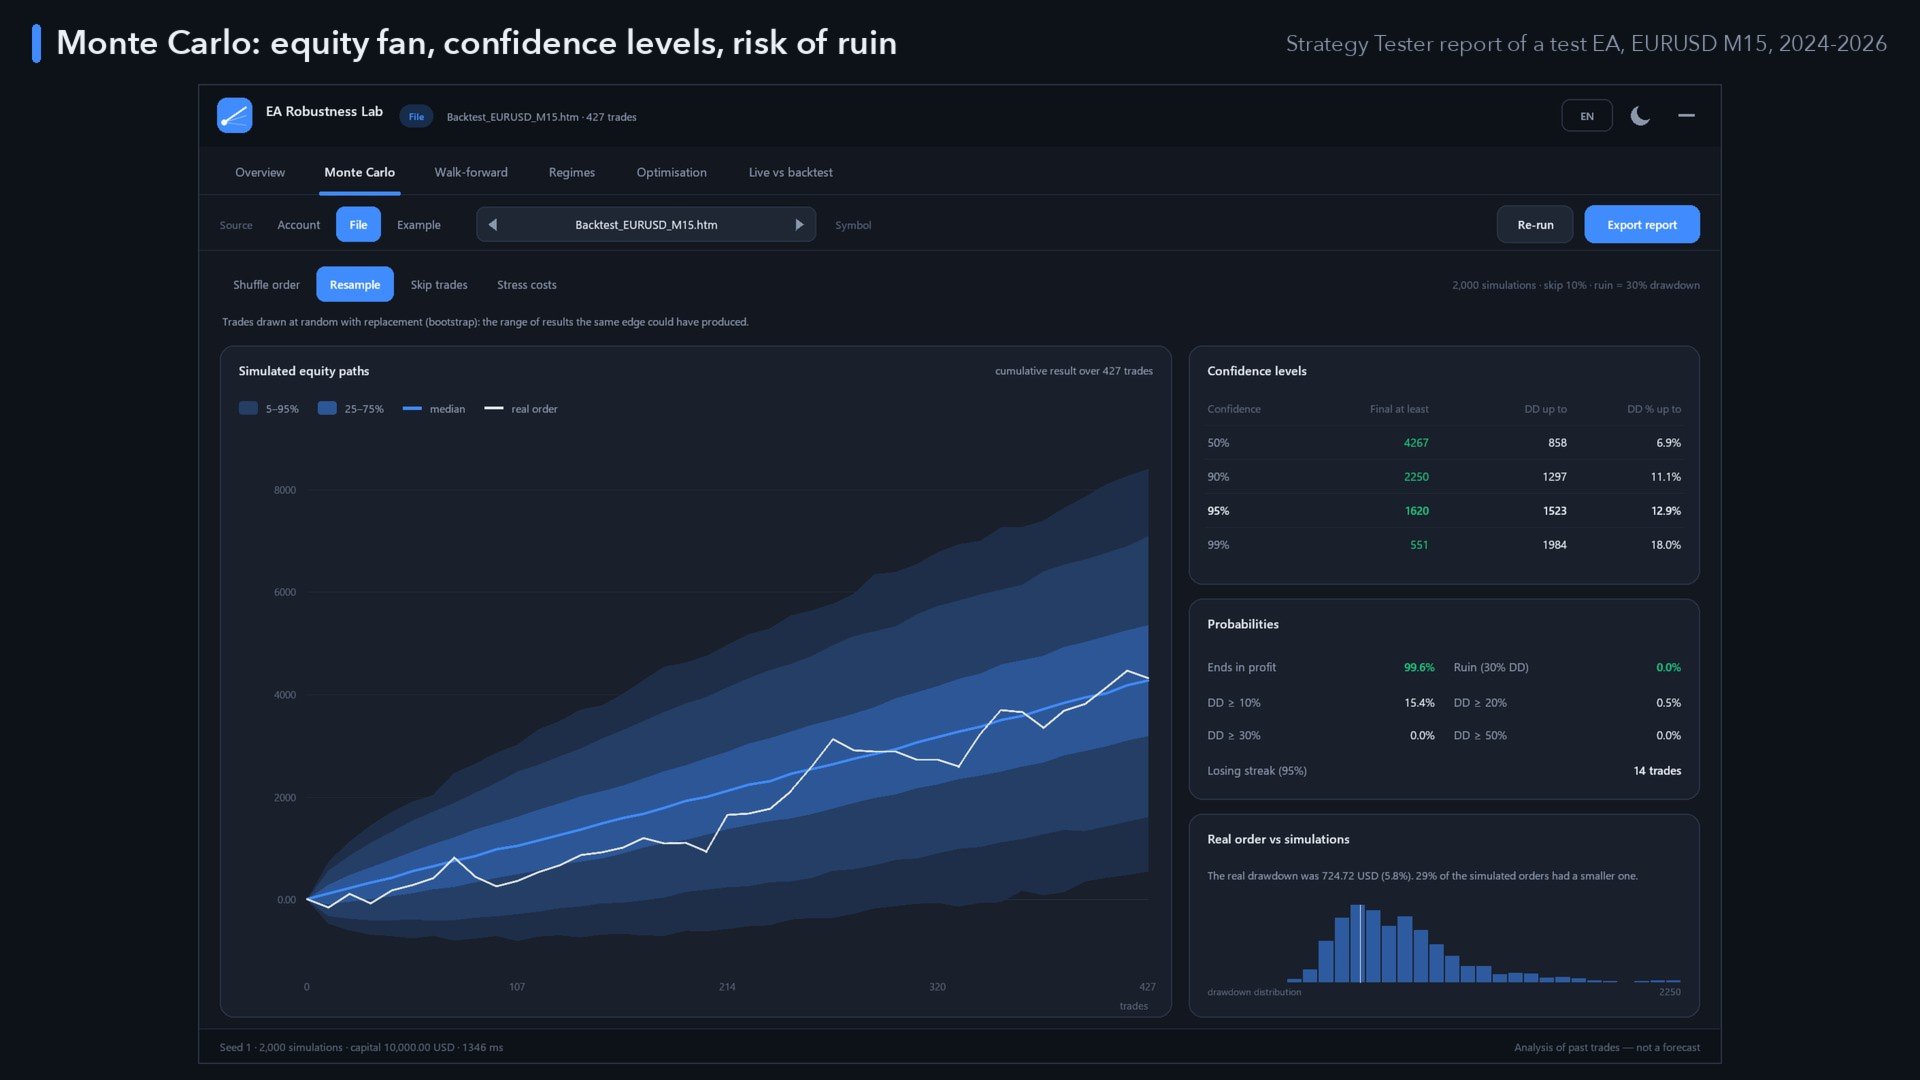
- Resample – trades drawn with replacement (bootstrap): the range of results the same edge could have produced.
- Skip trades – a share of trades missed at random, as with downtime, filters or requotes.
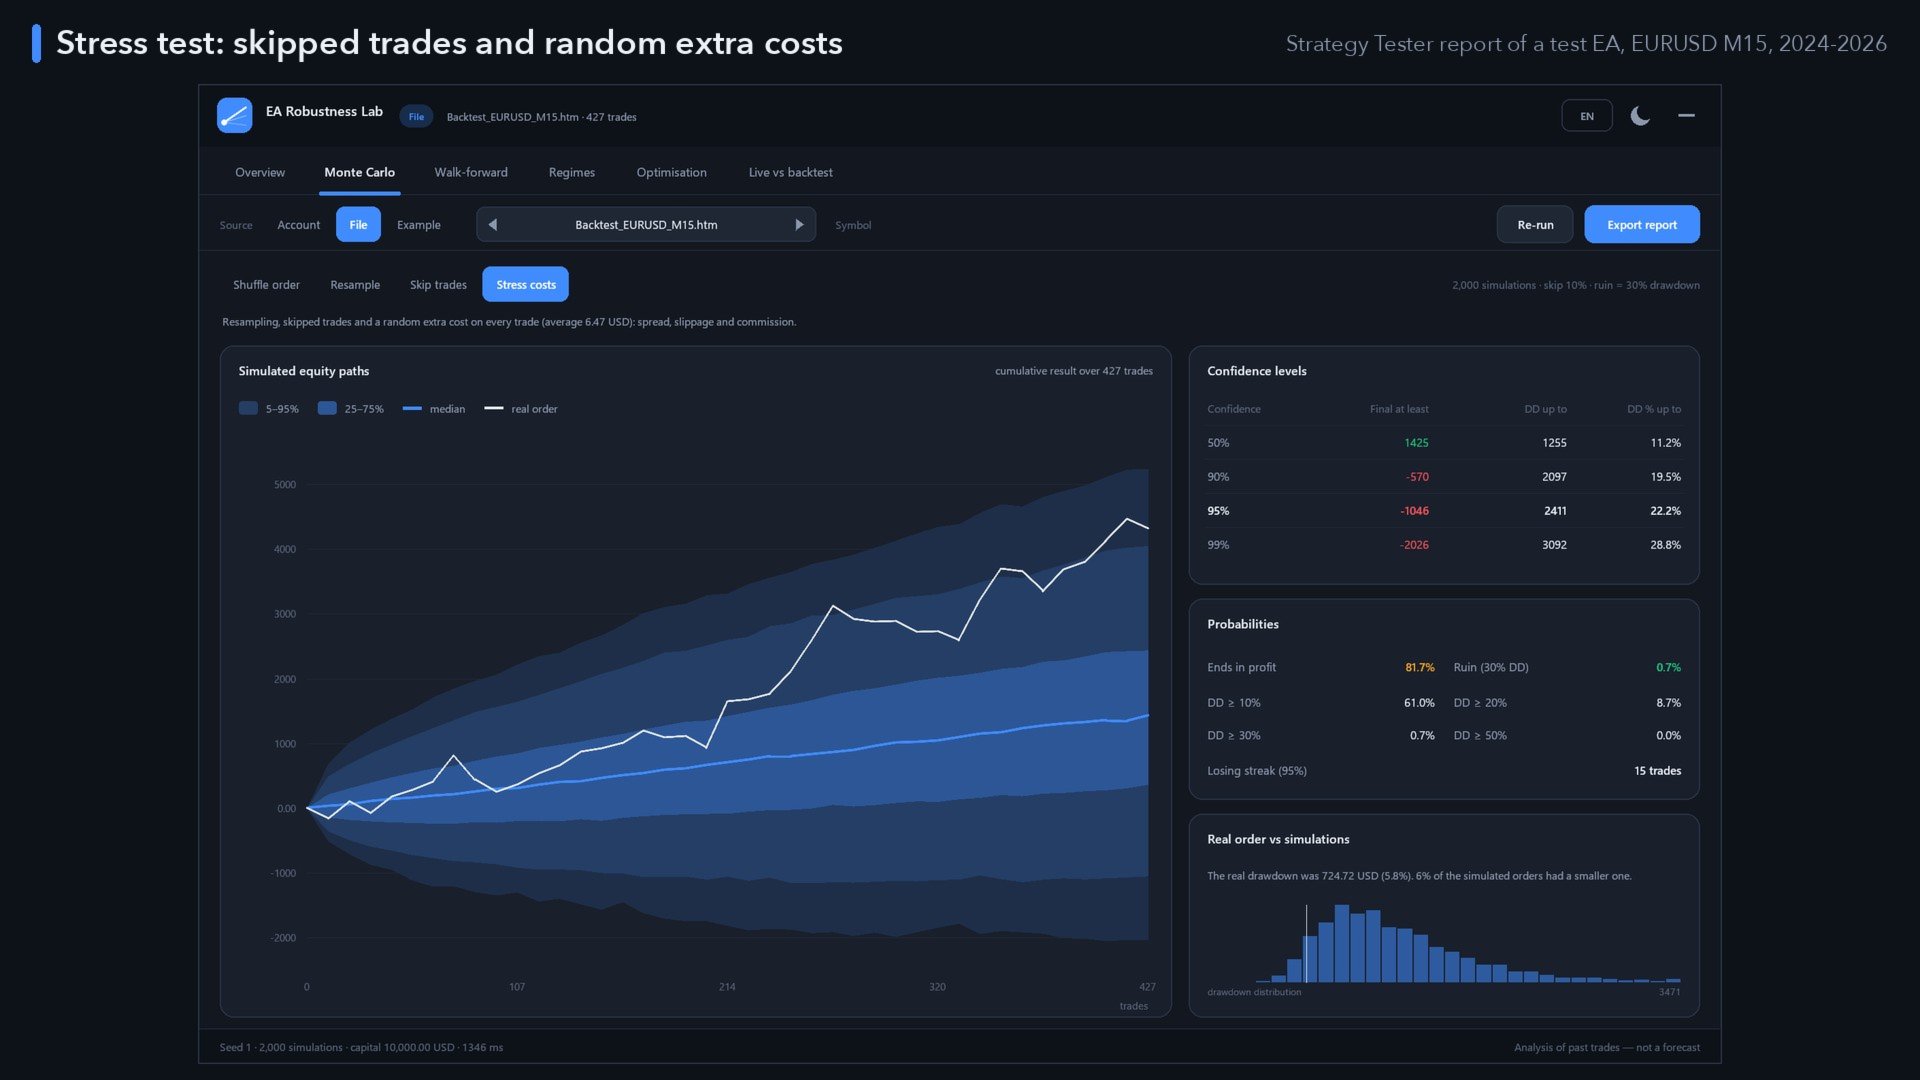
- Stress costs – resampling plus skipped trades plus a random extra cost on every trade (spread, slippage, commission), set per lot or as a share of the average trade.
- Fan chart of the simulated equity paths (1–99 %, 5–95 %, 25–75 % bands, median) with the real path on top.
- Confidence table at 50 / 90 / 95 / 99 %: final result at least, max drawdown up to (money and %).
- Probability of ending in profit, probability of ruin at the drawdown you define, chance of 10 / 20 / 30 / 50 % drawdowns, 95 % losing streak, and where the real drawdown sits in the distribution.
- Fixed random seed: the same inputs always give the same numbers. Re-run uses the next seed.
Walk-forward efficiency and stability
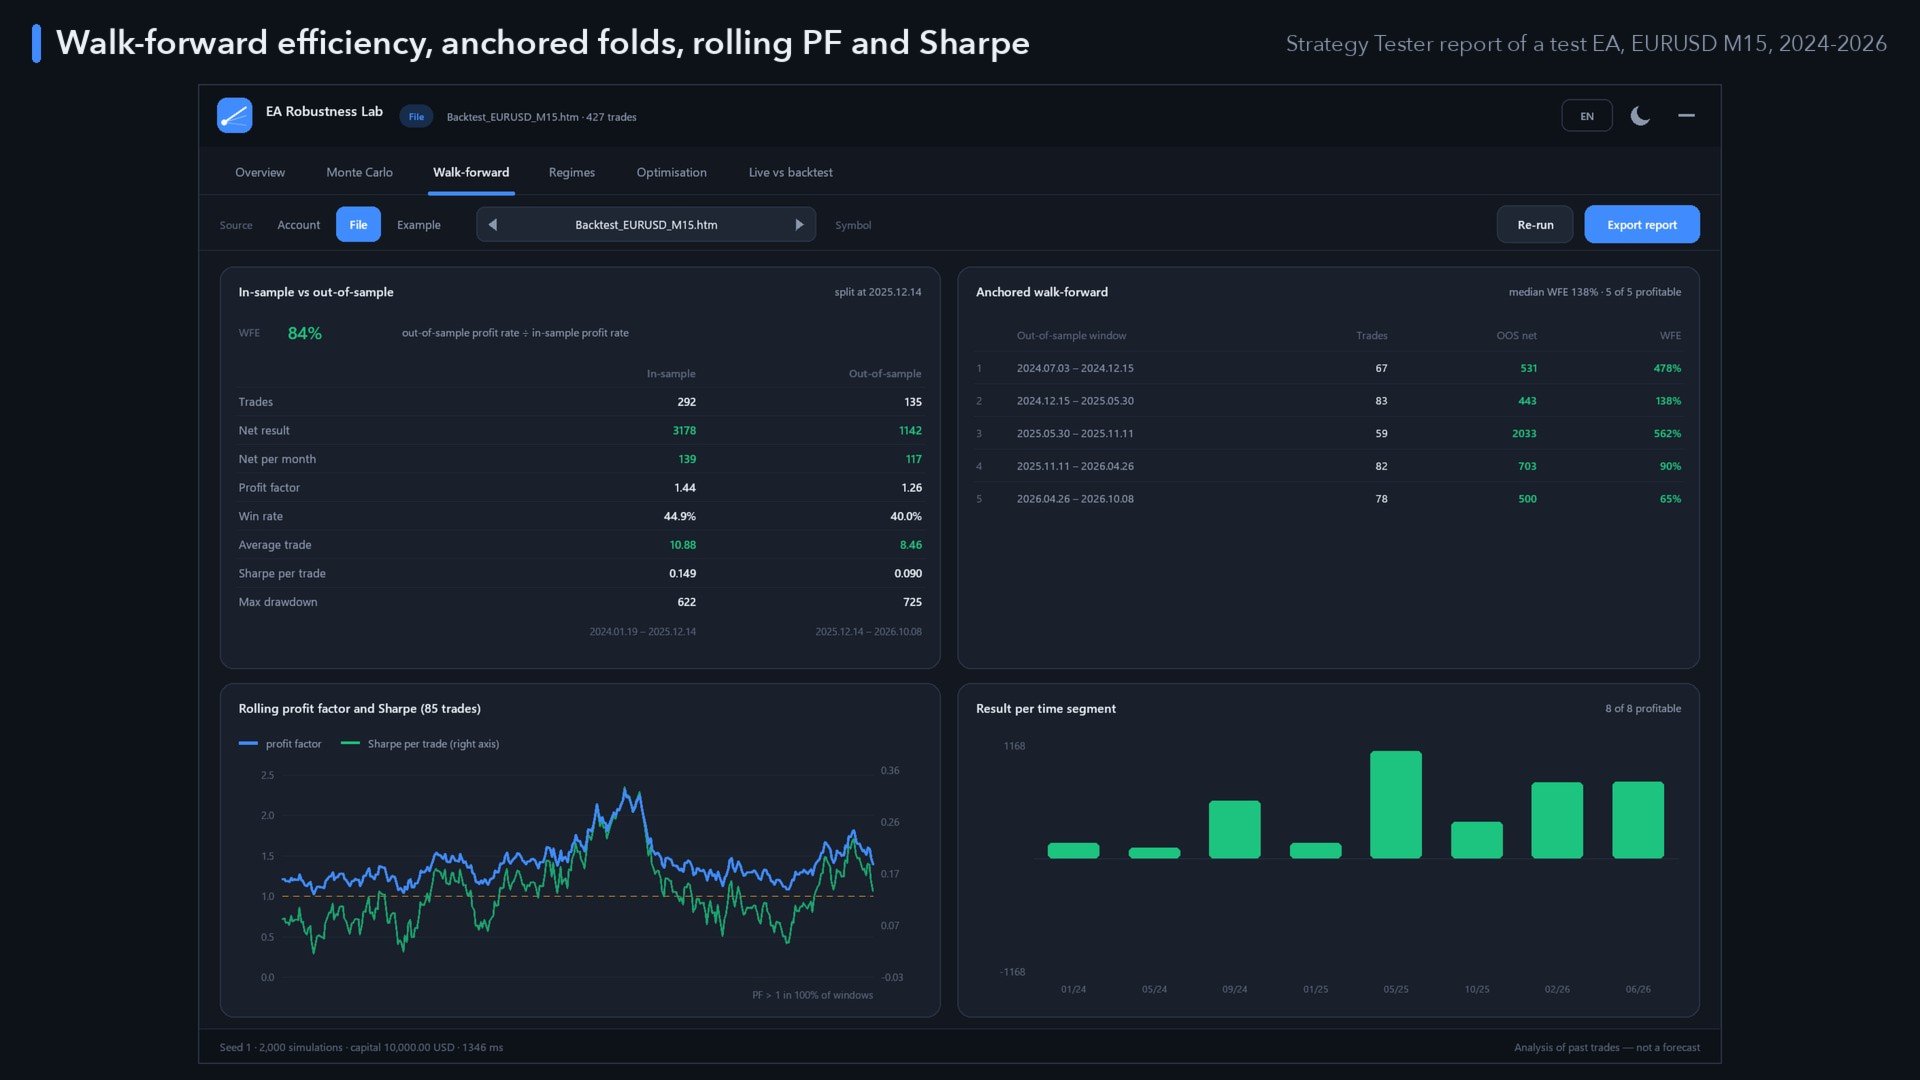
- In-sample vs out-of-sample – split at the date your optimisation ended (or at a share of the history): trades, net, net per month, profit factor, win rate, average trade, Sharpe and drawdown side by side, and the walk-forward efficiency (out-of-sample profit rate ÷ in-sample rate).
- Anchored walk-forward folds – each later window measured against everything before it, with WFE per fold.
- Rolling profit factor and Sharpe over a window of trades, and the share of windows with PF above 1.
- Result per time segment – an edge that faded shows at a glance.
Regimes
- Results by direction, year, weekday and entry hour.
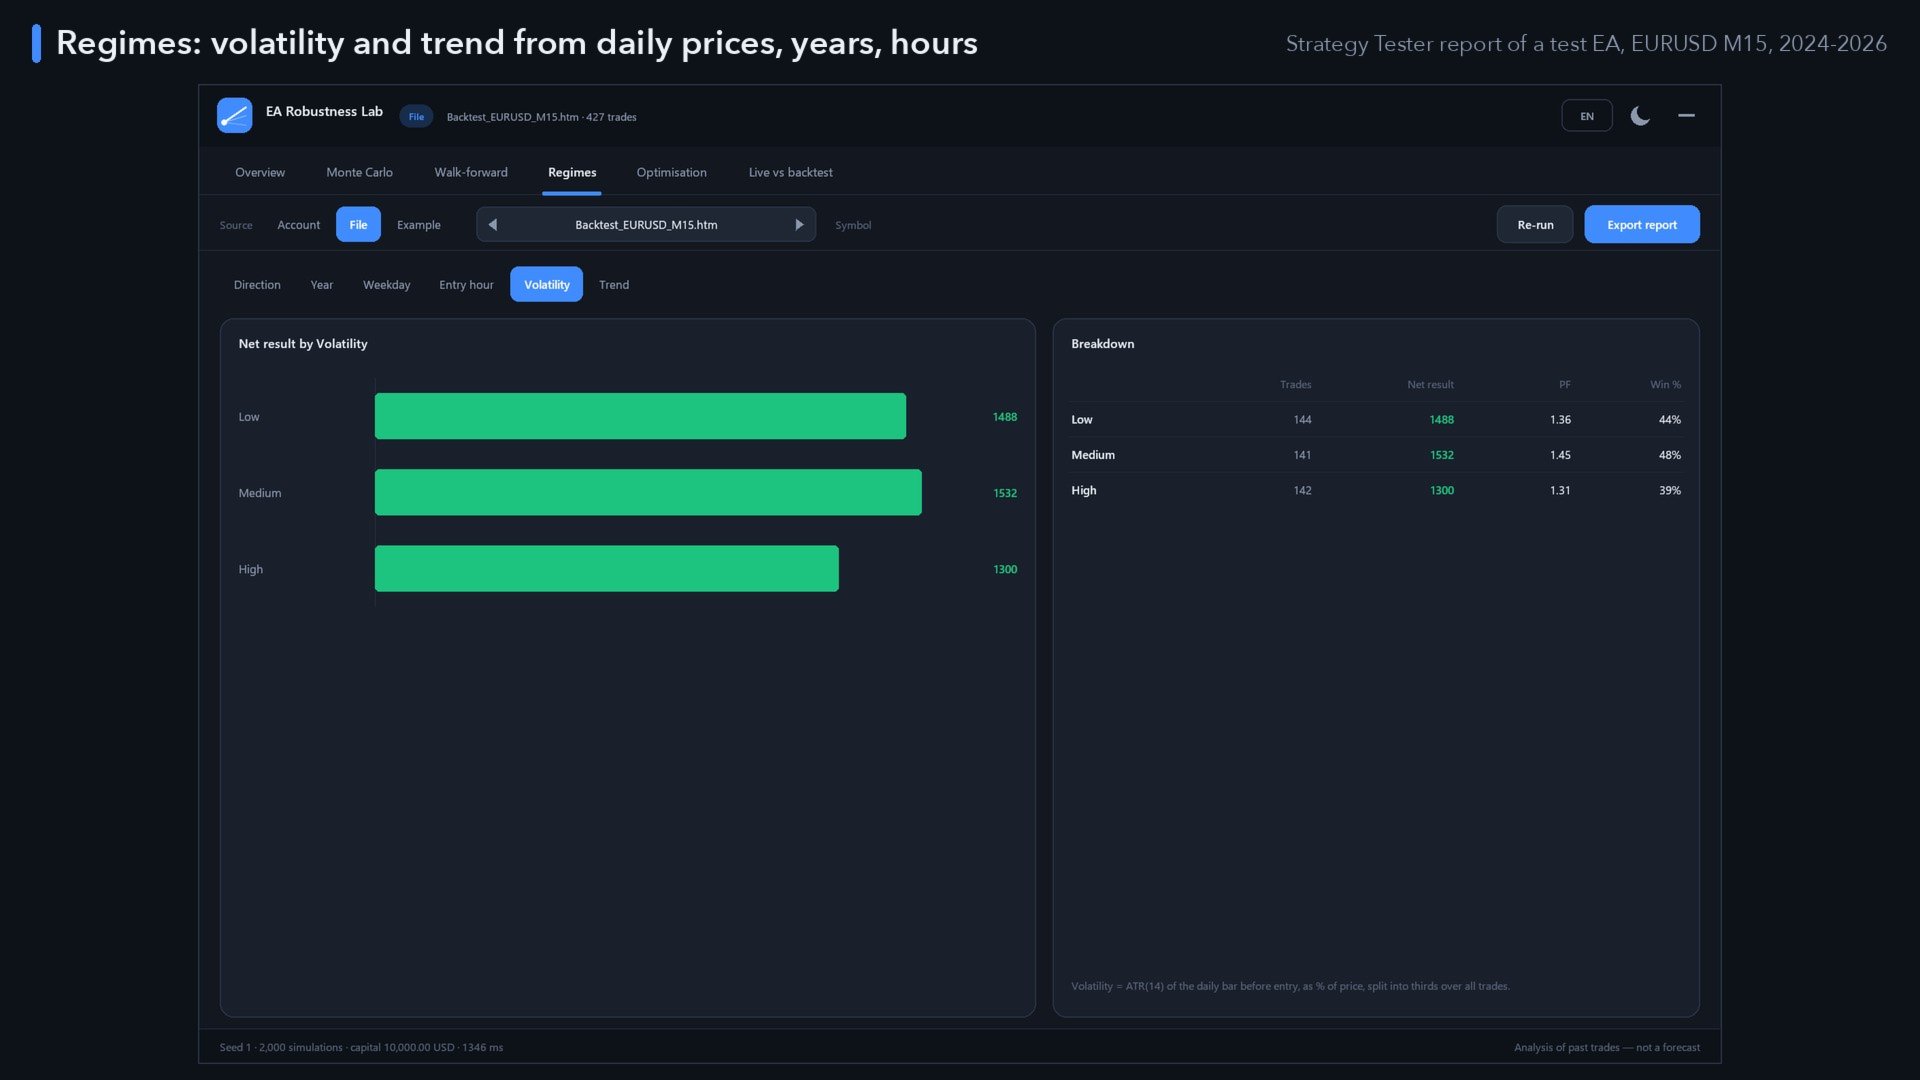
- Volatility regime (ATR of the daily bar before entry, in thirds) and trend regime (above or below the 200-day average) from the symbol's own daily history – a strategy that only worked in one market condition is easy to spot.
Optimisation analysis
- Reads the Strategy Tester's optimisation results exported to XML (complete or genetic runs, forward results too).
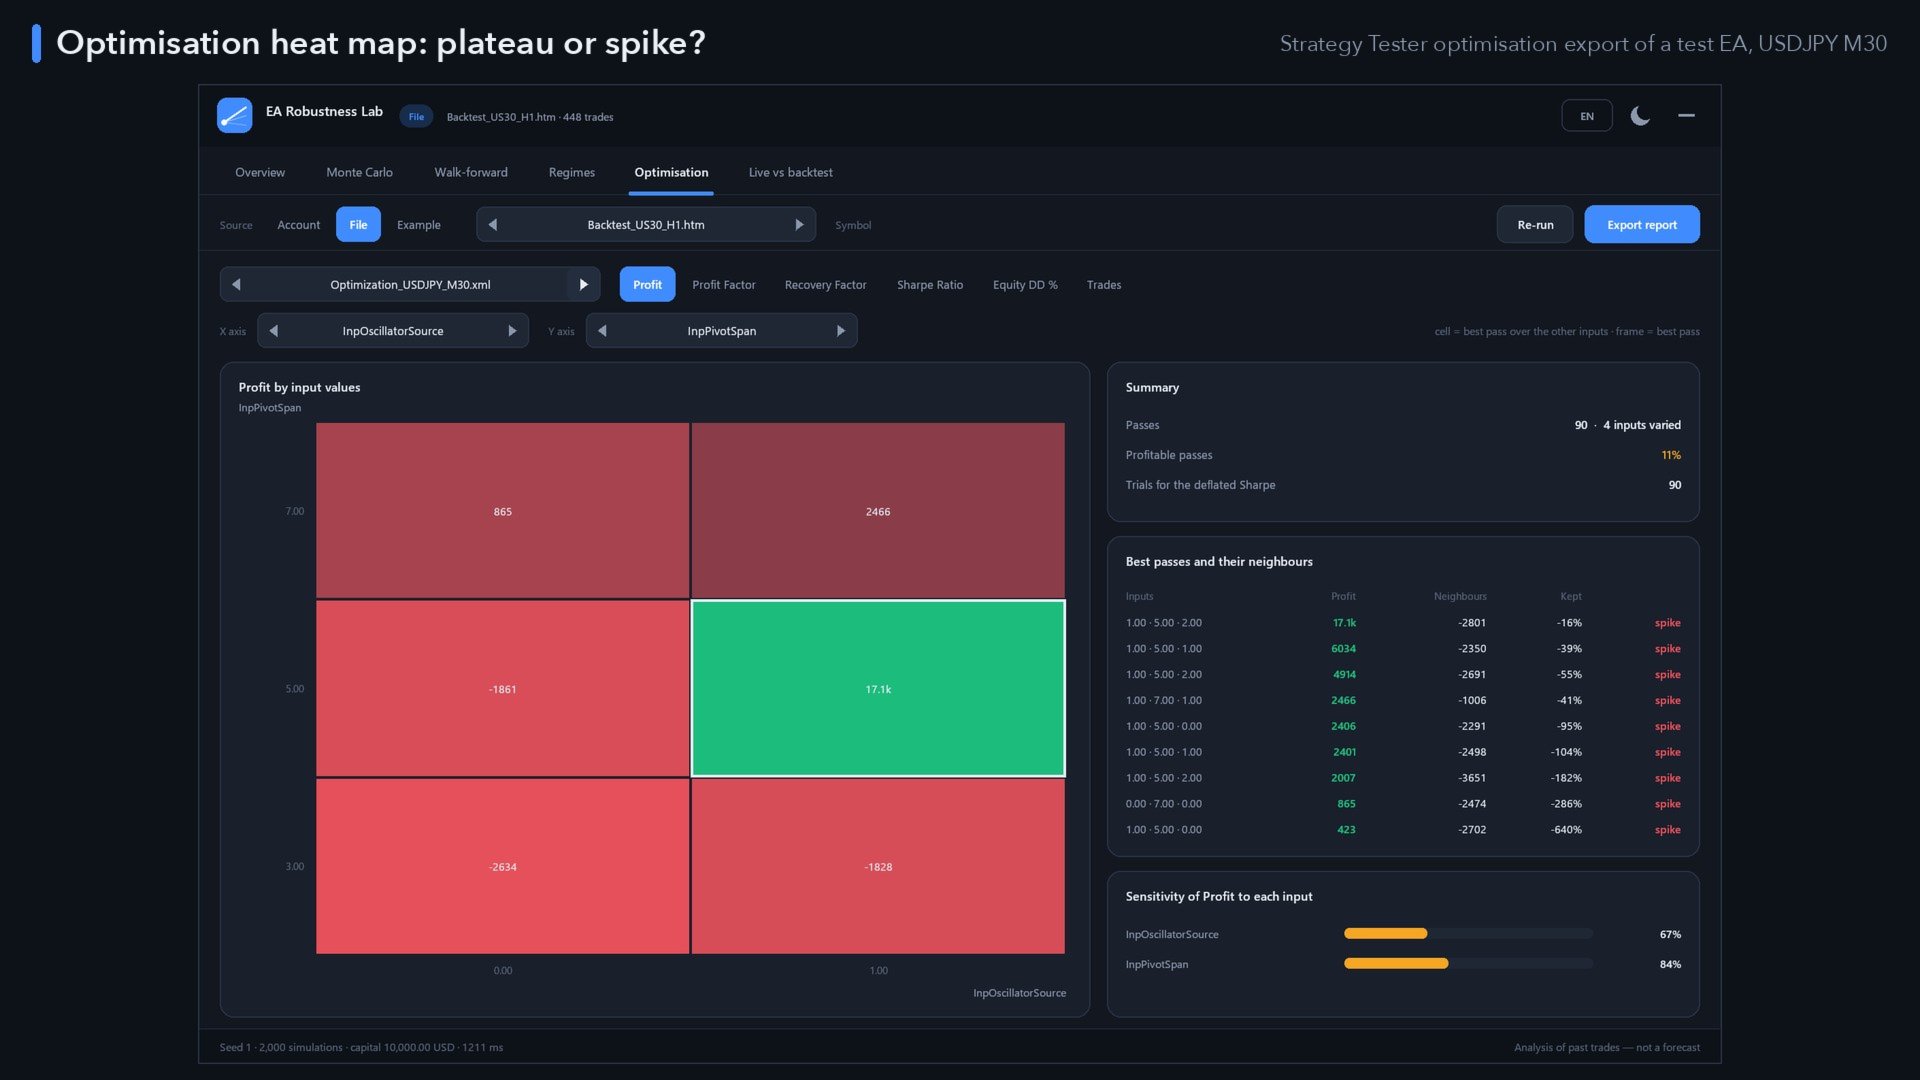
- Heat map of any two inputs for profit, profit factor, recovery factor, Sharpe ratio, drawdown or trades; the best pass is framed.
- Plateau or spike – the ten best passes with the average of their neighbouring passes and the share of profit they keep (plateau / slope / spike).
- Sensitivity of the result to each input, and the share of profitable passes.
- The number of passes feeds the Deflated Sharpe test automatically.
Live vs backtest
- Choose the EA's backtest report as the baseline; the live trades come from the account history with your filters.
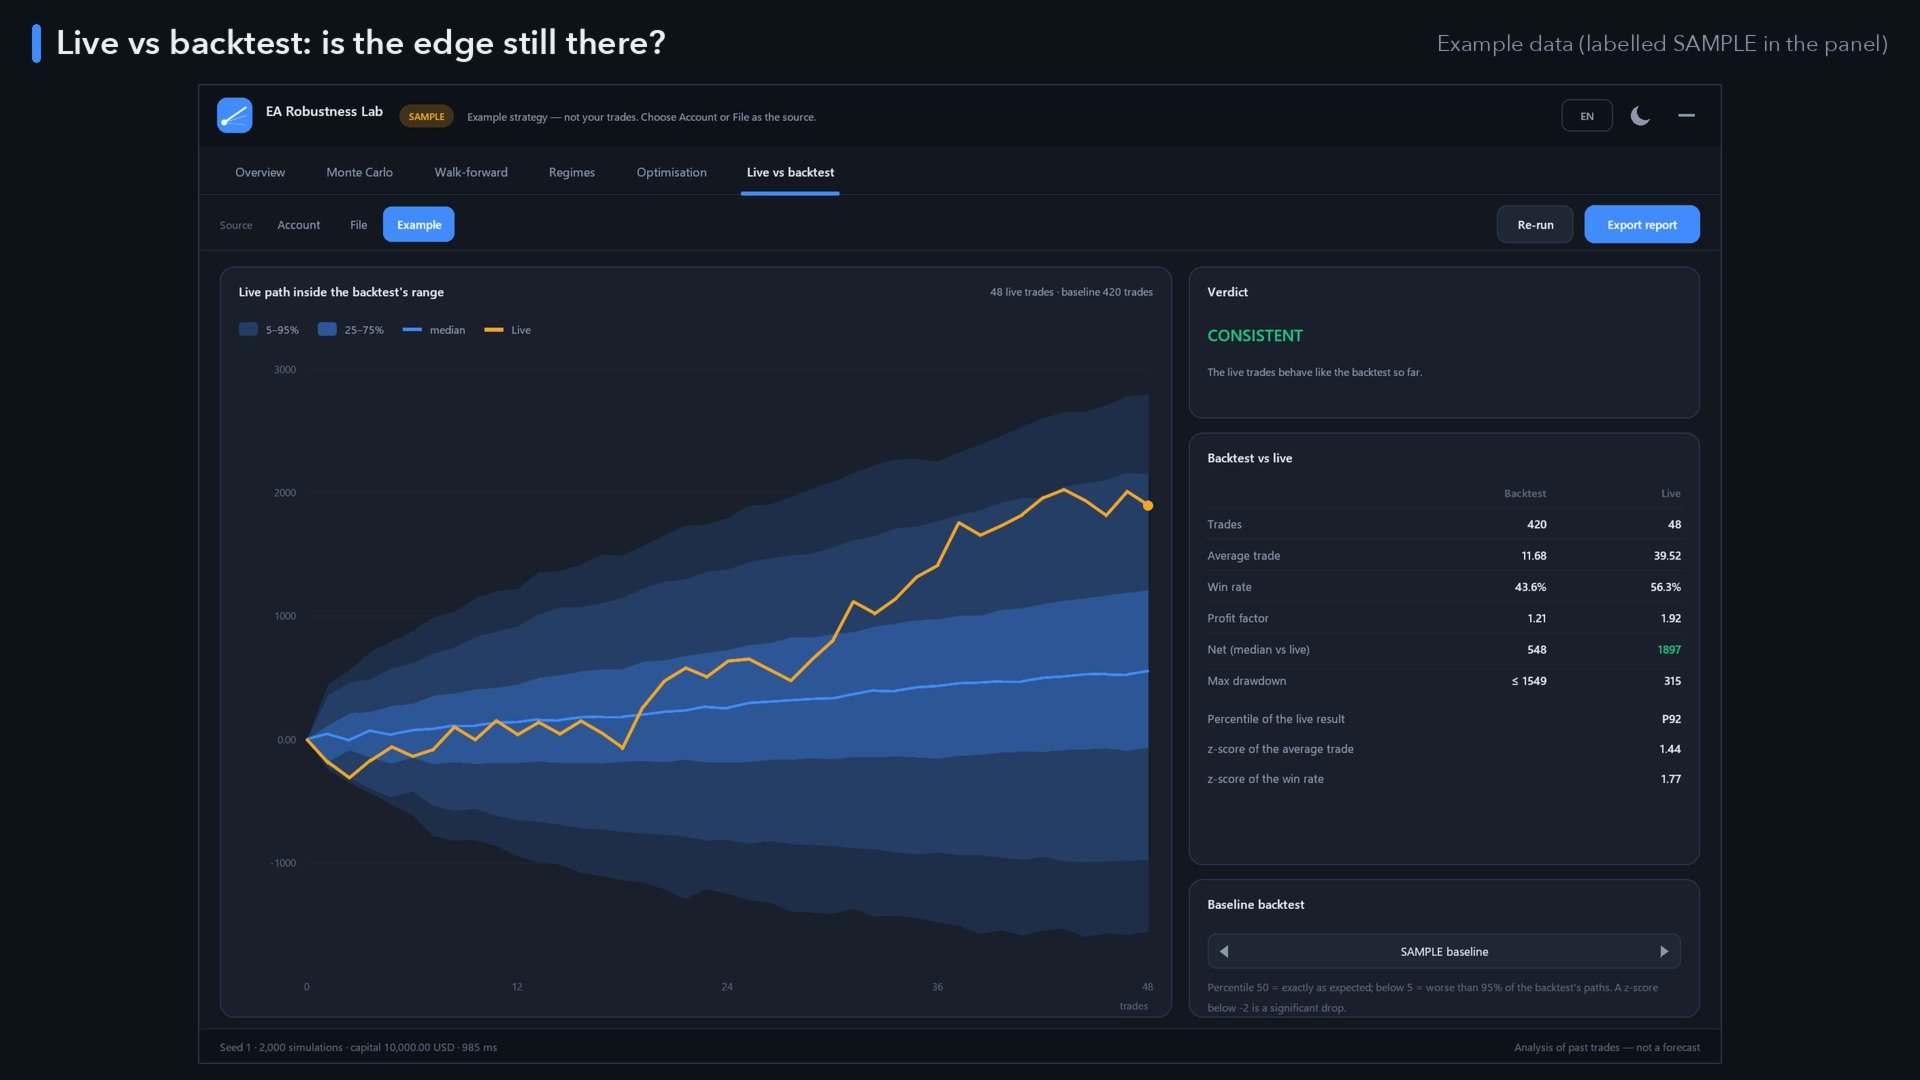
- The live equity path is drawn inside the range the backtest makes likely for the same number of trades.
- Percentile of the live result, z-scores of the average trade and win rate, live drawdown vs the 95 % backtest drawdown.
- Verdict: CONSISTENT, WATCH or DETERIORATED.
The robustness score
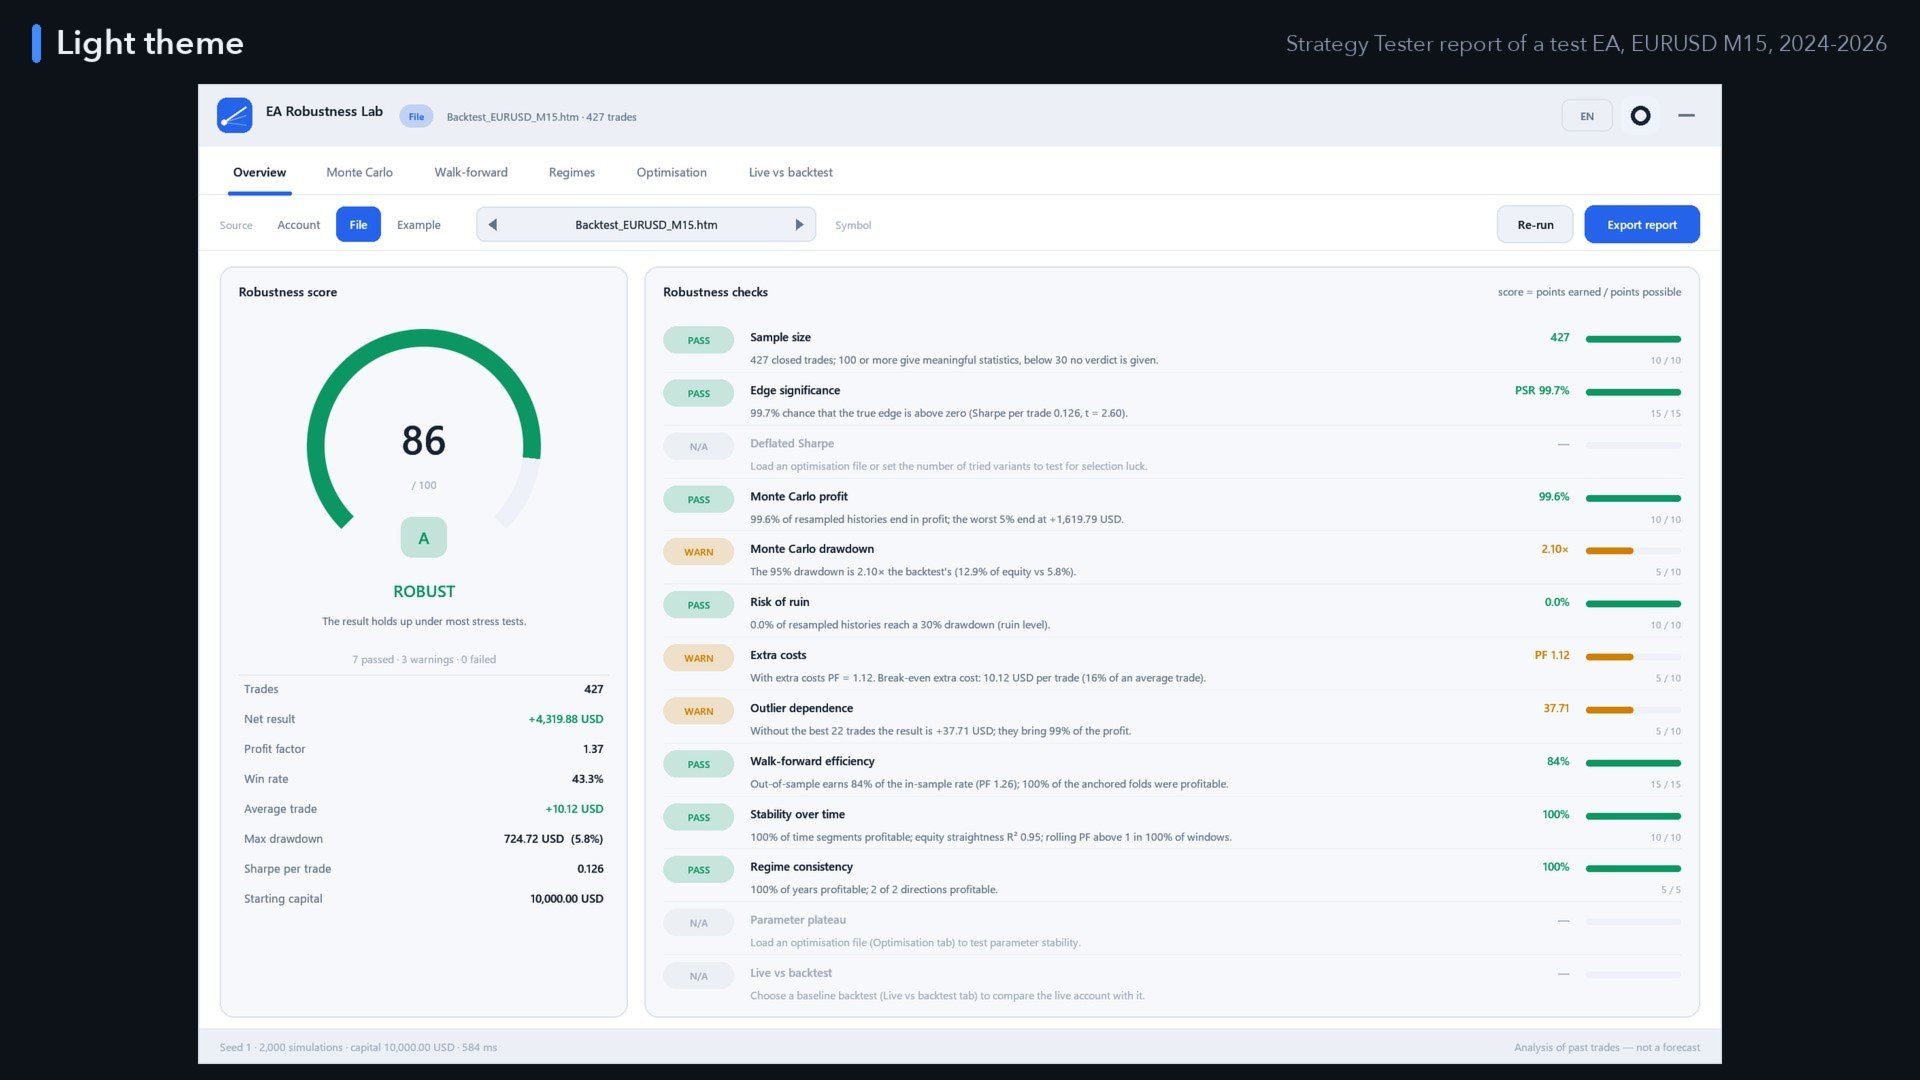
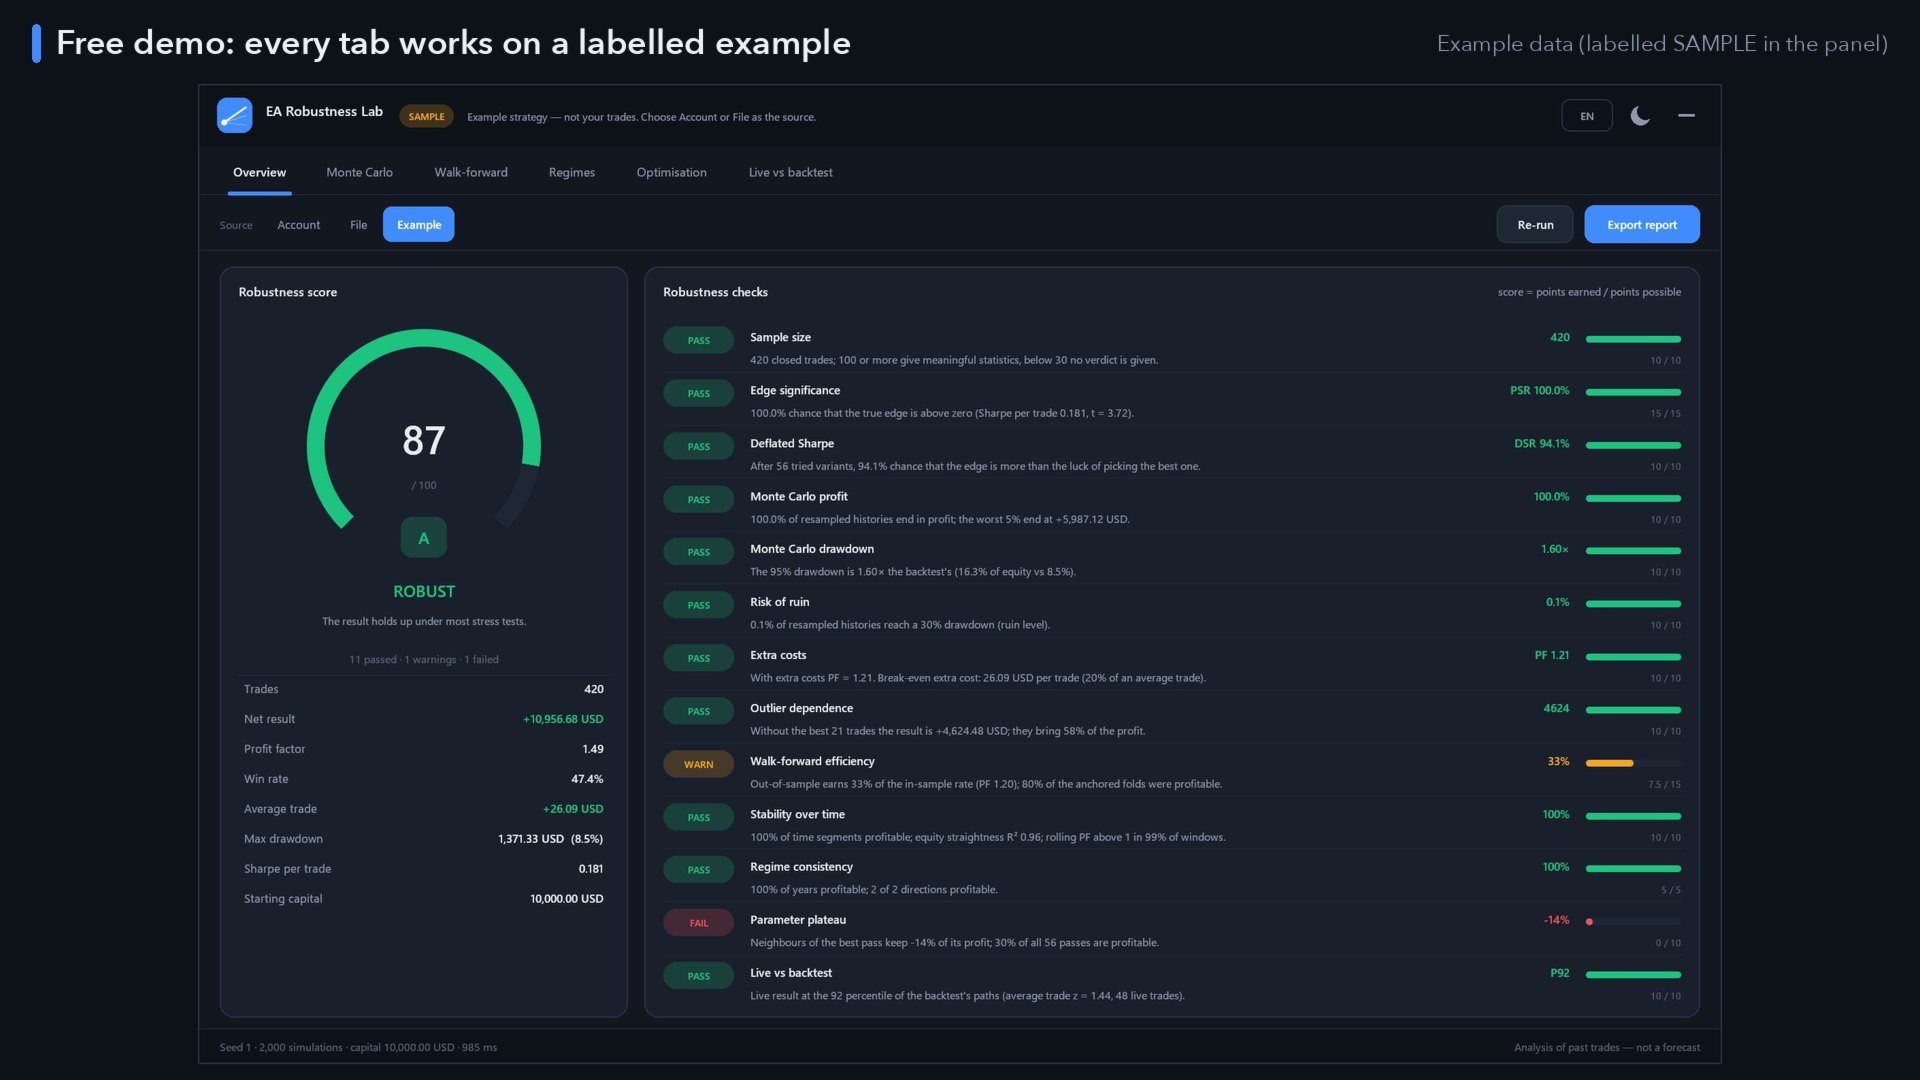
Thirteen checks, each PASS / WARN / FAIL with the numbers behind it: sample size, edge significance (Probabilistic Sharpe Ratio with skew and kurtosis), Deflated Sharpe (number of tried variants), Monte Carlo profit, Monte Carlo drawdown, risk of ruin, extra costs (with the break-even extra cost per trade), dependence on the best trades, walk-forward efficiency, stability over time, regime consistency, parameter plateau and live vs backtest. Checks that do not apply are left out. Score = points earned ÷ points possible; verdict ROBUST, MODERATE or FRAGILE, or NOT ENOUGH DATA below your minimum number of trades.
Report and panel
- Export report – one self-contained HTML page (score, every check, charts and tables) plus a CSV with the checks, statistics, Monte Carlo percentiles and the trade list, in MQL5\Files\EA_Robustness_Lab\Reports.
- Native chart panel: dark and light themes, sharp at any screen scaling (100–300 %), movable and minimisable, settings remembered.
- Seven languages: English, Deutsch, Español, Português, Русский, 中文, 日本語.
- Statistics verified by unit tests against independent reference values.
Free demo
In the Strategy Tester there is no account history and no file access, so the demo runs on a clearly labelled example strategy (SAMPLE) with every tab working. On a live chart you can switch to the example at any time with the Example button.
Main inputs
Source, file name, magic numbers, symbol, comment, date range, starting capital; simulations per method, skipped trades %, extra cost (per lot or % of the average trade), ruin drawdown, random seed; in-sample end date or share, number of folds and segments, rolling window, share of best trades removed, number of tried variants; optimisation file, baseline file; language, theme, scale and panel position.
The tests describe how the supplied past trades behave under resampling, reordering, extra costs and time splits. They do not predict future results, and no tool can guarantee profits. Trading involves risk.