Target Geometry

4

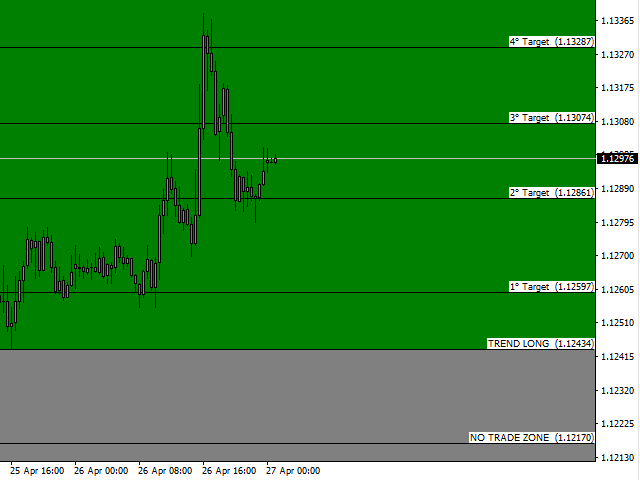
Target Geometry è un indicatore che utilizza la natura geometrica dei mercati per fornire alti livelli di probabilità statistica (Fibonacci).

Questo indicatore crea una mappa molto utile sul grafico che ottimizza i punti di ingresso e definisce in modo ottimale la gestione del denaro.

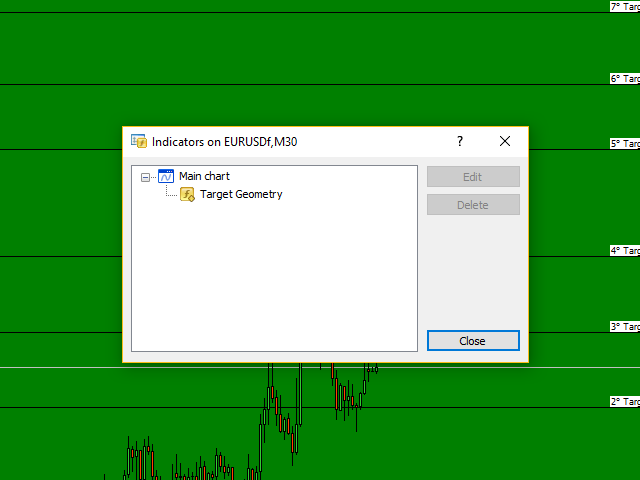
L'indicatore può essere utilizzato sia in modalità statica quindi sullo storico che in modalità dinamica sul periodo attuale.

Funzionante su qualsiasi strumento finanziario.

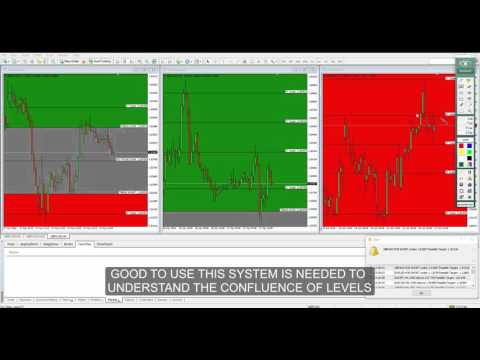
L'uso in modalità multi timeframe su più grafici è un ottimo alleato per avere chiara la direzione del mercato.

I livelli target sono ad alta probabilità statistica, pertanto si consiglia di usare estrema cautela.

Questo indicatore ti darà una nuova prospettiva e ti suggerisce una decisione sul mercato.

Siamo molto felici di aver creato questo indicatore e speriamo che possa essere utile a tutti.
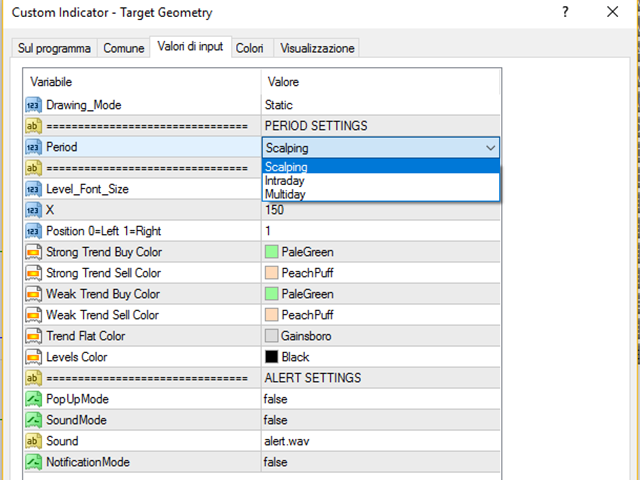

Valori di input:

IMPOSTAZIONI MODALITÀ

  • Scalping (per l'uso in TF ridotti)
  • Intraday (per l'uso in TF intermedi)
  • Multiday (per l'utilizzo in TF elevati)
  • Periodi

IMPOSTAZIONI DEI LIVELLI/GRAFICA

  • Colore TRADE ZONE: NO TRADE, LONG, CORTO
  • Colore Livelli per ciascuna zona
  • larghezza della linea per ciascuna zona
  • Stile della linea per ciascuna zona


Recensioni 10
Abdullah Alrihily
2151
Abdullah Alrihily 2018.11.26 05:37 
 

good indicator so far

Vitaliy Kuchanskiy
501
Vitaliy Kuchanskiy 2018.06.12 14:07 
 

very nice indicator. useful indicator for scalping to get TP positions. рекомедую.

rpd2
209
rpd2 2017.03.29 14:33 
 

I must thank the developers of this indicator. I am almost ashamed to say, but after spending so much money on EAs and indicators on MQL5, this is the

first indicator that is actually making me real cash consistnetly already. I don't know how to say thanks more. It changes the way I look at the charts and

my confidence in confirming other sigals. It is simple to use but I think a bit complex in its internal design.

Thanks guys. Whether you want to scalp, day trade or longer term trade this is the indicator for you.

My personal strategy is to load the indicator on mulitple instruments at the beginning of a new trading day.

Analyse the market from scalper to day trading to intermediate mode.

Then set orders buy and sell a few pips outside the buy and sell zones clearly marked by the indicator.

I set TP conservative at Target 3-4 , but manage it depending on the signal of stregth of market which the indi also shows.

Then I may add other pending orders depending on the signals that the indicator will give during the day.

I rented it for 3 months and made back the money in 1 trade on a 200$ account with 0.01 lots.

I hope everyone that buys this indicator will have good success.

There are lots of indicators for hundreds of dollars that are not worth 1 cent. I highly recommend this.....

Prodotti consigliati
Pip Professional
Yaroslav Varankin
Pip Professional: A Reliable Advisor Pip Professional is a reliable advisor that operates on a new algorithm featuring three filters and uses moving averages (MA) to determine the trend. Recommendations: Max Spread: Trades will not be opened once the set spread value is reached. Slippage: Deviation from the price at the moment of order opening. Take Profit: 40 pips. Stop Loss: 35 pips. Lots: Trade size of 0.1. Timeframe: From M1 to D1. Currency Pairs: GBPUSD, EURUSD, and others. You can test th
Hydra Trend Rider is a non-repainting, multi-timeframe trend indicator that delivers precise buy/sell signals and real-time alerts for high-probability trade setups. With its color-coded trend line, customizable dashboard, and mobile notifications, it's perfect for traders seeking clarity, confidence, and consistency in trend trading. Setup & Guide:  Download  MT5 Version here. To learn how to use the Indicator: Indicator Manual & Guide -   Read Here Exclusively for you: It's your chance to st
Breakout Monster Expert Advisor
Abdulfattah Yahya Mohammed Alhazmi
For The English Manual you can contact me. The Most advanced and comprehensive EA to trade Trend Breakout The “Breakout Monster EA” trades breakouts when the current price of the currency pair breaks a predefined horizontal level or trendline on the currency pair's chart. The opening of the position can be immediate after breaking the drawn trendline OR after closing the candle above/below this trend, provided that all technical and non-technical filters, defined by the trader through the exp
Features: Sharkfin Alerts Multi-timeframe Multi-currency SM TDI: To show TDI lines with sharkfin levels Zigzag MTF: To see Higher Timeframe trend Detailed blog post and extras: https://www.mql5.com/en/blogs/post/759138 Arrows works on a single timeframe and single currency. But it’s visually helps see that sharkfins. You can also get the simple arrows from mql5 site product: https://www.mql5.com/en/market/product/42405 About Scanner: It is an easy to use simplified scanner. It will show when
Fundamental Signals Indicator MT4
Kyra Nickaline Watson-gordon
Fundamental Signals Indicator is a Non-Repaint Indicator with a powerful calculation engine that can predict market movement over 3000 pips (30000 points). The indicator does not analyze the market fundamentally, it is named fundamental because it can predict trends with large movements, no complicated inputs and low risk. Also Indicator can alert on market trend changes. Using Indicator : The Indicator is very simple and without complicated input parameters. (No need to optimize anything.)T
EMA Dashboard
Chantal Sala
1 (1)
Ema Dashboard is an innovative dashboard that allows you to monitor Moving Average on multiples symbols and different timeframes. This dashboard allows you to analyze information on 28 pairs on an unique chart. Its functionality includes analysis of All Time Frames. This configuration allows you to identify the Long Term Trend with extreme ease. This panel allows you to take very important directional movements. A click on button opens a new chart (symbol and timeframe). Graphic Object Symbol l
Stochastic Multicurrency Scanner Dashboard MT4 è uno strumento potente progettato per monitorare più coppie di valute e timeframe utilizzando l’oscillatore Stocastico. Organizza i segnali in un formato a griglia, mostrando lo stato di ogni simbolo nei timeframe da M1 a MN1. I trader possono abilitare o disabilitare timeframe specifici per adattarsi alle loro strategie. La versione per MT5 è disponibile qui: Stochastic Oscillator Multicurrency Scanner MT5 Per la documentazione dettagliata, clicca
The indicator is the main part of Michael Huddleston's ICT (Inner Circle Trader) trading strategy. His legendary trading strategy is based on the concept of "Smart Money". To analyze the medium -term trend , the  ICT offers an analysis based on  twenty -day levels . The indicator builds levels , while showing the turning points with arrows . An important feature of the indicator is the automatic display of levels for different periods . You do not have to change the indicator settings when chang
The Trend Professor is a moving average based indicator designed for the purpose of helping the community of traders to analyse the price trend. The indicator will be displayed in the main chart as it is indicated on the screenshot section. How it works The indicator has lines of moving averages and colored histograms to depict the direction of the trend. There will be a fast signal line colored blue/yellow/red at some points. The red/yellow colored lines stands for bearish trend/signal while th
Trend Analysis in act
Ihab Mohamed Kamal Fouda
The Trend Analysis Indicator is an innovative tool designed for traders and investors who seek to navigate the complexities of the financial markets with greater precision and insight. This powerful indicator is engineered to adeptly identify whether a market is trending or not, offering users a vital edge in their trading strategy. Key Features: Accurate Trend Detection : The core functionality of the Trend Analysis Indicator lies in its ability to accurately detect market trends. It analyzes p
This is a simple arrow system based on Engulfing Candlestick Pattern. It gives you alerts on your smartphone when there is an engulfing candlestick pattern happens. Which type of alerts available? 1. It paints on chart Up/Down Arrows. 2. Popup message and sound alert in trading terminal window. 3. Push notification or Alert on your Android and IOS mobile phones (requires MT4 or MT5 app installed!) *Note: Use it on higher timeframes like H4 (4 hours), D1 (1 Day) then find trade opportunities on s
TDI Signals generates buy and sell arrows based on a TDI(Traders Dynamic Index) algorithm. It looks for price breakouts, continuations and reversals. By default it runs in the trend mode but user is provided with the option to change that to reversal mode. Trader can use the mode which compliments his/her trading style.  Usage:-   TDI Signals can be used as a stand alone indicator with context or even be added to strategies to make confirmations more strong. Volatility based stop loss, take pro
LENA Scalp
Cence Jk Oizeijoozzisa
4.4 (5)
LENA Scalp Con tecnologia avanzata di stop-loss utilizzando intelligenza artificiale, Lena Expert Advisor offre un'esperienza di trading innovativa. Il robot di Lena evita livelli elevati di stop-loss, Martingale e trading a griglia. Invece, utilizza un sistema di stop-loss dinamico che si adatta alle condizioni di mercato. L'analisi basata sull'intelligenza artificiale aiuta a identificare opportunità chiave nel mercato, allineandosi alla sua strategia progettata con cura. Questa soluzione di
Proinsta78
Mikhail Bilan
3.5 (4)
Good afternoon friends! At the request of buyers, now when conditions for buying or selling are met, the indicator will send an alert and push notifications. Push notifications come to the phone, provided that you have the MQL application installed. You just need to enter your MetaQuoteID in the application. You can find it in the MT4 platform in the Service - Settings - Notifications section. I showed the conditions for the signal in the form of screenshots in the section screenshots 1-2 phot
Cancer
Vitalii Zakharuk
Cancer indicator is great for trend trading! An intelligent indicator algorithm with high probability shows the points of potential market reversal. If you are trading in a trend, then a trading strategy built on the basis of this indicator is perfect for you. The indicator filters out market noise, almost everything and all the necessary functions for working with a thread are built into one tool. It works on all currency pairs and on all timeframes, indicator setting - according to your desire
Vrc Updated
Vimal Chudasama
This is an indicator that has been updated from the previous VRC indicator, which has both buy and sell arrows now, and it is optimised from the previous one. You can try it out, the version is upgraded and might suit your trading style. You can also use this indicator as a confluence, or you can use it as a main signal provider; it can be used along with your strategy or top-down approach analysis. Past performance does not guarantee future performance; kindly do a top-down analysis and keep yo
Trend Monitor VZ
Sergey Ermolov
3.67 (3)
Versione MT5   | Indicatore Valable ZigZag |  FAQ La teoria delle onde di Elliott è un'interpretazione dei processi dei mercati finanziari che si basa sul modello visivo delle onde sui grafici dei prezzi. Secondo questa teoria, possiamo sapere esattamente quale tendenza sta prevalendo sul mercato, ascendente o discendente. L'indicatore Valable ZigZag mostra la struttura a onde del mercato e indica la direzione del trend principale al momento sul timeframe corrente. Per comodità, l'indicatore Tr
KT Absolute Strength MT4
KEENBASE SOFTWARE SOLUTIONS
KT Absolute Strength measures and plots the absolute strength of the instrument's price action in a histogram form. It combines the moving average and histogram for a meaningful illustration. It supports two modes for the histogram calculation, i.e., it can be calculated using RSI and Stochastic both. However, for more dynamic analysis, RSI mode is always preferred. Buy Entry When the Absolute Strength histogram turns green and also it's higher than the previous red column. Sell Entry When th
Dear Trader It is my pleasure to introduce to you my tool called the " Forex Sniper Indicator" . The major aim of this tool is to help serious traders and investors in all type of Financial Markets to catch price next movement right at the moment the price direction is about to change. This tool can be used to snipe the price direction in both down trend, uptrend and ranging markets. This tool can be used as the stand alone tool though it may be combined with other tools as well. My goal is to h
Phantom Trader Bot
Victor Manuel Suarez Torres
Phantom Trader – Expert Advisor for XAU/USD on MetaTrader 4 Phantom Trader is an Expert Advisor designed exclusively for trading the XAU/USD pair (gold vs. US dollar). This EA applies a technical approach based on a combination of two strategies: detection of support/resistance zones and candlestick pattern recognition. It is intended for traders seeking an automated tool with a clear and adaptable entry logic, suitable for the London and New York sessions. Main Features: Combined strategy: Aut
This indicator draws lines at the open, close, high and low price of the last chart candle from the set timeframe. In addition, a label shows whether it was an up or down candle. The standard settings follow the original idea of ​​getting the price data from the daily timeframe for day trading/scalping, but since this indicator is fully customizable, you can also set a different timeframe. Based on the drawn price lines, you can then also display Fibonacci levels. This function can also be
The indicator automatically sets trendlines on the really important points directly on the chart. Timeframe, color and style of the lines can be adjusted. Notification of a breakout above or below the line via a smartphone is possible. Input Parameters TimeFrame : Choose timeframe Formation : Choose swing, Shoulder head shoulder or long term formation Alerts : true = alert is on SendEmail : Send message to email address SendNotifications : Send message to smartphone or tablet AlertAtClose : A
Gann Box MT4
Frederic Jacques Collomb
5 (1)
L'indicatore Gann Box è uno strumento potente e versatile progettato per aiutare i trader a identificare e sfruttare i livelli chiave del mercato. Questo indicatore consente di disegnare un rettangolo sul grafico, che viene automaticamente suddiviso in più zone con livelli strategici 0, 0.25, 0.50, 0.75, 1 . Quando il prezzo tocca uno di questi livelli, si attivano degli avvisi, offrendo così un aiuto prezioso per le decisioni di trading. Sapete immediatamente come si sta evolvendo il mercato ri
Mr Pip Scalping Indicator is a momentum indicator that measures the magnitude of recent price changes to evaluate overbought or oversold conditions in the price of a stock or other asset with few major tweaks. This is NOT RSI. Features V2: Added Supply/Demand Filter You can select which zone to see on the chart ( Important Resistance/Support; Verified Resistance/Support; etc ).  You get alerts when prices is entering on a specific supply/demand zone. How to use? When the signal comes, you will
Hello Guys! I want to share with you a very useful tools. Anyone of us who has used MT4 for some time knows how impractical this platform can be for discretionary trading. That's why I created this graphical interface!  Interface is very simple, all the info that you need are in the video and in the screenshot. NB: Before to run the EA Interface, remember to copy the file in the comment in your MT4 folder "Controls". PATH: .../MQL4/INCLUDE/CONTROLS NB: unfortunately the interface can't be test
OVERVIEW The Vector Candle Zones Render indicator automatically renders boxes for vector candle zones that are yet to be recovered. The indicator is an implementation of an existing PVA candles indicator. Combine it with PVSRA and MarketMakerMethod strategy. FEATURES Software: MetaTrader4 - MT4 - 600+ build Timeframes: Multi-Timeframe Markets: Forex/Cryptos/Energies/Bonds/Metals/Indices/Futures/Commodities Customizable style parameters: Change Color style Change Percentage style C
KT Candlestick Patterns Scanner is a Multi-Symbol and Multi-Timeframe scanner that fetches and shows various candlestick patterns on 28 currency pairs and 9 time-frames concurrently . The scanner finds the candlestick patterns by loading the KT Candlestick Patterns indicator as a resource in the background. Features The scanner can find the candlestick patterns on 252* combinations of symbols and time-frames from a single chart. Open the signal's chart loaded with a predefined template with a s
Create your Dashboard with few clicks! With the  Custom Dashboard Wizard you'll be able to create your dashboard also without any programming knowledge. This indicator/panel will give you the possibility to add/remove the values of the Metatrader4 standard indicators in any time frame you like, with any value you like and in any market you like, just be careful about writing the market name exactly as it's written on the list of your Market Watch. The main panel will be composed of three columns
Momentum Scan Pro - The Ultimate Multi-Timeframe Signal Dashboard Stop switching between charts and timeframes. Momentum Scan Pro is a powerful, all-in-one dashboard that scans the entire market for high-probability momentum signals, delivering everything you need to trade with confidence in a single, clean interface. Built for traders who value speed and efficiency, this indicator scans up to 28 instruments across 5 different timeframes simultaneously. It identifies powerful trend continuation
Final neutral bottom pro
Saqr Mohammad Yousef Almasarweh
The Final Neutral Bottom indicator by saqr studio is a powerful technical analysis tool designed for MetaTrader 4 (MT4). It meticulously analyzes price action within a recent range to identify strong momentum shifts, providing clear, actionable trading signals with pre-calculated risk management zones. Core Features Momentum Analysis Box: The indicator automatically draws a box around a user-defined number of recent candles to establish the current trading range (high and low). Clear Buy/Sell S
Gli utenti di questo prodotto hanno anche acquistato
Indicatore Miraculous – Strumento Forex e Binario 100% Non-Repaint Basato sul Quadrato di Nove di Gann Questo video presenta l' Indicatore Miraculous , uno strumento di trading altamente accurato e potente, sviluppato specificamente per i trader di Forex e Opzioni Binarie . Ciò che rende unico questo indicatore è la sua base sul leggendario Quadrato di Nove di Gann e sulla Legge della Vibrazione di Gann , rendendolo uno degli strumenti di previsione più precisi disponibili nel trading moderno. L
Presentiamo l'Indicatore F-16 Plane, uno strumento all'avanguardia per MT4 progettato per rivoluzionare la tua esperienza di trading. Ispirato alla velocità e alla precisione imbattibili dell'aereo da combattimento F-16, questo indicatore combina algoritmi avanzati e tecnologia all'avanguardia per offrire prestazioni senza precedenti sui mercati finanziari. Con l'Indicatore F-16 Plane, volerai al di sopra della concorrenza poiché fornisce analisi in tempo reale e genera segnali di trading estrem
Attualmente 20% di sconto! La soluzione migliore per ogni principiante o trader esperto! Questo software per cruscotti funziona su 28 coppie di valute. Si basa su 2 dei nostri indicatori principali (Advanced Currency Strength 28 e Advanced Currency Impulse). Offre un'ottima panoramica dell'intero mercato Forex. Mostra i valori di forza delle valute avanzate, la velocità di movimento delle valute e i segnali per 28 coppie Forex in tutti i (9) timeframe. Immaginate come migliorerà il vostro tra
Dynamic Forex28 Navigator
Bernhard Schweigert
4.43 (7)
Dynamic Forex28 Navigator - Lo strumento di trading Forex di nuova generazione. ATTUALMENTE SCONTATO DEL 49%. Dynamic Forex28 Navigator è l'evoluzione dei nostri indicatori popolari di lunga data, che combinano la potenza di tre in uno: Advanced Currency Strength28 Indicator (695 recensioni) + Advanced Currency IMPULSE con ALERT (520 recensioni) + CS28 Combo Signals (Bonus). Dettagli sull'indicatore https://www.mql5.com/en/blogs/post/758844 Cosa offre l'indicatore di forza di nuova generazione?
Questo indicatore è un indicatore per l'analisi automatica delle onde perfetto per il trading pratico! Caso... Nota:   non sono abituato a usare nomi occidentali per la classificazione delle onde a causa dell'influenza della convenzione di denominazione di Tang Lun (Tang Zhong Shuo Zen), ho chiamato l'onda base come   penna   e la banda dell'onda secondaria come   segmento   At allo stesso tempo, il segmento ha la direzione del trend. La denominazione   è principalmente segmento di trend   (que
Shogun Trade
Yuki Miyake
5 (1)
SHOGUN Trade [Launch Special] "Special Price" Available Now! To celebrate our major update, we are running a Limited Time Sale . This is your only chance to acquire this ultimate weapon at the lowest possible price. Secure this opportunity before the price returns to normal. ~ "Full Automation" of Chart Monitoring. Conquer the Entire Market with One Tool. ~ Are you still exhausting yourself staring at charts? "Waiting for a chance" is no longer a job for humans. Switching back and forth bet
Supply and Demand Dashboard PRO
Bernhard Schweigert
4.8 (20)
Attualmente 20% di sconto! Questo cruscotto è un software molto potente che lavora su più simboli e fino a 9 timeframe. Si basa sul nostro indicatore principale (migliori recensioni: Advanced Supply Demand ).   Il cruscotto offre un'ottima panoramica. Mostra:    Valori filtrati di domanda e offerta, compresa la valutazione della forza delle zone, distanze dei pip da/all'interno delle zone, Evidenzia le zone annidate, Fornisce 4 tipi di allarmi per i simboli scelti in tutti i (9) time-frames.
BinaryIndicator
Andrey Spiridonov
BinaryIndicator is a highly accurate indicator for trading binary options. It shows excellent results in scalping. This indicator is based in multifactor analysis of trend indicators, as well as confirmation oscillators, which in the end gives an increased accuracy of signals. Advantages of the indicator Increased accuracy of signals. Excellent results when trading binary options with a short expiration time from M30 to M1 . It works on any timeframes. Works with any trade symbols. Parameters
Meravith
Ivan Stefanov
5 (1)
L'indicatore analizza il volume da ogni punto e calcola i livelli di esaurimento del mercato per quel volume. È composto da tre linee: Linea di esaurimento del volume rialzista Linea di esaurimento del volume ribassista Una linea che indica la tendenza del mercato. Questa linea cambia colore per riflettere se il mercato è rialzista o ribassista. Puoi analizzare il mercato da qualsiasi punto di partenza tu scelga. Una volta che una linea di esaurimento del volume è raggiunta, identifica un nuovo
Golden Gendut
Anthonius Soruh
5 (1)
Gendel Gendut is Binary Option Indicator From @realTatino Trade with expaired time Pairs : All Forex Pair Time Frame : M5 only Trade Time All Time Alert : Alert Message, Alert Email, Alerts Push Buffer : 4 Buffer (0,2 (Buy) || 1,3 (Sell) Broker Suitable : All Broker Binary With Forex Pair Auto Trade : Yes Repaint : NO Delay : NO Other Binary Indicator : https://www.mql5.com/en/market/product/70915 https://www.mql5.com/en/market/product/71054 https://www.mql5.com/en/market/product/57755 etc IND
Segnale GoldRush Trend Arrow L'indicatore GoldRush Trend Arrow Signal fornisce un'analisi precisa e in tempo reale dei trend, pensata appositamente per gli scalper ad alta velocità e a breve termine nel mercato XAU/USD. Progettato specificamente per il timeframe di 1 minuto, questo strumento mostra frecce direzionali che indicano chiari punti di ingresso, consentendo agli scalper di navigare con sicurezza nelle condizioni di mercato volatili. L'indicatore è composto da frecce di avviso PRIMA
Presenting one-of-a-kind Gann Indicator for XAUUSD IQ Gold Gann Levels is a non-repainting, precision tool designed exclusively for XAUUSD/Gold intraday trading. It uses W.D. Gann’s square root method to plot real-time support and resistance levels, helping traders spot high-probability entries with confidence and clarity. William Delbert Gann (W.D. Gann) was an exceptional market analyst whose trading technique was based on a complex blend of mathematics, geometry, astrology, and ancient calcul
POWR Rise Coming
Trade Indicators LLC
This indicator is SO SIMPLE… when the green Rise Coming arrow appears, a price drop may be on the way! Plain and easy profits! As you receive more than one 'Rise Coming' text signal in a downtrend, it means momentum is building larger for a bull run. HOW TO USE 1. When the green "Rise Coming" text appears, a price jump may be on the way! This indicator Never Repaints! To get the best setting it's a matter of tweaking the indicator until it gives you the best results. Our recommendation, and what
Looking for a powerful yet lightweight swing detector that accurately identifies market structure turning points? Want clear, reliable buy and sell signals that work across any timeframe and any instrument? Buy Sell Arrow MT Swing is built exactly for that — precision swing detection made simple and effective. This indicator identifies Higher Highs (HH) , Higher Lows (HL) , Lower Highs (LH) , and Lower Lows (LL) with remarkable clarity. It is designed to help traders easily visualize market str
Introduction to Fractal Pattern Scanner Fractal Indicator refers to the technical indicator that makes use of the fractal geometry found in the financial market. Fractal Pattern Scanner is the advanced Fractal Indicator that brings the latest trading technology after the extensive research and development work in the fractal geometry in the financial market. The most important feature in Fractal Pattern Scanner is the ability to measure the turning point probability as well as the trend probabi
L'indicatore " Dynamic Scalper System " è progettato per il metodo di scalping, ovvero per il trading all'interno di onde di trend. Testato sulle principali coppie di valute e sull'oro, è compatibile con altri strumenti di trading. Fornisce segnali per l'apertura di posizioni a breve termine lungo il trend, con ulteriore supporto al movimento dei prezzi. Il principio dell'indicatore. Le frecce grandi determinano la direzione del trend. Un algoritmo per generare segnali per lo scalping sotto fo
The Nihilist 5.0 Indicator includes Forexalien and Nihilist Easy Trend trading strategies and systems. It is composed of an MTF Dashboard where you can analyze the different input possibilities of each strategy at a glance. It has an alert system with different types of configurable filters. You can also configure which TF you want to be notified on your Metatrader 4 platform and Mobile application The indicator has the option to view how could be a TP and SL by using ATR or fixed points, even w
Delta Swing Pro  [Concept: Synchronization of the Waves] The greatest enemy in trading is the "contradiction" between timeframes. The 5-minute chart says Buy, but the 1-hour chart says Sell. Many traders get lost in this noise. Delta Swing Pro is designed to "Synchronize" the vectors of different timeframes. It identifies the precise moments when all market waves align in the same direction, providing a clear, hesitation-free environment for execution. 5 Core Benefits of Installing Delta Swing
RelicusRoad Pro
Relicus LLC
4.63 (106)
Сколько раз вы покупали торговый индикатор с отличными бэктестами, доказательством производительности на реальном счете с фантастическими цифрами и повсюду статистикой, но после его использования вы в конечном итоге сливали свой счет? Не стоит доверять сигналу самому по себе, вам нужно знать, почему он появился, и это то, что RelicusRoad Pro делает лучше всего! Руководство пользователя + Стратегии + Обучающие видео + Приватная группа с VIP-доступом + Доступна мобильная версия Новый взгляд на р
The Hurricane Indicator
Paul Nicholas Clevett
5 (1)
Currently switched to the 4 hour chart - but use other time frames for confirmation. :-)  I change my main time frame based on the market movement at the time. The Hurricane Forex Indicator is a multi time frame indicator that includes such things as Trade Notifications, Trade Calculator, Momentum Indicator, risk reward and much more. We have a free Trade room for our users as well. Please check out the video for full details of how this indicator works as it has over 15 years worth of developme
What indicator do you look at most on your MT4 charts? Is it the Moving Average? I d o not believe that the default grid lines on MT4 charts—which you likely see hundreds or thousands of times—are designed with the intent of helping the user win. This is why MT4 users apply various indicators and go through trial and error. Because it is a chart you look at every day, it must present reliable information that we humans can recognize intuitively. This indicator was born from a single core concep
OrderFlow Absorption – Indicatore professionale di Delta e Segnali di Assorbimento per MT4 Sblocca la potenza della vera analisi del flusso degli ordini con OrderFlow Absorption – l’indicatore definitivo di istogramma delta e segnali di assorbimento per MetaTrader 4. Progettato per i trader che vogliono vedere cosa succede davvero dietro ogni movimento di prezzo, questo strumento rivela la pressione nascosta di acquisto/vendita e gli eventi di assorbimento che muovono il mercato. Caratteristiche
NAM Order Blocks
NAM TECH GROUP, CORP.
3.67 (3)
MT4 Multi-timeframe Order Blocks detection indicator. Features - Fully customizable on chart control panel, provides complete interaction. - Hide and show control panel wherever you want. - Detect OBs on multiple timeframes. - Select OBs quantity to display. - Different OBs user interface. - Different filters on OBs. - OB proximity alert. - ADR High and Low lines. - Notification service (Screen alerts | Push notifications). Summary Order block is a market behavior that indicates order collection
Il sistema di trading tecnico delle frecce BB è stato sviluppato per prevedere punti inversi per prendere decisioni al dettaglio. L'attuale situazione di mercato è analizzata dall'indicatore e strutturata per diversi criteri: l'aspettativa di momenti di inversione, potenziali punti di svolta, segnali di acquisto e vendita. L'indicatore non contiene informazioni in eccesso, ha un'interfaccia comprensibile visiva, che consente ai trader di prendere decisioni ragionevoli. Tutte le frecce sembrano
Innanzitutto, vale la pena sottolineare che questo Strumento di Trading è un Indicatore Non-Ridipingente, Non-Ridisegnante e Non-Laggante, il che lo rende ideale per il trading professionale. Corso online, manuale utente e demo. L'Indicatore Smart Price Action Concepts è uno strumento molto potente sia per i nuovi che per i trader esperti. Racchiude più di 20 utili indicatori in uno solo, combinando idee di trading avanzate come l'Analisi del Trader del Circolo Interno e le Strategie di Trading
Title: BBMA Structure Guide - BBMA Structure Guide Description: BBMA Structure Guide is a specialized MQL4 indicator designed to help traders understand the journey of BBMA structure more easily and efficiently. BBMA, or "Bollinger Bands Moving Average," is known for its motto "One Step Ahead," highlighting the importance of understanding market structure in depth. With BBMA Structure Guide, you can quickly identify the underlying market structure patterns that drive price movements. This wil
Introducing the Delta Volume Profile Indicator - Unleash the Power of Institutional Precision!  Technical Indicator: Are you ready to trade like the pros? The Delta Volume Profile Indicator is no ordinary tool. It’s a high-precision, cutting-edge indicator that puts the power of institutional-grade trading in your hands. This unique indicator analyses delta volume distribution in real-time, revealing the market's hidden buy/sell imbalances that the biggest financial institutions rely on to antic
Elliott Wave Trend was designed for the scientific wave counting. This tool focuses to get rid of the vagueness of the classic Elliott Wave Counting using the guideline from the template and pattern approach. In doing so, firstly Elliott Wave Trend offers the template for your wave counting. Secondly, it offers Wave Structural Score to assist to identify accurate wave formation. It offers both impulse wave Structural Score and corrective wave Structure Score. Structural Score is the rating to sh
WeSpread
Anchor Trading S.R.L.S.
The We-Spread mt4 indicator is a spread trading tools and it is suitable for those who want to study the markets with a different approach to the contents that are normally available in online trading bookstores. I think the Spread Trading strategy is one of the best I've ever used in the last few years. This is a unique indicator for spread trading because allow you to study till 3 spreads in one time. What is Spread Trading on forex The Spread Trading is the study of the strength of 2 currency
The Super Arrow Indicator provides non-repainting buy and sell signals with exceptional accuracy. Key Features No repainting – confirmed signals remain fixed Clear visual arrows: green for buy, red for sell Real-time alerts via pop-up, sound, and optional email Clean chart view with no unnecessary clutter Works on all markets: Forex, gold, oil, indices, crypto Adjustable Parameters TimeFrame Default: "current time frame" Function: Sets the time frame for indicator calculation Options: Can be set
Altri dall’autore
Time Range Separator  is a useful tool to display a separator period on your platform. You could go in the properties of the indicator, select the desired range and that's ALL. We believe it is a useful and necessary that we wish to share with you for free all our followers. Input Values: TimeFrame = Period Separator Separator_Color = Vertical Color Line Separator_Style = Vertical Color Style Separator_Width = Vertical Line Width Good trading to all and see you soon. Same indicator for MT4 here
FREE
Time Range Separator
Chantal Sala
4.83 (6)
Time Range Separator is a useful tool to display a separator period on your platform. You could go in the properties of the indicator, select the desired range and that's ALL. We believe it is a useful and necessary that we wish to share with you for free all our followers. Input Values: TimeFrame Period Separator GMT_Hour (ex. +1 or -1) to move the lines at Period Time +/- tot hours in input Hide_dates to show or hide the datetime on vertical lines VLine_Color = Vertical Color Line VLine_Style
FREE
Delta Single Volume
Chantal Sala
3.67 (3)
Volume Delta is a very powerful indicator that reads the supply on the Market. It calculates the Delta from movement of the price and the difference of BUY and SELL Tick volumes. Its special structure allows you to get all timeframe values available on the MT4 platform. A good observation of this instrument can suggest great entry points and possible reversal. We are confident that this tool will help you to improve your trading timing. See also for MT5:  https://www.mql5.com/en/market/product/5
Delta Single Volume is a very powerful indicator that reads the supply on the Market. It calculates the Delta from movement of the price and the difference of BUY and SELL volumes. Its special structure allows you to get all timeframe values available on the MT5 platform. It works on Tick Volumes and Real Volumes (if avalaibles on your Broker). A good observation of this instrument can suggest great entry points and possible reversal. We are confident that this tool will help you to improve you
This is a utility to copy in Expert Advisor folder. The EA will force the download of your History Center MetaTrader. It will not download new data from your broker but it will aid your MT4 to charge every chart correctly. You can choose the symbols to download. After the launch, the EA will be removed automatically from the chart. After the launch, you can see results under Experts panel on MT4. The log will show you the data charged or not charged. Symbol TF = Number of candles charged. Ex: Su
FREE
Volume Spyke
Chantal Sala
4 (1)
The Volume Spike indicator is a useful tool to identify the directional market's intention. How Does It Work: The Volume Spike indicator identifies the volume peaks and creates a sensitive rectangle equipped with Alert and Warning Pop Up that it suggests the market's direction. This tool has the ability to select the time frame on which to do the analysis of volume and it gives a great visual signal colored into rectangle. The indicator can identify valid market signals but it can also suggest
HLOC
Chantal Sala
5 (3)
HLOC L'indicatore HLOC è un buon alleato per identificare correttamente l'andamento del prezzo. L'indicatore è progettato per essere minimamente invasivo e mostra un ausilio visivo e sonoro per prendere decisioni sul mercato. L'indicatore è dotato di avviso sonoro e avviso popup per avere un promemoria dei movimenti di prezzo. Ti consigliamo di guardare il video qui sotto per valutarne i vantaggi operativi. Valori di input: Mostra Linee (vero/falso) TimeFramePeriod (fare riferimento alle r
InfoPanelMarket
Chantal Sala
3.5 (4)
Informational indicator which shows: Swap Price under/upper Open for every Time Frame Spread Time to close the current candle Broker Time Net Change: delta in percentage from Open (MN-W1-D1) Tick Value Volumes Info for every trades open: Lots Breakeven Profit Buy-Profit Sell Equity Symbol Positive values are green and negative values are red (modifiable in input). Inputs: View BE line (enable/disable) View all Symbol (shows the list of symbol) Color (for every text) Line Color (for BE line)
One Click FX Panel
Chantal Sala
5 (2)
Questo pannello è molto semplice da usare ed è un ottimo alleato per gestire le tue posizioni e ordini. Puoi gestire tre tipi di rischio: lotto fisso, denaro e percentuale. Il lotto in percentuale ed in denaro viene calcolato a fronte dei punti di stoploss inseriti. Un click sul pulsante per cambiare modalità velocemente e l'operazione a mercato è inserita! Pulsanti: COMPRARE VENDERE BE: Pareggiare Diviso: chiude metà operazione X:  Chiudi tutte le posizioni §: Hedging (apertura posizione par
BreakEven Line è un indicatore molto utile e facile da usare. In caso di più posizioni aperte sullo stesso strumento, l'indicatore mostra il punto di pareggio dove è possibile chiudere le posizioni. La sua semplicità grafica lo rende uno strumento discreto e personalizzabile. Puoi abilitare/disabilitare una linea su un grafico, in modo da rendere invisibile l'indicatore. Input Mostra BE cumulativo (linea on/off) Colore della linea di pareggio (per cambiare il colore della linea) Stile dell
Volume POC
Chantal Sala
5 (2)
Volume POC L'indicatore Volume POC mostra livelli importanti. Puoi usarlo come un sistema di trading indipendente. Le funzioni di avviso alla chiusura di una candela ti consentono di avere alcune informazioni sulla direzione del mercato. La visualizzazione grafica è semplice ed efficace. I livelli riportati sono il risultato dello studio dei volumi storici di mercato. Questi livelli offrono ottimi punti di ingresso e ottimi livelli di supporto e resistenza. È possibile utilizzare l'indicat
Open All
Chantal Sala
The Open All indicator uses a simple market information that is "Open Candle". This tool is able to show all the openings of all time frames in order to extract information of strength and trendy. You can display 28 instruments with relative time frame interior for a total of 252 informations. The display is fully customizable, you can choose either the symbol and enable/disable Time Frames. Using it correctly you could get valuable aid to intercept correlations and turning points in the market.
The indicator Net Change is a very useful tool able to extrapolate a percentage in order to have a real reference on the performance of the instrument. This indicator is designed to show the main values: you could monitor the Daily, Weekly, Monthly, Quarterly, Semi-annual and Annual percentages. A necessary tool for those who want to really explore the quantitative logic of the market. Input values SYMBOLS SETTINGS Use_Only_Current_Symbol (true/false): Permits to manage only current symbol on p
Best And Worst
Chantal Sala
5 (1)
The Best and Worst indicator (similar to Net Change Indicator) has the peculiarity of being a dynamic indicator. It seems a very Stock Exchange Indicator. This means that it is able to draw up a list and put in order the best and worst instruments in descending order. You can choose to show the percentage of any Time Frame: 1M, 5M, 15M, 30M, H1, H4 etc ... This instrument could really give great suggestions on your trading in order to center the right time and to have a total view of the markets
Volume Delta Panel
Chantal Sala
4.8 (10)
Volume DeltaPanel is a very powerful indicator that read the supply on Market. It calculates the Delta from movement of the price and the difference of BUY volumes and SELL volumes. The Volumes are added to price and normalized to symbol points. Its special structure allows you to get all Time Frames values available on the platform MT4. Panel can show 28 instruments simultaneously all customizable according to the offer of the Broker. A good observation of this instrument can suggest great ent
Price Trend Light
Chantal Sala
4 (1)
Price Trend Light indicator is a beautiful indicator that shows purchasing areas and sales areas. This indicator is designed to follow the movement of the price which rounds on the opening price. It also provides information of trend follow on the break of the minimum and maximum. The indicator has a very simple graphic but effective, above the opening price you will have a light green color and under the opening price there is a red light. On every Break Out of the minimum or maximum sets in in
The indicator Power Strength creates a virtual display that takes data from all Symbols. It extrapolates all the informations in order to get the strength and / or weakness to take a decision on market. This tool works only on the Forex Market and not processing data on indices, metals ... It is graphically very attractive and its simplified information could give excellent input signals. You can use this indicator to find inputs on daily or short-term operations or scalping. Input Values PANEL
Zoom Price It is a very useful tool that is designed to ZOOM the price positioning on one of the 4 corners of the graph. In addition to display function of the price indicator, Zoom Price is equipped with a check on Bullish or Bearish Breakout Signal that change the label color. Zoom Price is a simple tool that can provide useful informations to improve your operational performance. Input Values: myPeriod - TF to consider for Break Out O Signal LABEL SETTINGS Bullish BreakOut Color Bearish Break
Price Action DashBoard
Chantal Sala
4.17 (6)
The Price Action Dashboard is an innovative tool to help the trader to control a large number of financial instruments. This tool is designed to automatically suggest signals and price conditions. The Dashboard analyzes all major Time Frame suggesting price action conditions with graphic elements. The Dashboard can suggest you the strength of the trend identifying directional movement, it is an indispensable tool for those who want to open position themselves using market trends identifiers. The
Master Trend Dashboard
Chantal Sala
4.67 (3)
Master Trend Dashboard is a new generation indicator, compact, light and efficient. Each element of this Dashboard is designed to return specific signals as: Price Action, Breakout, Net Change (performance of the instrument), algorithmic studies, correlations and statistical calculations. This tool will change your way of trading allowing you to receive important information. See the Graphic Signals to understand every single signal below: Graphic Signals Symbol name and arrow color Green = Cur
Box Chart
Chantal Sala
5 (1)
The indicator Box Chart is a very useful analysis tool that allows you to know the value of the range in points. The range is written in a label and also it is draw in a rectangle. This indicator works on multi timeframe and you can upload more indicators on same chart to analyze more time frames ranges. The analysis of the range is done following W. G. Gann school. The observation of the range on little time frame returns some good information of trend or reversal. Box Chart is a simple indicat
Navigator FX
Chantal Sala
5 (1)
The Navigator is a next-generation panel very easy to use. Apply this indicator on the chart to navigate very quickly through all the symbol and timeframes listed in input. The arrows manage the zoom and time frames. You can customize both the graphic colors and the list of symbols to display. A quick and easy tool that it will help to analyse the charts. Input Values Show_TF_Panel (true/false) it permits to show/hide panel with TF and Arrows 32 symbols COLORS AND SIZE SETTINGS BUTTON_WIDTH But
Market Pressure is a next-generation display. Its simple and intuitive graphics system allows you to receive directions very easy and fast. This indicator can give three different methods of signals: Scalping, Intraday and Multiday. The logic is based on the price action which combined on multiple time frame. It can give very high quality signals. An indispensable tool for those who want to understand the market pressure and the operating trend. The indicator is customizable for both colors for
OCO News Order Manager in an Expert Advisor to Trading News . The usability makes this tool an excellent ally for FAST operations on NEWS Time. We recommend that you try it on demo account to understand what kind of decimals using your broker to set your input values. The EA is usable on every Markets. On news time the spread could be manage from Broker, please make attention. Main functionalities Open STOP PENDINGS ORDER a number of seconds (in input) before News Time Floating of pending order
DAX Scalping Bracket
Chantal Sala
1 (1)
Dax Scalping Bracket is a new generation Expert Advisor Panel. This a very professional tool for SCALPING. The usability makes this tool an excellent ally for FAST operations of SCALPING on Index instruments and Forex market. The main feature of this EA is the ability to open multiple operations with a single click. Each position is autonomous and you can set different take profit and stop loss for each position. Special functionalities: STOP MOVE to manage your stop chasing the price BREAK EVEN
Bid Ask Level è un indicatore molto semplice ma, allo stesso tempo, molto potente. Utilizzando la logica del minimo e del massimo dei periodi precedenti è in grado di intercettare i livelli importanti di domanda e offerta. L'indicatore consente di impostare i numeri delle candele storiche per leggere livelli molto importanti nel passato e mostrarli nel grafico corrente. Puoi vedere questi livelli di potenza con linee orizzontali disegnate sul grafico. L'indicatore permette anche di caricare
Market Pressure Dashboard is a new generation utility. Its main function is to assist you and give you operational ideas optimizing your analytical work. Using this utility you could monitor a lots of financial instruments (max 28 symbols FOREX) in a very simple way. The Market Pressure indicator allows you to customize the internal list of the symbols to be monitored. The opening function and position management with this panel will be much more comfortable and navigation charts very powerful.
L'indicatore Risk Reward è uno strumento molto utile che permette di osservare in tempo reale il rischio di performance di un trade. Il suo utilizzo è molto semplice, basta trascinarlo nel grafico e vedere la percentuale di Risk Reward (es: 1:2). Abbiamo previsto anche la possibilità di allungare/ridurre le linee al fine di rispettare i livelli di prezzo importanti. Puoi cambiare i tuoi livelli cliccando direttamente sulle linee e trascinando il livello in una nuova posizione. I livelli ver
Open Line
Chantal Sala
3 (1)
The Open Line indicator is a simple indicator that tracks the opening levels of more time sessions. This version allows the user to check the opening levels using different time time frames. It is possible to add on the same chart different Open Lines to have more important horizontal levels. The colors and lines are fully customizable also for the label text. A simple indicator but very powerful to give you a proper orientation for your trading. Input Values TimeFrame (to show the open price t
Swing High Low
Chantal Sala
5 (2)
Swing High Low Pattern Recognition is a great indicator able to fix price levels and analyze the market swings. Swing High Low uses a dynamic approach of analysis that allows you to identify easily the best entry levels. The indicator using the minimum and maximum periods of the previous candles to analyze the impulsive movement and finally it sets the entry levels. The entry levels are: fast, good and best . The best is the last confirm of the swing. For a correct use we advise to wait the comp
Filtro:
Abdullah Alrihily
2151
Abdullah Alrihily 2018.11.26 05:37 
 

good indicator so far

Vitaliy Kuchanskiy
501
Vitaliy Kuchanskiy 2018.06.12 14:07 
 

very nice indicator. useful indicator for scalping to get TP positions. рекомедую.

lrimondi
1016
lrimondi 2018.05.02 13:00 
 

Useful in trending markets, useless in sideways markets.

Mikhail Repnikov
409
Mikhail Repnikov 2018.04.08 20:55 
 

L'utente non ha lasciato alcun commento sulla valutazione.

silverforexhk
54
silverforexhk 2017.05.11 15:03 
 

L'utente non ha lasciato alcun commento sulla valutazione.

rpd2
209
rpd2 2017.03.29 14:33 
 

I must thank the developers of this indicator. I am almost ashamed to say, but after spending so much money on EAs and indicators on MQL5, this is the

first indicator that is actually making me real cash consistnetly already. I don't know how to say thanks more. It changes the way I look at the charts and

my confidence in confirming other sigals. It is simple to use but I think a bit complex in its internal design.

Thanks guys. Whether you want to scalp, day trade or longer term trade this is the indicator for you.

My personal strategy is to load the indicator on mulitple instruments at the beginning of a new trading day.

Analyse the market from scalper to day trading to intermediate mode.

Then set orders buy and sell a few pips outside the buy and sell zones clearly marked by the indicator.

I set TP conservative at Target 3-4 , but manage it depending on the signal of stregth of market which the indi also shows.

Then I may add other pending orders depending on the signals that the indicator will give during the day.

I rented it for 3 months and made back the money in 1 trade on a 200$ account with 0.01 lots.

I hope everyone that buys this indicator will have good success.

There are lots of indicators for hundreds of dollars that are not worth 1 cent. I highly recommend this.....

Orteip
24
Orteip 2017.03.27 08:29 
 

L'utente non ha lasciato alcun commento sulla valutazione.

Nathan Muir
75
Nathan Muir 2017.03.26 19:47 
 

L'utente non ha lasciato alcun commento sulla valutazione.

alfapenna
39
alfapenna 2017.03.26 12:14 
 

L'utente non ha lasciato alcun commento sulla valutazione.

Marco Rossi
158
Marco Rossi 2017.03.26 10:14 
 

L'utente non ha lasciato alcun commento sulla valutazione.

Rispondi alla recensione