Guarda i video tutorial del Market su YouTube
Come acquistare un Robot di Trading o un indicatore
Esegui il tuo EA
hosting virtuale
hosting virtuale
Prova un indicatore/robot di trading prima di acquistarlo
Vuoi guadagnare nel Market?
Come presentare un prodotto per venderlo con successo
Indicatori tecnici per MetaTrader 4 - 28

Bollinger Bands Breakout Alert is a simple indicator that can notify you when the price breaks out of the Bollinger Bands. You just need to set the parameters of the Bollinger Bands and how you want to be notified.
Parameters: Indicator Name - is used for reference to know where the notifications are from Bands Period - is the period to use to calculate the Bollinger Bands Bands Shift - is the shift to use to calculate the Bollinger Bands Bands Deviation - is the deviation to use to calculate t
FREE

Wicks UpDown Target GJ
Wicks UpDown Target GJ is specialized in GJ forex pairs.
Choppy movement up and down on the opening range every day. Trading breakouts on London session and New York session is recommended.
Guideline Entry Strategy Idea:
Step 1 - Breakout Forming (Warning! Trade on London Session and New York Session) Step 2 - Breakout Starting (Take Action on your trading plan) Step 3 - Partial Close your order & set breakeven (no-risk) Step 4 - Target complete Step 5 - Don't trade
FREE

This expert is designed to work in pairs with the same indicator. https://www.mql5.com/ru/market/product/34834
The expert does not display anything on the screen and does not trade.
It only performs calculations for the indicator, this is done to save your computer resources.
Since the expert works with symbols from Market Watch, there is no way to test it in the tester.
Instructions for use:
0) Select the required symbols in the Market Watch, which will be displayed in the indicator. (Note: !!
FREE
How To Trade
Execute your trades in 3 Easy Steps!
Step 1: Trade Setup Entry Buy in Signal Arrow color DodgerBlue. Entry Sell in Signal Arrow color RED. Success Rate ≥ 75% 100:25 Step 2: Set Stop Loss Stop loss BUY ----> You can set stop loss on Line RECTANGEL color DodgerBlue. Stop loss SELL ----> You can set stop loss on Line RECTANGEL color RED. Step 3: Set Take Profit Take profit BUY on RECTANGEL color RED. Take profit SELL on RECTANGEL color DodgerBlue. Strategy SIMPLE Day trading / Swing
FREE

Perché lo stile è importante
So quanto sia fastidioso fare clic ogni volta sulle proprietà per cambiare il colore della candela, lo sfondo chiaro o scuro e inserire o rimuovere la griglia. Ecco la soluzione con un solo clic: Tre pulsanti personalizzabili per scegliere lo stile di candela che gli operatori desiderano. Un pulsante per passare dalla modalità Giorno a quella Notte. Un pulsante per mostrare o nascondere la griglia sui grafici. ***** Nelle impostazioni è possibile scegliere dove vi
FREE

Necessary for traders: tools and indicators Waves automatically calculate indicators, channel trend trading Perfect trend-wave automatic calculation channel calculation , MT4 Perfect trend-wave automatic calculation channel calculation , MT5 Local Trading copying Easy And Fast Copy , MT4 Easy And Fast Copy , MT5 Local Trading copying For DEMO Easy And Fast Copy , MT4 DEMO Easy And Fast Copy , MT5 DEMO MACD is called Convergence and Divergence Moving Average, which is developed from the double e
FREE

"Drivers Road Bands" indicator that is designed to be used in the 1H, 4H and 1D timeframes in the most ideal way. If we compare timeframes to roads and streets; main streets and highways with high traffic volume are similar to high-time timeframes in technical analysis. If you can interpret the curvilinear and linear lines drawn by this indicator on the graphic screen with your geometric perspective and develop your own buy and sell strategies; you may have the key to being a successful trader.
FREE
The purpose of this new version of the MT4 standard indicator provided in your platform is to display in a sub-window multiple timeframes of the same indicator. See the example shown in the picture below. But the display isn’t like a simple MTF indicator. This is the real display of the indicator on its timeframe. Here's the options available in the FFx indicator: Select the timeframes to be displayed (M1 to Monthly) Define the width (number of bars) for each timeframe box Alert pop up/sound/ema
FREE

Introduction to Fractal Moving Average Fractal Moving Average indicator was designed as part of Fractal Pattern Scanner. Inside Fractal Pattern Scanner, Fractal Moving Average Indicator was implemented as multiple of chart objects. With over thousands of chart object, we find that it was not the best and efficient ways to operate the indicator. It was computationally too heavy for the indicator. Hence, we decide to implement the indicator version of Fractal Moving Average indicator to benefit o
FREE

FALCON ZONES , OPORTUNIDADES EN EL MERCADO PARA COMPORAR O VENDER
Características Destacadas: Identificación de Patrones de Velas: Reconoce una amplia gama de patrones de velas, desde patrones simples hasta formaciones más complejas. Proporciona una visión completa de la psicología del mercado encapsulada en las velas. Alertas Personalizadas: Configura alertas a medida para los patrones de velas que más te interesan o que se alinean con tu estrategia. Recibe notificaciones instantáneas cuando s
FREE

Transform Your Trading with the Visual Trend Ribbon Tired of missing the big moves? Do you struggle to identify the market's true direction? The Visual Trend Ribbon is your solution. This powerful indicator cuts through the market noise, giving you a clear, visual understanding of the trend so you can trade with confidence. Instead of a single, lagging line, the Visual Trend Ribbon uses a dynamic band of multiple moving averages to show you the market's true momentum. When the ribbon expands, t
FREE

Dynamic CMF Calculation: Customize the period for the Chaikin Money Flow (CMF) to fine-tune your analysis and maximize signal precision. Intuitive Color-Coded Alerts: Instantly interpret market conditions with clear visual cues: Green Alert: Indicates the Overbought zone – signaling a potential selling opportunity. Red Alert: Indicates the Oversold zone – suggesting a potential buying opportunity. Gray Alert: Represents the Neutral zone – a signal to wait for a confirmed trend or reversal. Autom
FREE
What is Squeeze Momentum? Squeeze Momentum is an innovative technical analysis indicator popularized by John Carter in "Mastering the Trade" that detects compression periods in markets. This indicator analyzes volatility changes using a combination of Bollinger Bands and Keltner Channel. What Does It Do? Squeeze Detection : Identifies periods when Bollinger Bands move inside the Keltner Channel Momentum Measurement : Shows momentum changes through linear regression calculations Color-Coded Signa
FREE

Check it out and if you like it just enjoy it. Try various values to find the setting that best suits your trading. Upward signal if the indicator is colored lawn green and bearish signal if the indicator is gray. You can use the line itself to trailing stop when you open orders. This is just a tool. A complement. It is not a strategy. Combine it with your own analysis Just download it and try it, it's free.
FREE

Pivot levels is indicator showing 7 pivot levels. It is adjusted for major use, including: all standard time frames
choice of periods to show three popular calculation formulas (typical, median, weighted) 9 level Camarilla pivot
pivot day shift choice of properties for lines and labels choice of showing alerts when crossing pivot lines Parameters: ----------Main parameters----------- Timeframe - time frame for pivot levels
Number of periods to show - displays pivot levels for number of periods
FREE

The ' Average Bar Chart ' indicator was created to showcase the traditional Heiken Ashi calculation as an exotic charting style. This indicator is known for reducing chart noise for a smoother price action. A dditional indicators are recommended
Key Features Candlesticks for OHLC are removed from the chart. Average bars may be shown as complete bars without tails. All functionality and features of this exotic chart are inputs.
Input Parameters Chart Timeframe = PERIOD_CURRENT; - period to set
FREE
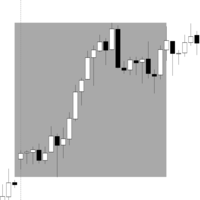
Range Box Indicator for Trading Sessions This indicator allows traders to visualize and analyze specific time ranges directly on their chart by drawing rectangular boxes for each trading session. Key Features: Customizable session interval: set your own session start and end times. Number of days displayed: choose how many past sessions are visible. Default color and special color for Monday: easily highlight weekly patterns. Adjustable border width: customize the appearance of the rectangles to
FREE

With this indicator, you can easily make price regions in all time zones. In addition, with the automatic supply demand finder, you can ensure that the new regions are found automatically. You can increase your transaction quality by reaching more accurate operations with this auxiliary Tool and indicator.
I share your trial version of EURUSD for free with you. If you want to buy the working version in all parities, you can contact me. +New version Gap Bar Add ( Press G keyboard ) Default con
FREE

The indicator rely on The Toby strategy >> The mother candle which is bigger in range than the previous six candles.
A vertical line shows the last Toby Candle with the targets shown up and down. The strategy is about the closing price out of the range of the toby candle to reach the 3 targets..The most probable to be hit is target1 so ensure reserving your profits and managing your stop lose.
FREE

The principle of this indicator is very simple: detecting the candlestick pattern in H1 timeframe, then monitoring the return point of graph by using the pullback of High-Low of H1 Candlestick and finally predicting BUY and SELL signal with arrows, alerts and notifications. The parameters are fixed and automatically calculated on each time frame. Example:
If you install indicator on XAUUSD, timeframe H1: the indicator will detect the reversal, pullback, price action on this timeframe (for exam
FREE

After purchasing the Tpx Dash Supply Demand indicator, you must download this indicator which will link and feed market data to the Tpx Dash Supply Demand indicator and will provide all Supply Demand price signals, ATR Stop, VAH and VAL, trend values with the ADX, and POC prices and locations in the market. Just download it and Dash will locate the indicator to retrieve the information!
FREE
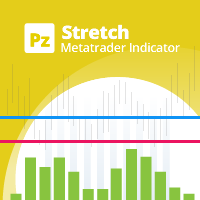
The Stretch is a Toby Crabel price pattern which represents the minimum average price movement/deviation from the open price during a period of time, and is used to calculate two breakout levels for every single trading day. It is calculated by taking the 10 period SMA of the absolute difference between the open and either the high or low, whichever difference is smaller. This value is used to calculate breakout thresholds for the current trading session, which are displayed in the indicator as
FREE

This indicator helps you to Scan symbols which are in the Market Watch Window and filter out trends with alerts. It works based on the effective indicator "SUPERTREND" which is used by many traders for trading: When box color changes to " Green " or " Red " color, it indicates you for trend change for long and short entry. And also you will get alerted on screen. When it changes to " Green ", it indicates you that trend is going upwards, and you can take the long entry. If the color changes to
FREE
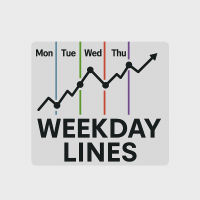
Boost your technical analysis with our Weekday Lines Indicator — a powerful yet lightweight tool designed for traders who want to clearly visualize daily market structure.
Key Features: Auto Draws Vertical Lines for each trading day: Monday through Friday
Customizable Colors & Styles to match your chart theme
Day Labels (Mon, Tue, etc.) appear next to lines for easy tracking
Works in All Timeframes — especially useful in intraday and swing trading
No Lag, No Clutter – just clean, prec
FREE
WHAT IS NEXT MOVE? SIMPLE ANSWER IS, THIS PROGRAM IS BASED ON PRICE ACTION THEREFORE FINDING NEXT MOVE IS EASY TO IDENTIFY THIS PROGRAM IS USING STANDARD CALCULATIONS FOR SUPPORT RESISTANCE IN SHAPE OF 2 WAYS TREND LINES SELECT HORIZONTAL LINES TREND LINES WILL GUIDE TRADERS TO TRADE IN RANGE WITH PIVOT LEVEL ALSO HORIZONTAL LINES GUIDE YOU ABOUT SUPPORT RESISTANCE OF DIFFERENT TIMEFRAMES FOR EXAMPLE: IF TRADER INTERESTED TO TRADE IN 15 MINUTES TIME FRAME, THEN HE CAN SELECT 15 MINUTES IN PR
FREE
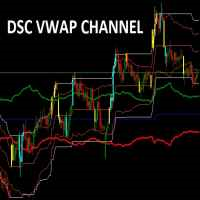
Corretora recomendada para usar esse indicador: https://tinyurl.com/5ftaha7c
Indicador usado para sabermos os pontos de suporte de resistência no gráfico. Funciona em todos ativos e timeframes.
Acerte exatamente os pontos de entradas e saídas das suas operações. SEE OUR RESULTS ON INSTAGRAM: https://www.instagram.com/diogo.cansi/ TELEGRAM GROUP = https://t.me/robosdsc More information by email dscinvestimentos@gmail.com or by Whatsapp 55-991372299
FREE

AIS MT4 INDICATOR 5 ALL INCLLUSIVE SET
!!!!!!!!!!!!!!!!!!!!!!!!!!!!!!!!!!!!!!!!!!!!!!!!!!!!!!!!!!!
!
! ATTENTION ! LIMITATION OF FREE OFFER PERIOD IS IMPLICIT !
!
! CONFIRMATION 2024-08-20 20:00 !
!
!!!!!!!!!!!!!!!!!!!!!!!!!!!!!!!!!!!!!!!!!!!!!!!!!!!!!!!!!!!
GUIDE
CHAPTER 1 IMPORTANT INFORMATION <1> THIS INDICATOR IS ONE OF THE SERIES OF NEW AIS INDICATORS AIS MT4 INDICATOR 1 =ADVANCED CLASSIC= AIS MT4 INDICATOR 2 =MULTIFRAMES= AIS MT4 INDICATOR 3 =LINES= AIS M
FREE

PLEASE HELP REVIEW/ SUPPORT/ SHARE THIS OTHER INDICATOR HERE https://www.mql5.com/en/market/product/51637 AS YOU DOWNLOAD THIS ONE FOR FREE. THANKS.
This Indicator is based on four moving averages and the PIVOT points. The indicator provides clarity to trading, especially in ranging markets when price is very slow and tight. You can trade intensively daily, every day with this indicator. You may decide to trade with this indicator alone and get the maximum out of the market. The indicator wa
FREE

Volume Oscilator is a popular indicator available in trading view which is very popular among traders Definition The Volume Oscillator is an indicator made up of two Moving Averages (MA) surrounding volume, one being fast and the other slow. The slow volume MA value is then subtracted from the value of the fastlow Moving Average. The Volume Oscillator measures volume by analyzing the relationship between the two Moving Averages mentioned. When combined with other indicators it provides a very st
FREE

The principle of this indicator is very simple: detecting the candlestick pattern in M30 timeframe, then monitoring the return point of graph by using the pullback of High-Low of M5 Candlestick and finally predicting BUY and SELL signal with arrows, alerts and notifications. The parameters are fixed and automatically calculated on each time frame. Example:
If you install indicator on XAUUSD, timeframe M5: the indicator will detect the reversal, pullback, price action on this timeframe (for exa
FREE
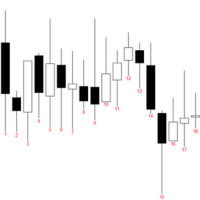
indicator that numbers the bars (candles) in a custom trading session.
The indicator allows: Defining the session start time (StartHour and StartMinute) Displaying numbers only on odd bars (if AfficherUniquementImpairs is true) Displaying numbers on the last N days (NbJours) Customizing the color and font size of the text The indicator will loop through the bars of the last N days and, for each day, start counting from the session start time.
It will display the bar number (starting at 1) belo
FREE

Overview:
The Coloured Parabolic SAR Indicator is a visually enhanced trading tool designed to make trend-following and trade identification easier. This customizable indicator provides clear visual cues with color-coded signals for bullish (buy) and bearish (sell) trends directly on your MT4 chart. Key Features: Color-Coded Signals : Lime green "o" symbol for Buy signals. Red "o" symbol for Sell signals. Customizable Inputs : Adjustable Step and Maximum parameters to fine-tune the Parabolic SA
FREE

Indicator : Forex Reversal Trend The indicator helps investors to identify the earliest and perfect reversal point. Easy to make decision to trade with the trend Price action trading. support resistance and market trends. By technical analysis, the robot creates a short-term strategy to determine the most optimal entry position. Version PRO: https://www.mql5.com/en/market/product/70867 Telegram: https://t.me/tForexSniper
FREE

“Gold Miner Robot” is a very powerful AI-Based robot designed and built to accurately analyze the market and trade on gold. Developed by “Keyvan Systems” after more than 3 years of research and development on each tick of the gold chart. "Gold Miner Robot" uses a complex algorithmic approach based on price analysis, trend analysis. We have also provided two other personalized indicators called "GoldMinerRobot SI 1" and "GoldMinerRobot SI 2" for better market analysis, which you can download free
FREE

DTFX Algo Zones are auto-generated Fibonacci Retracements based on market structure shifts.
These retracement levels are intended to be used as support and resistance levels to look for price to bounce off of to confirm direction.
USAGE Figure 1 Due to the retracement levels only being generated from identified market structure shifts, the retracements are confined to only draw from areas considered more important due to the technical Break of Structure (BOS) or Change of Character (CHo

Retracement Reversal and Support and Resistance Pro is based on a formula used by Proprietary trading firms and other big institutions on WallStreet including on my Company and used by my traders here in the capital of the world. This indicator will create Red and Green arrows on a possible mayor Retracement level, Reversal Level and future Support and Resistance levels and Yellow arrows on a possible m i nor Retracement level, Reversal Level and future Support and Resistance levels . This in
FREE
FlatBreakoutPro Multi-Symbol Flat Panel & Breakout Detector for MT4 FlatBreakoutPro is a professional tool for modern traders, designed to automatically detect and monitor flat (sideways) zones and instantly alert you to breakouts across multiple symbols and timeframes. The indicator employs transparent fractal logic, delivers accurate non-repainting signals, and ensures full visual control over the market situation. Who Is This For? Active traders focusing on breakout strategies (flat breakout,

Key Features: Type of Indicator: Line Break Chart Indicator Usage: Identifying trend reversals and potential market turning points. Input Parameters: The primary input parameter is 'Lines_Break,' which represents the number of lines the price needs to move to create a new line in the opposite direction. How it works: The indicator draws green and red histogram bars to represent the line break chart. Green bars indicate an upward trend, and red bars indicate a downward trend. The indicator calcul
FREE

The Zig-Zag based levels indicator is a highly accurate tool for Forex trading that will help you improve your strategy and make more precise decisions. It uses the Zig-Zag algorithm to identify various support and resistance levels on the market, based on which you can determine when it is best to enter or exit a trade.
This indicator has high performance and accuracy in calculating levels, which allows traders to gain maximum profits with minimal risks. Thanks to its intuitive interface, you
FREE
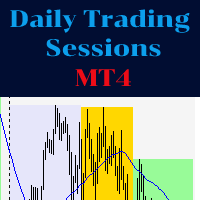
L'indicatore rappresenta i box di sessione per le sessioni Asiatica, Europea e Americana. E' possibile modificare gli orari di ogni sessione, come il colore. E' anche possibile disabilitare a piacimento la visualizzazione di ogni sessione. Trovate nei parametri di input Tab Dati in ingresso le variabili da modificare in formato hh:mm ed i colori da modificare per ogni box.
FREE

StarBody è un indicatore istogramma che rappresenta la dimensione delle candele in relazione al loro volume ed evidenzia quelle più grandi delle precedenti. La formula per il calcolo dell'altezza dell'istogramma è semplice quanto efficace: Ampiezza * Volume La grafica indicherà tutte le candele più estese delle precedenti in base alle impostazioni scelte.
L'indicatore può essere utile, a volte indispensabile, nelle strategie che prevedono lo sfruttamento della continuazione del trend. Le strate
FREE

THE INDICATOR WITH A DOUBLE MOVING AVERAGE (MA).
Recommendations: The indicator works better if two lines are of the same color at the same time. (if one is green and the other is red, the price is in the flat zone (it's better not to do anything)).
Input parameters:
1. The period of the first and second MATCH. 2. The thickness of the line of the first and second MATCH. 3. The color of the line of the first and second MATCH.
Looking for a good broker? Then I have a good offer for you! - 4
FREE
Vertical Lines for Hour - Time-Based Trading Indicator The Vertical Lines for Hour indicator allows you to mark up to 4 vertical lines at specific times on your chart. Simply enter the hour without considering the minutes, and you can also choose the color for each line. This indicator is useful for identifying session ranges or implementing custom trading strategies. It provides a straightforward solution for your trading needs. Key Features: Mark up to 4 vertical lines at specified times. Sele
FREE

Description This scanner uses 3LZZ TRO ex4 and scans for Semafors at given “Shift” bar.
Scanner Detailed Settings: https://www.mql5.com/en/blogs/post/747456
Other Settings: Set Periods for Semafor 1,2,3 Set alerts on/off for Semafor 1,2,3 Shift bar (Bar on which semafor is scanned) Refresh After Ticks (Number of ticks when dash is refreshed) This scanner is pretty simplistic version. And a more detailed version with a different strategy is available here: https://www.mql5.com/en/market/product
FREE

MultiFiboDynamicMT4 is a powerful, professional indicator for estimating the most important support and resistance levels. The main advantage is that it plots the Fibonacci levels at all timeframes simultaneously, which allows the trader to see the full picture of the possible price movement of the trading instrument!
Advantages of the indicator The indicator is perfect for scalping and trading binary options. Suitable for beginners and experienced traders. Works on all timeframes. Works on any
FREE

The Keltner Channel indicator represents a channel along the moving average , with the width defined by calculating the average true range on the period of the moving average. This indicator can be applied for receiving signals, as well as a substitute for the Moving Average Envelopes indicator. Its advantage is the increased quality of channel width auto selection, which can be adjusted using the Size of channel in percent parameter.
Indicator Parameters Period of indicator - calculation perio
FREE
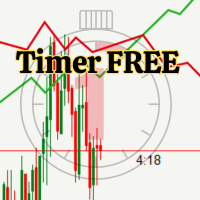
Countdown timer for candle close.
FUNCTIONS:
- Exact countdown to candle close
- It works on all timeframes (M1 to MN)
- 2 display formats
- Customizable font color and size
- Adjustable position on the chart
- Real-time update every second
IDEAL FOR:
- Scalping and day trading
- Trading with precise timing
- Practice time management in operations
- All traders who need timing control
Do you want more?
Upgrade to Timer PRO and get:
- Real-time Profit/Loss display
FREE

Se ti piace questo progetto, lascia una recensione a 5 stelle. Come le istituzioni commerciano grandi volumi, non è raro per loro cercare di
difendere la loro posizione a livelli percentuali specifici. Questi livelli serviranno come supporto naturale e resistenza che è possibile
utilizzare
o entrare in un commercio o essere a conoscenza di possibili pericoli contro la
vostra posizione. Questo oscillatore vi mostrerà la variazione percentuale per il: Giorno. Settimana. Mese. Quarto. Anno. In un
FREE

RSI Meter: il tuo centro di controllo RSI multiperiodo!
Sei stanco di passare continuamente da un grafico all'altro e da un timeframe all'altro per ottenere una visione completa dell'Indice di Forza Relativa (RSI) dell'asset che stai monitorando? Ti sfuggono importanti segnali di ipercomprato o ipervenduto che sono mascherati da altri grafici?
Presentazione dell'RSI Meter: un indicatore che fornisce una panoramica immediata dei valori RSI su più simboli e intervalli di tempo in una dashboard i
FREE

The indicator shows the Fibonaccia golden ratio levels and the price balance line Has three different sensitivity options Allows you to visually navigate what state the market is in and where trend reversals are possible Works on all timeframes, on any currency pairs, metals and cryptocurrencies Can be used when working with binary options Distinctive features Based on the golden Fibonacci value; Determines the balance line of price equilibrium Has three different sensitivity settings; Simple an
FREE

STOCHASTIC Dashboard Panel This indicator helps you to scan symbols which are in the Market Watch window and filter out a trend according to STOCHASTIC .
In technical analysis of securities trading, the stochastic oscillator is a momentum indicator that uses support and resistance levels. Dr. George Lane developed this indicator in the late 1950s.[1] The term stochastic refers to the point of a current price in relation to its price range over a period of time.[2] This method attempts to pre
FREE
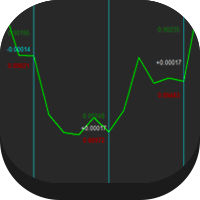
This indicator gives the highest and lowest information of the currency you have selected and the day you selected. It also shows the average. In this way, you can find out the profit / loss probability of your transactions for the same days. Reported: Average points per week Average points per year Lifetime average points Note: It does not provide you with buy / sell signals. Shows average points only
FREE

SR is a support and resistance indicator, it shows major highs and lows by different colors. The color of a level is changing if the last high or low are touching it. After the closing of a bar above or below level, it will delete it. extern inputs: loop for candles / colors / drawing time *This indicator signal is not perfect and have to be used with other market analysis and confirmations.
FREE
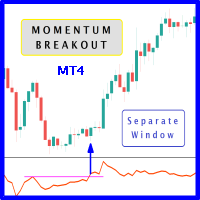
When prices breakout resistance levels are combined with momentum oscillator breaks out its historical resistance levels then probability emerges to record farther prices. It's strongly encouraged to confirm price breakout with oscillator breakout since they have comparable effects to price breaking support and resistance levels; certainly short trades will have the same perception. Concept is based on find swing levels which based on number of bars by each side to confirm peak or trough and in
FREE

L'indicatore mostra due coppie diverse su un grafico, progettate per semplificare le informazioni visualizzate,
In grado di lavorare con quasi tutti gli strumenti disponibili nel terminale (non solo coppie di valute, ma anche metalli e materie prime). Caratteristica dell'utilizzo di un metodo di correlazione visiva per qualsiasi coppia di valute Sottosimbolo. La coppia di valute viene visualizzata sullo schermo con candele colorate. Questa è la stessa coppia correlata. Mirroring
FREE

Check my paid tools they work great and I share Ea's based on them for free please r ate
The Dual Timeframe RSI (Relative Strength Index) indicator is a novel trading tool that allows traders to monitor RSI readings from two different timeframes on a single chart. This dual perspective enables traders to identify potential trend confirmations and divergences more effectively. For instance, a trader might use a 1-hour RSI alongside a daily RSI to ensure that short-term trades align with the broa
FREE

The Moving Average Slope (MAS) subtracts the moving average level n-periods ago from the current moving average level. This way, the trend of the moving average can be drawn on the moving average line.
Features Observe uptrends and downtrends at a glance. The indicator is non-repainting. Returns buffer values for the trend of the moving average to be used as part of an EA. (see below)
Inputs Moving Average Period : The period of the moving average (MA). Slope Period : Number of periods between
FREE

H I G H - P R O B A B I L I T Y - B R E A K O U T T R E N D L I N E I N D I C A T O R This is no ordinary trendline indicator. It has a highly-probability algorithms incorporated in the script to display only trendlines that may give a very high chance of price breakout. The indicator is not a stand alone indicator. Trader should interpret it together with their very own analysis technique to come up with a more efficient trading strategy. You can use with it other trend indica
FREE

Indicatore Slope Channel per MetaTrader
Stai cercando uno strumento per analizzare le tendenze di mercato adatto a qualsiasi stile di trading? Slope Channel – il tuo assistente affidabile per identificare i movimenti dei prezzi e i livelli chiave del mercato! Cos'è Slope Channel? Slope Channel è un indicatore innovativo che costruisce un canale inclinato sul grafico, calcolando automaticamente i suoi parametri in base agli estremi locali. Questo strumento evidenzia l'opzione di canale ot
FREE
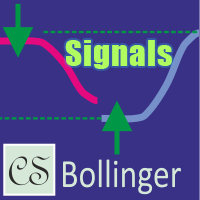
CS Bollinger is a signal indicator based on Bollinger Bands, designed for the rapid identification of key support and resistance levels with visual trading signals. Thanks to an improved level-switching logic, the indicator automatically adjusts levels on the chart, displaying signal arrows when a price reversal is confirmed. This helps traders quickly identify favorable moments for entering and exiting the market. The indicator offers flexible settings that allow it to be adapted to an individu
FREE

iCC in iMA is indicator to change color in iMA if iCCI crosses level up (up trend) or crosses level down (down trend). It is a useful tool to track when the upside and the downside iCCI on iMA.
You can to get source code from here .
Parameters MA_Periods —Period for iMA. MA_Method — Method for iMA. CCI_Periods —Period for iCCI. CCI_ApliedPrice — Price used for iCCI. CCI_LevelsUp — Level iCCI for up trend. CCI_LevelsDN — Level iCCI for down trend. BarsCount — How many bars will show the line. R
FREE

A pin bar pattern consists of one price bar, typically a candlestick price bar, which represents a sharp reversal and rejection of price. The pin bar reversal as it is sometimes called, is defined by a long tail, the tail is also referred to as a “shadow” or “wick”. The area between the open and close of the pin bar is called its “real body”, and pin bars generally have small real bodies in comparison to their long tails.
The tail of the pin bar shows the area of price that was rejected, and t
FREE

Ottimo strumento di utilità dove puoi monitorare in tempo reale il Laverage del tuo conto e lo spread del simbolo Questo saprà identificare con precisione i dati, poter sapere ad esempio se hai un conto Prop Firm, conoscere il corretto Laverage e se lo spread è manipolato, ecc.
Combinazione di leva finanziaria e indicatore di spread. Strumenti per automatizzare il controllo della leva e dello spread sul tuo conto di trading. Lavorare in tutte le azioni di broker forex. Utile per monitorare, se
FREE

Triple Exponential Moving Average Technical Indicator (TEMA) was developed by Patrick Mulloy and published in the "Technical Analysis of Stocks & Commodities" magazine. It works as the same as EMA. However, it provides smaller lags, even compared to Double EMA. Input Description: period: MA's period. Must be higher than 1. applied_price: Define the price to be applied. Use 1 of these integers. 0 -> applied_price is Close price 1 Open price 2 High price 3 Low price 4 Median price 5 Typical price
FREE

Blahtech Moving Average indicator is a multitimeframe version of the standard Moving Average indicator. It is also enhanced with customisable alerts, period breaks and other configuration options. The 50 day and 200 day moving averages are widely followed by investors and traders, with breaks above and below the MA lines considered to be signals of interest. Links [ Install | Update | Training | All Products ]
Feature Highlights Up to three timeframes Configurable calculation variabl
FREE

Il comportamento di diverse coppie di valute è interconnesso. L'indicatore Visual Correlation consente di visualizzare diversi strumenti su 1 grafico mantenendo la scala. È possibile definire una correlazione positiva, negativa o nessuna correlazione.
Alcuni strumenti iniziano a muoversi prima di altri. Tali momenti possono essere determinati sovrapponendo grafici.
Per visualizzare uno strumento su un grafico, devi inserire il suo nome nel campo Simbolo. Version for MT5 https://www.mql5.com/
FREE
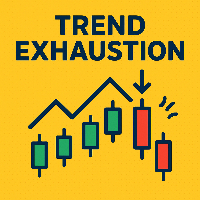
%R TREND EXHAUSTION INDICATOR - USER GUIDE The indicator displays three Williams %R lines (Fast, Slow, Average) in the range from 0 to -100 and generates visual signals when extreme zones are reached.
INDICATOR ZONES Overbought zone: above -20 Middle zone: from -20 to -80 Oversold zone: below -80 TRADING SIGNALS ARROW UP (blue) - MAIN BUY SIGNAL Appears when both lines (Fast and Slow) simultaneously exit the oversold zone. Indicates upward trend reversal, exh

Highly configurable CCI indicator. Features: Highly customizable alert functions (at levels, crosses, direction changes via email, push, sound, popup) Multi timeframe ability Color customization (at levels, crosses, direction changes) Linear interpolation and histogram mode options Works on strategy tester in multi timeframe mode (at weekend without ticks also) Adjustable Levels Parameters:
CCI Timeframe: You can set the current or a higher timeframes for CCI . CCI Bar Shift: you can set
FREE

the AK CAP toolbox free to use;
it includes the same indicators we use for our daily trading and we think the simpler the better. Lightweight indicator for use on all timeframes. that includes VWAP with vwap value indicator on top right. 3 EMA: FAST, MEDIUM, SLOW the candle timer to show how much time left in a candle.
colors and positions are fully customizable.
enjoy
FREE

Quante volte ti è capitato di aver bisogno di avere a grafico i livelli chiave di una candela chiusa del time frame precedente? Con PastProjection potrai far disegnare i livelli di Apertura, Chiusura, Massimo e Minimo della candela chiusa al time frame superiore scelto. I livelli sono spesso importanti e diventano supporti o resistenze, o entrambi. La prima volta che vengono raggiunti spesso fanno reagire la quotazione. I pattern su questi livelli sono spesso più efficaci. Tali livelli sono sign
FREE
Il MetaTrader Market è il posto migliore per vendere robot di trading e indicatori tecnici.
Basta solo sviluppare un'applicazione per la piattaforma MetaTrader con un design accattivante e una buona descrizione. Ti spiegheremo come pubblicare il tuo prodotto sul Market per metterlo a disposizione di milioni di utenti MetaTrader.
Ti stai perdendo delle opportunità di trading:
- App di trading gratuite
- Oltre 8.000 segnali per il copy trading
- Notizie economiche per esplorare i mercati finanziari
Registrazione
Accedi
Se non hai un account, registrati
Consenti l'uso dei cookie per accedere al sito MQL5.com.
Abilita le impostazioni necessarie nel browser, altrimenti non sarà possibile accedere.