
What the Numbers in the Expert Testing Report Mean

Introduction
Any expert can be tested on history data. After the expert has been tested, the summarized expert testing results and some key characteristics are displayed in the "Report" tab. Reports allow comparing to each other both various experts and the working results of the same expert with different inputs working. This article explains how to read such reports and to interpret the obtained results properly.
Exemplary Report about Testing Results
Let us study the following report about testing results as an example:
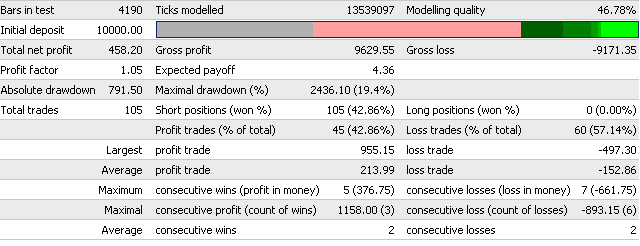
'Bars in test' field displays the depth of the history on which the modeling was based.
'Ticks modelled' field displays the size of the modeled sequence. Every record of the sequence represents the bar state (OHLCV) at one or another moment. Different bar states can be modeled depending on the timeframe, modeling method, and presence of history data from smaller timeframes within a bar.
'Modelling quality' is calculated according to the following formula:
ModellingQuality = ((0.25*(StartGen-StartBar) +
                     0.5*(StartGenM1-StartGen) +
                     0.9*(HistoryTotal-StartGenM1)) / (HistoryTotal-StartBar))*100%;
where:
HistoryTotal - the total amount of bars in history;
StartBar - the number of bar with which the testing was started. Modeling starts at at least 101st bar or the bar corresponding with the initial date of test limits;
StartGen - the number of bar with which the modeling on the nearest timeframe started;
StartGenM1 - the number of bar with which the modeling on minutes started;
at that:
the distance between the beginning of modeling of databases for the nearest timeframe and the beginning of modeling on the nearest timeframe data has a weighting factor of 0.25;
the distance between the beginning of modeling on the nearest timeframe data and the beginning of modeling on minutes has a weighting factor of 0.5;
the distance between the beginning of modeling on minutes and the end of history data has a weighting factor of 0.9;
Gross profit, the summed up profit for all profitable transactions;
Gross loss, the summed up loss for all unprofitable trasnactions;
Total net profit, shows the difference between gross profit and gross loss:
TotalNetProfit = GrossProfit - GrossLoss
Profit factor, shows the ratio between gross profit and gross loss:
ProfitFactor = GrossProfit / GrossLoss
Expected payoff, to be calculated as follows:
Expected Payoff = (ProfitTrades / TotalTrades) * (GrossProfit / ProfitTrades) -
                  (LossTrades / TotalTrades) * (GrossLoss / LossTrades)
where:
TotalTrades - total amount of trades;
ProfitTrades - the amount of profitable transactions;
LossTrades - the amount of losing transactions;
GrossProfit - the summed up profit;
GrossLoss - the summed up loss.
Absolute drawdown is the difference between the initial deposit and the smalles value of balance within testing:
AbsoluteDrawDown = InitialDeposit - MinimalBalance
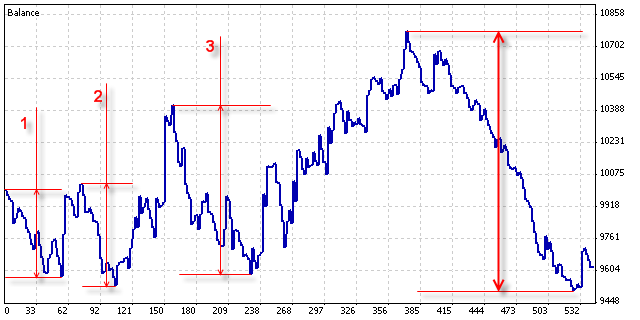
Maximal drawdown is the highest difference between one of local upper extremums of the balance graph and the following lower extremums:
MaximalDrawDown = Max of (Maximal Peak - next Minimal Peak)
The basic stages of changing the maximal drawdown value within testing are given in the picture below. The total maximal drawdown value is in the thick arrows.
The maximal drawdown percentage shows the ratio between the maximal drawdown and the value of respective local upper extremum:
MaxDrawDown % = MaxDrawDown / its MaxPeak * 100%
Other results shown in the "Report" tab are obtained using the simplest mathematical calculations.
Total trades - total amount of trades made by the expert within testing;
Short positions (won %) - total amount of short positions and the precentage of profitable ones among them (profitable short positions / total amount of short positions * 100%);
Long positions (won %) - total amount of long positions and the precentage of profitable ones among them (profitable long positions / total amount of long positions * 100%);
Profit trades (% of total) - total amount of profitable transactions and percentage of the total amount of transactions (ProfitTrades / TotalTrades * 100%);
Loss trades (% of total) - total amount of losing transactions and percentage of the total amount of transactions (LossTrades / TotalTrades * 100%);
Largest profit trade - the largest profitable trade among profitable trades;
Largest loss trade - the largest losing trade among losing trades;
Average profit trade - averaged size of profit trades (GrossProfit / ProfitTrades);
Average loss trade - averaged size of loss among losing trades (GrossLoss / LossTrades);
Maximum consecutive wins (profit in money) - maximum consecutive amount of wins among profitable series of trades and the summed up profit within this series;
Maximum consecutive losses (loss in money) - maximum consecutive amount of losses among losing series of trades and the summed up loss within this series;
Maximal consecutive profit (count of wins) - maximum profit of a consecutive series of profitable trades and the amount of trades in this series;
Maximal consecutive loss (count of losses) - maximum loss of a consecutive series of losing trades and the amount of trades in this series;
Average consecutive wins - averaged amount of trades in consecutive profitable series.
Average consecutive losses - averaged amount of trades in consecutive losing series.
Colors used for modeling quality diagram
The following colors are used in the color diagram:
Lime - modeling on minutes, marked with 7 in the picture below.
Deeper green colors show modeling on large timeframes, from M5 to H4.
Pink color - pure fractal modeling without data of a smaller timeframe, marked with 2 in the picture.
Gray color - modeling limitation by date, marked with 1 in the picture.
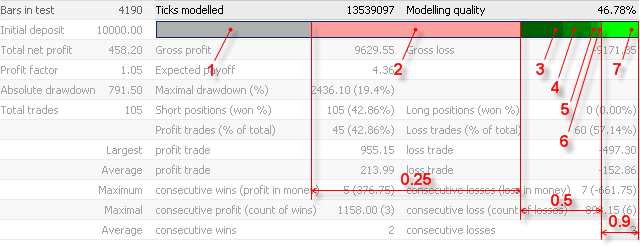
The color diagram in the above picture is drawn according to the following initial data of the modeling quality calculation:
Bars in test = 4190;
StartBar = 2371;
StartGen (H4) = 3042 (marked with 3 in the above picture);
Start H1 = 3355 (marked with 4);
Start M30 = 3841 (marked with 5);
Start M15 = 3891 (marked with 6);
Start M5 = 0 (no marking in the picture since data on minutes started earlier);
Start M1 = 3917.
Having substituted these values into the formula of modeling quality calculation, obtain:
((0.25*(3042-2371) + 0.5*(3917-3042) + 0.9*(4190-3917)) / (4190-2371))*100% =
((0.25*671 + 0.5*875 + 0.9*273) / 1819)*100%                                = 46.78%
Translated from Russian by MetaQuotes Ltd.
Original article: https://www.mql5.com/ru/articles/1486
Warning: All rights to these materials are reserved by MetaQuotes Ltd. Copying or reprinting of these materials in whole or in part is prohibited.

 Expert Advisor Sample
 Testing Features and Limits in MetaTrader 4
 Requirements Applicable to Articles Offered for Publishing at MQL4.com
 Strategy Tester: Modes of Modeling during Testing
- Free trading apps
- Over 8,000 signals for copying
- Economic news for exploring financial markets
You agree to website policy and terms of use
Hi:
The following sentence is not true "Maximal drawdown is the highest difference between one of local upper extremums of the balance graph and the following lower extremums:"
In my case, the maximal drawdown is calculated based on equity graph, and not based on balance graph.
You can find the correct definition in MetaTrader 4 Help: https://www.metatrader4.com/en/trading-platform/help/autotrading/tester/tester_results
Why people write articles with misinformation?
AOR
Hi,
Drawdown (%) = 100% * (former Balance - later Balance) / (former Balance)
where former Balance > later Balance
Therefore, Maximal Drawdown can be determined when (later Balance / former Balance)~0
nice article. Thank you!
Which is more important...Relative Drawdown or Maximal Drawdown?
An interesting article, but it's worth noting that:
"Ticks modelled" field:
"Modelling quality" calculation:
"Absolute drawdown" vs. "Maximal drawdown":
"Expected Payoff":
"Colors used for modeling quality diagram":
Thank you !