
Testing Expert Advisors on Non-Standard Time Frames

Introduction
The market price fluctuates way too frequently to conveniently use the price change chart, the so-called tick chart, in technical analysis. To facilitate the perception of price changes and allow for use of longer time frames when analyzing, we use bar or candlestick charts. Each bar demonstrates the price value as at the start and end of a certain period of time, as well as the maximum and minimum price value over that period. It is customary to use the following periods or time frames: 1 Minute, 5 Minutes, 15 Minutes, 30 Minutes, 1 Hour, 4 Hours, Daily, Weekly and Monthly. These time frames can be found in the MetaTrader 4 terminal toolbar.
Despite the commonly used time frames that have already become standard, there is technically no reason why we cannot use any other time frame to display price changes. From a practical standpoint, the terminal provides a script (period_converter) which allows terminal users to create non-standard time frame charts, e.g. 2 Minutes, 7 Minutes, 45 Minutes, 2 Hours and basically any other time frame, as well as to attach indicators thereto. However, the terminal's Strategy Tester allows you to select only standard periods for testing.
So near and yet so far - we can create a non-standard time frame chart, yet there is no way to use it for testing Expert Advisors. In fact, the situation is much better than it appears. Testing Expert Advisors on non-standard time frames is possible! All we need to do is to replace standard time frame data with non-standard time frame data. Furthermore, we can even test Expert Advisors that use data from several non-standard time frames.
Main Points
Our action plan is as follows:
1. Prepare an additional terminal to work off-line so that new standard time frame data is not added to non-standard time frame charts.
2. Prepare non-standard time frame data using the period_converter script in the terminal that has sufficient minute data archive available.
3. Import prepared data to the terminal ready for testing.
Let's now have a closer look:
1. Prepare the Terminal for Testing on Non-standard Time Frames.
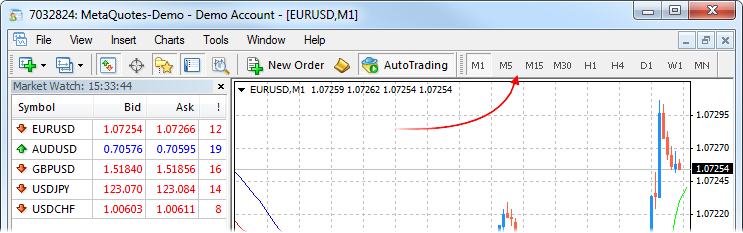
Install an additional terminal. Launch the terminal, open a demo account and wait until the list of symbols appears in the Market Watch window:
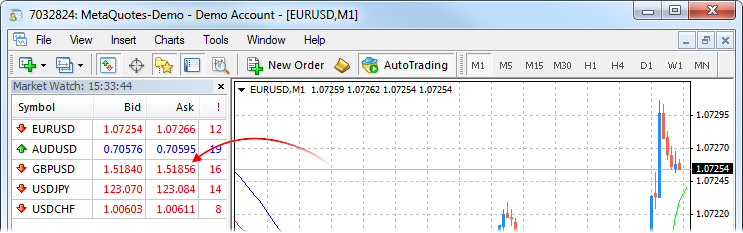
Disable saving account information: left-click on the Connection Status icon in the bottom right corner of the terminal and select Login. Uncheck the "Save account information" option, click Login and wait for the terminal to connect to the account.
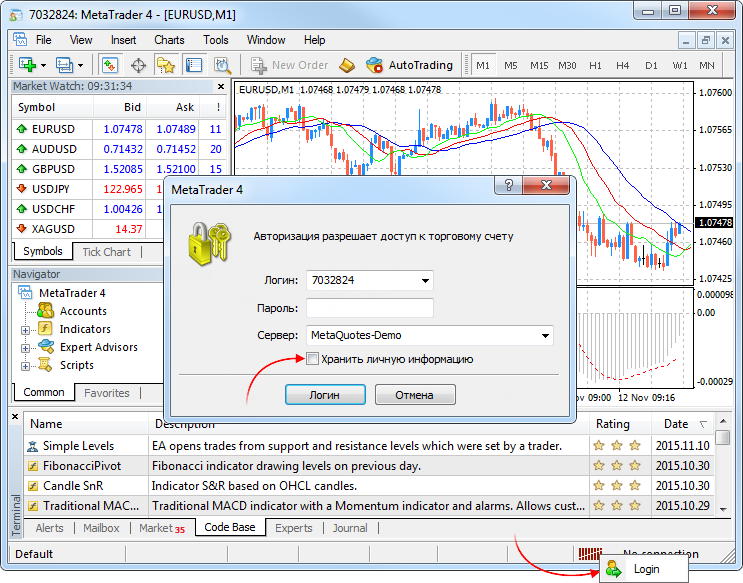
This is necessary in order for the terminal not to connect to the account automatically and prevent new data from being added to the history archive. Shut down the terminal.
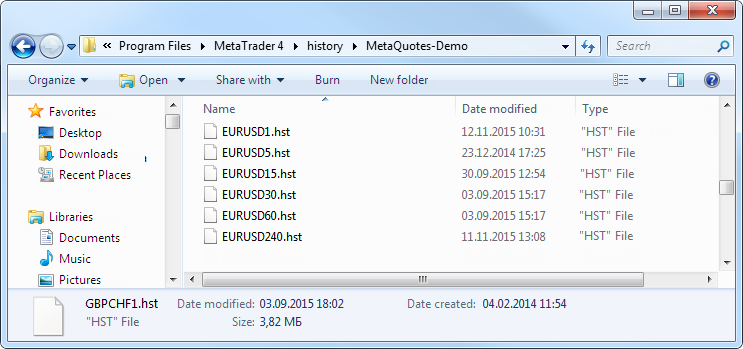
In the history folder, open a folder whose name corresponds to the name of the dealing center with which the demo account was opened and delete from it all *.hst files.
2. Prepare Non-standard Time Frame Data.
Using the period_converter script (available in the standard MetaTrader 4 terminal delivery), create non-standard time frames, e.g. M2 and M7, in some other terminal that has sufficient amount of M1 data for the required symbol, e.g. EURUSD. For this purpose, open the EURUSD M1 chart and run the period_converter script on it. Before running the script, set ExtPeriodMultiplier to 2 in the properties window. Once the script has finished converting data, a message on the number of entries made to the file should appear in the "Expert Advisors" tab of the Terminal window, e.g.:
"2009.03.19 18:28:09 period_converter EURUSD,M1: 25378 record(s) written"
The script can afterwards be removed from the chart (right-click on the chart where the script was running and select "Remove Script"). Open the resulting chart: Main Menu - File - Open Offline (look for EURUSD,M2 in the History Data column). Similarly, create M7 time frame (set ExtPeriodMultiplier to 7 before running the period_converter script).
Write a script to save the chart data to a *.csv file (s_ExportChartToCSV_v1.mq4 attached):
int start(){
   int h=FileOpen(Symbol()+Period()+".csv",FILE_WRITE|FILE_CSV,",");
      for(int i=Bars-1;i>=0;i--){
         FileWrite(h,TimeToStr(Time[i],TIME_DATE),TimeToStr(Time[i],TIME_MINUTES),Open[i],High[i],Low[i],Close[i],Volume[i]);
      }
   FileClose(i);
   return(0);
}
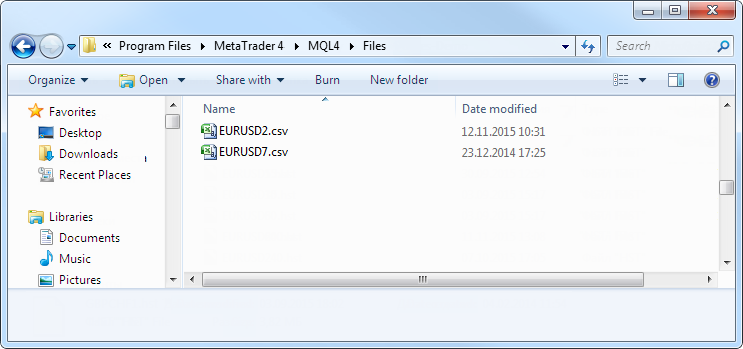
Execute the script on the non-standard time frame charts. As a result, we get standard *.csv files with non-standard time frame data in the experts/files folder.
3. Import Data.
Open the terminal prepared in 1. above and the History Center (Main Menu - Tools - History Center or F2 key). Expand the list of time frames for the imported symbol in the left hand-side symbol list and select М1 (double-click on it for the corresponding text to appear in the window title bar):
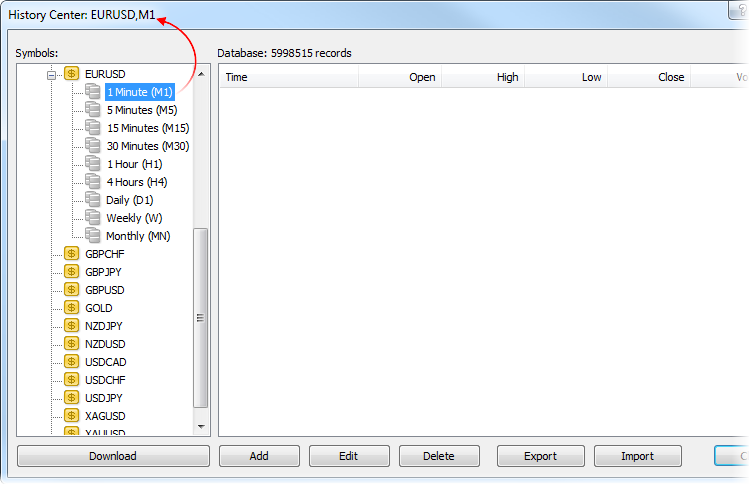
Click "Import" in the opened History Center window, select EURUSD2.csv generated in 2. above and click "OK". Similarly, import data from EURUSD7.csv to M5 and close the History Center window. That's it!
Open the EURUSD M1 chart and you will be able to see M2 data:
The same applies to EURUSD M5 - instead of M5, you will see M7 data displayed.
To test an Expert Advisor in the Strategy Tester, you will need to select M1 for testing on M2 data and M5 for testing on M7 data. To access M7 data in indicators called from a tested Expert Advisor, you need to specify M5 time frame.
4. Checking.
We will use a simple Expert Advisor that opens and closes orders at the intersection of two MAs (2MA.mq4 attached). Attention! This Expert Advisor is intended for operation in the Strategy Tester only.
extern int TimeFrame=0;
extern double Lots=0.1;
extern int FastMAPeriod=13;
extern int FastMAMethod=0;
extern int FastMAPrice=0;
extern int SlowMAPeriod=21;
extern int SlowMAMethod=0;
extern int SlowMAPrice=0;

int start(){
      double fast_ma_1=iMA(NULL,TimeFrame,FastMAPeriod,0,FastMAMethod,FastMAPrice,1);
      double slow_ma_1=iMA(NULL,TimeFrame,SlowMAPeriod,0,SlowMAMethod,SlowMAPrice,1);
      double fast_ma_2=iMA(NULL,TimeFrame,FastMAPeriod,0,FastMAMethod,FastMAPrice,2);
      double slow_ma_2=iMA(NULL,TimeFrame,SlowMAPeriod,0,SlowMAMethod,SlowMAPrice,2);
      static int bt=0;
      static int st=0;
         if(fast_ma_1>slow_ma_1){
            if(fast_ma_2<=slow_ma_2){
               if(st>0)OrderClose(st,Lots,Ask,0,CLR_NONE);
               st=0;
               if(OrdersTotal()==0)bt=OrderSend(Symbol(),OP_BUY,Lots,Ask,0,0,0,"",0,0,CLR_NONE);
            }
         }
         if(fast_ma_1<slow_ma_1){
            if(fast_ma_2>=slow_ma_2){
               if(bt>0)OrderClose(bt,Lots,Bid,0,CLR_NONE);
               bt=0;
               if(OrdersTotal()==0)st=OrderSend(Symbol(),OP_SELL,Lots,Bid,0,0,0,"",0,0,CLR_NONE);
            }
         }
   return(0);
}
4.1. Expert Advisor on a Single Non-standard Time Frame.
Open the Strategy Tester (Main Menu - View - Strategy Tester or Ctrl+R). Select the Expert Advisor - 2MA, symbol - EURUSD, time frame - M1, open the Expert Advisor properties window ("Expert properties" button in the Strategy Tester) and set the TimeFrame variable value to 1 or 0. Start testing and once it has been completed, open the chart ("Open chart" button in the Strategy Tester) to make sure that testing has been done correctly.
4.2. Expert Advisor on a Single Time Frame Different from the Strategy Tester's Time Frame.
In the Expert Advisor properties window, set the TimeFrame variable equal to 5 and start testing. Open the chart, change the chart time frame to М5 and set two simple MAs with periods of 13 and 21 based on closing prices to make sure that testing has been done correctly.
4.3. Two Time Frame Expert Advisor.
The Expert Advisor we are going to use opens orders at the intersection of two MAs on one time frame, confirmed by the position of two MAs on a longer time frame (2MA2TF.mq4 attached). Attention! This Expert Advisor is intended for operation in the Strategy Tester only.3
int start(){
      double fast_ma_1=iMA(NULL,TimeFrame,FastMAPeriod,0,FastMAMethod,FastMAPrice,1);
      double slow_ma_1=iMA(NULL,TimeFrame,SlowMAPeriod,0,SlowMAMethod,SlowMAPrice,1);
      double fast_ma_2=iMA(NULL,TimeFrame,FastMAPeriod,0,FastMAMethod,FastMAPrice,2);
      double slow_ma_2=iMA(NULL,TimeFrame,SlowMAPeriod,0,SlowMAMethod,SlowMAPrice,2);

      double _fast_ma_1=iMA(NULL,MA2TimeFrame,FastMAPeriod,0,FastMAMethod,FastMAPrice,1);
      double _slow_ma_1=iMA(NULL,MA2TimeFrame,SlowMAPeriod,0,SlowMAMethod,SlowMAPrice,1);

      static int bt=0;
      static int st=0;
         if(fast_ma_1>slow_ma_1){
            if(fast_ma_2<=slow_ma_2){
               if(_fast_ma_1>_slow_ma_1){
                  if(st>0)OrderClose(st,Lots,Ask,0,CLR_NONE);
                  st=0;
                  if(OrdersTotal()==0)bt=OrderSend(Symbol(),OP_BUY,Lots,Ask,0,0,0,"",0,0,CLR_NONE);
               }
            }
         }
         if(fast_ma_1<slow_ma_1){
            if(fast_ma_2>=slow_ma_2){
               if(_fast_ma_1<_slow_ma_1){
                  if(bt>0)OrderClose(bt,Lots,Bid,0,CLR_NONE);
                  bt=0;
                  if(OrdersTotal()==0)st=OrderSend(Symbol(),OP_SELL,Lots,Bid,0,0,0,"",0,0,CLR_NONE);
               }
            }
         }
   return(0);
}
The following values are set by default: TimeFrame - 1, MA2TimeFrame - 5. Select M1 time frame in the Strategy Tester and start testing. Then open the chart and use the vertical lines at the points of order opening and points of intersection of MAs that did not result in order opening, while switching from M1 to M5, to make sure that testing has been done correctly.
Conclusion
These simple manipulations broaden horizons of Expert Advisor testing! The only downside is the lack of automatic updates. Repeated from time to time, e.g. once a week, actions described in items 1 to 3: deleting all data from the terminal for testing purposes, as well as export and import of non-standard time frames to the terminal to do testing, are seen as the work of a moment for the sake of such a great enhancement of Strategy Tester's capabilities.
Warning: All rights to these materials are reserved by MetaQuotes Ltd. Copying or reprinting of these materials in whole or in part is prohibited.
This article was written by a user of the site and reflects their personal views. MetaQuotes Ltd is not responsible for the accuracy of the information presented, nor for any consequences resulting from the use of the solutions, strategies or recommendations described.

 MQL5 Market Results for Q2 2013
 Reading RSS News Feeds by Means of MQL4
- Free trading apps
- Over 8,000 signals for copying
- Economic news for exploring financial markets
You agree to website policy and terms of use
Terrific Article. Can you advise if you know why the modelling quality isn't very good when you run this script and run a back test with the data? I have created a csv file for 8HR data from a 1MIN chart. I run the strategy tester on the 1MIN setting (which contains the 8HR candle data) and the modelling quality comes back at 25% for each test.
Thanks for your help!
Scott
Hi.
Has anyone actually tested EA on Non-standart Timeframes with success??
I`m trying to test my EA on weekly and 12h chart, but getting bunch of mismatch chart errors. I substituted Daily chart data with weekly/12 h chart data and run on tick mode test (Daily).
Its ok if use only Open price mode only and if you don't need to look inside the bar, but thats realy not an option for me.
Anyone tested EA on weekly or other non-standard time frame and managed to see ticks inside the bar? (real ticks not fake ones ST generates)
Thanks