
Testing (Optimization) Technique and Some Criteria for Selection of the Expert Advisor Parameters

Introduction
It is apparently no big secret that selection of adequate parameters is not a tiny bit less important than selection of trading tactics and creation of an Expert Advisor. Proof of this can be found in ongoing discussions of the subject on numerous forums in one way or another related to automated trading. And while automation of trading operations appears to be quite clear and transparent, I haven't come across any somewhat usable automated algorithm for processing of optimization results compiled in a logically complete chain.
And we have to admit that the process is very hard and time-consuming thus deserving an effort to, at the very least, automate all transactions to the maximum and reduce them to one single algorithm. This approach and method will be set out below in this article.
Concept
Task. Analysis and screening of the Expert Advisor parameters received during the optimization that are knowingly non-effective for a real trade. Maximum use of the Terminal performance capabilities and automation of manual operations.
The whole process consists of several stages. Such a division does not have so much to do with the complexity of implementation of a continuous automatic algorithm, as with inability to early, at the optimization stage, define the necessary requirements (tolerances and filters) to the parameters of the system. And generally speaking, there is no need in that.
In my opinion, making a machine take strategic decisions is not "the best idea". And selection of parameters (parameter groups) is a strategy. Calculating, trading, making our life easier - these are its functions but it is the trader who decides on the operating rules the hardware should follow.
Every stage and transitions in-between the stages have been automated to the maximum, for as much as it was practicable.
Stage 1. Optimization. Standard variant with optional user settings.
Again, this is not a secret but it cannot be left out.
Genetics is by all means a useful thing but within reasonable limits. The truth is that its algorithm may play a low-down trick with you - when a set of parameters it sees as profitable has been found, the whole optimization process will from there on until the end be running "around it". I believe you understand what it may lead to. Most of the really good variants that would otherwise work beyond the optimization area will be left out and will not be registered in the "Optimization Results" table.
There are a few ways out of the situation. A drastic one is not to use the Genetic Algorithm for optimization. This is however not always suitable, for one reason or another. The next two are half-measures, but better than nothing:
- to run the optimization not just once but twice or even more times. The first time, say, by "Balance" and the next time by "Maximal Drawdown" or by other parameters. The "Optimised Parameter" window in the "Testing" tab of the Expert Advisor properties provides for such selection. Afterwards, combine the received tables of results and work with a combined table.
- to maximally reduce the number of parameter combinations.
There is yet another nuance to be taken into consideration when implementing the optimization. Someone may find it useful.
One can set various limits in the "Optimization" tab of the Expert Advisor properties and I would like to say a few words about one of them - "Maximal Drawdown". When using this parameter, bear in mind that this is a current balance drawdown in percent. What needs to be taken into account here. If, for instance, we set a 10% limit and take an initial balance of 10000, then over the optimization process when the balance reaches at least 15000, the initial 1000 will become 1500 - clearly, these are different figures. And the initial deposit (who can guarantee that such drawdown would not occur at the very beginning of the trade?) will react differently to them. If one sets an initial deposit of 1000000 and a 0,1% limit, this thousand will remain about а thousand.
Stage 2. Working with "Optimization Results". All results are copied into Excel and processed there. There will be many sets and they should be reduced. The "cutting" can be performed on any column of the report - it's up to the trader.
Stage 3. Test. We select a part of the history for testing and run an automatic group test of the sets that "made it through" the previous stage screening. I point out: a group test. At this stage there is no need to consider every single test separately, the point is to get the test results of all the remaining sets at once. The Terminal will actually implement the same optimization but it will use the parameters from a pre-created file.
Similar to stage 2, all received results are copied into the same Excel table containing the optimization results.
Stage 4. Analysis and Screening.
Obviously, negative tests are ruthlessly discarded (lines deleted). The question is how to evaluate the remaining ones?
Many of you must have noticed that visual perception of the balance chart gives an equal and sometimes an even better idea of the system characteristics rather than the figures in the report. As a rule, if the curve looks "good", the figures in the report are also "fine", if however it lacks a continuous growing trend, then no figure can be convincing enough that this is "good".
The problem is that there are quite a few remaining variants and it is very hard to test them separately in order to analyse the report and have a look at the chart of every one of them... If one gets stubborn, though, then...
In order to avoid this problem and reduce the number of sets even further, I made up a "ratio" criterion applicable to compared areas. Three values are compared: Profit per Day, Number of Deals per Day and Maximal Drawdown, respectively, in optimization and testing areas. If they are roughly, within a certain tolerable limit, consistent with each other, the set remains in work, if they are not - it is excluded from further analysis. Besides, under certain conditions, more specifically - if testing areas are not very long, the three above values may, to some extent, produce an idea of a "smooth" balance curve.
Stages 3 and 4 can and should be repeated several times in different parts of the history, firstly, in order to verify the reliability of the selected results and secondly, to maximally reduce them in number. The remaining 3-5 variants will be quite sufficient for informed final choice.
Completion of stages 3 and 4 includes generation of set-files out of the remaining sets, implementation of individual tests in any parts of the history, comparison between them, selection, etc.
Basically, this is a matter of qualification, tastes and preferences of every trader and is beyond the scope of this article.
Technique
There is nothing difficult and mind-bending here, all you need is attention and precision. Let's start.
1. Computer Configuration - Control Panel/Regional and Language Options/Regional Options/Russian - Customise/Numbers/Decimal Symbol - instead of a "comma" you need to select a "point" - this is done for accurate data reflection upon copying of the (test) optimization results from the Terminal into an Excel table;
- You should have Microsoft Office (Excel required) installed on your computer - version 2000 and up.
- Macros should be enabled in Excel security settings and Analise.bas module (attached to the article) should be imported. The review of the module and its structure is not provided in this article since there is no need for ordinary users to change or edit anything in it, and "unordinary" users will, if desired, figure it out by themselves.
2. Expert Advisor Preparation
An example of the prepared Expert Advisor is available in the attachment.
At the very beginning of the code the following should be inserted before the external parameters:
// Test and optimization parameters
extern int          VarOptimTest    = 0;       // 0 - standard optimization (normal operation of the Expert Advisor)
                                                                     // 1 - test run of the selected sets
                                                                     // 2 - generation of set-files
extern int          Counter              = 1;       // counter
extern string       nameEA          = "MA";  // Expert Advisor name
These variables will control the optimization and test modes.
init() function should look as follows:
int init()
{
   // BLOCK OF THE OPTImizaTION AND TESTING FUNCTION CALL
   if(IsOptimization() && VarOptimTest !=0)
      {
      if (VarOptimTest == 1 && Counter !=0) _ReadParametrs();
      if (VarOptimTest == 2 && Counter !=0)
         {_ReadParametrs(); _WriteSet();}
      }
...........
...........
return (0);
}
Two functions will be called from here ensuring the automation of the whole process.
The following line is added to the start() function:
int start()
{
   if(IsOptimization() && VarOptimTest ==2) return(0);
..........
1. Parameter reading function to read an Excel file created after the analysis of the (testing) optimization results.
The variable part of the function is in bold. It is necessary to accurately and carefully, following the same structure and syntax, list all input parameters of the Expert Advisor except for the first three that are responsible for optimization and testing as well as bool- and string-type variables, if any.
void  _ReadParametrs()
{
   string FileName="test.csv";
   int handle=FileOpen(FileName,FILE_READ||FILE_CSV);//,'');
   if(handle<1) return(0);
   FileSeek(handle,0,SEEK_SET);
   int str = StrToInteger(FileReadString(handle));
   int data = StrToInteger(FileReadString(handle));
   if (data < Counter)
      {
      Alert("Incorrect number of test runs entered. Sorry");
      return(0);
      }
   for (int y=1; y <=Counter; y++)
      {
      for (int x=1; x <= str; x++)
         {
         string s = FileReadString(handle);
         string ds = FileReadString(handle);
         if (y != Counter) continue;
         s=StringTrimLeft(s);s=StringTrimRight(s);
         ds = StringTrimLeft(ds);ds=StringTrimRight(ds);
         double d = StrToDouble(ds);

         if (s == "Lots"){Lots=d;continue;}
         if (s == "MaximumRisk"){MaximumRisk=d;continue;}
         if (s == "DecreaseFactor"){DecreaseFactor=d;continue;}
         if (s == "MovingPeriod"){MovingPeriod=d;continue;}
         if (s == "MovingShift"){MovingShift=d;continue;}

         }
      }
   FileClose(handle);
  return(0);
}
2. Set-file generation and writing function. Its structure should mirror the Expert Advisor set-file structure. The variable part of the function is in bold.
void  _WriteSet ()
{
   string FileName=nameEA+"_"+Symbol()+Period()+"_"+Counter+".set";
   int handle=FileOpen(FileName,FILE_WRITE|FILE_CSV);
   if(handle<1) return(0);

   FileWrite(handle,"VarOptimTest="+0);
   FileWrite(handle,"VarOptimTest,F="+0);
   FileWrite(handle,"VarOptimTest,1="+0);
   FileWrite(handle,"VarOptimTest,2="+0);
   FileWrite(handle,"VarOptimTest,3="+0);

   FileWrite(handle,"Counter="+0);
   FileWrite(handle,"Counter,F="+0);
   FileWrite(handle,"Counter,1="+1);
   FileWrite(handle,"Counter,2="+1);
   FileWrite(handle,"Counter,3="+100);

   FileWrite(handle,"nameEA="+nameEA+"_"+Symbol()+Period()+"_"+Counter);

   FileWrite(handle,"Lots="+Lots);
   FileWrite(handle,"Lots,F="+0);
   FileWrite(handle,"Lots,1="+0.00000000);
   FileWrite(handle,"Lots,2="+0.00000000);
   FileWrite(handle,"Lots,3="+0.00000000);

   .................................

   FileWrite(handle,"MovingShift="+MovingShift);
   FileWrite(handle,"MovingShift,F="+1);
   FileWrite(handle,"MovingShift,1="+2);
   FileWrite(handle,"MovingShift,2="+1);
   FileWrite(handle,"MovingShift,3="+4);

   FileClose(handle);
return(0);
}
3. Process
ATTENTION! I strongly recommend that you duplicate the worksheet or the whole workbook before you perform any operation. Running macros in Excel is an irreversible operation and in case of an error the optimization results can be lost which means loss of time. There will be no harm in saving the interim results from time to time.
3.1. Optimization
There is enough information devoted to peculiarities of the optimization, now let's see how it can be done. Optimization and testing parameters in the Expert Advisor properties should be set as shown in the screenshot:

Fig.1 Expert Advisor Properties, "Input Parameters" Tab. Optimization and Testing Parameters
3.2. Analysis of Optimization Results and Initial Parameter Screening
Upon completion of the optimization the results should be copied to the clipboard:

Fig.2 Copying of the Optimization Results
start Excel and paste the copied data into a new worksheet.
After copying you should run Optim_1 macro. If everything has been done correctly, the worksheet will be similar to this:

Fig.3 Running the Excel Macro
When running the macro, you will need to enter the number of days in the optimization period into the dialog box. This is required for calculation of the additional criteria.

Fig.4 Dialog Box for Entry of the Number of Days
As you can see, there are no column names in the resulting table. This is done for a reason. First, it makes it easier to avoid mistakes when entering the number of parameters (required later on), second, there is no special need in them. Everything is familiar here except for two columns - blue and green. From left to right: Pass Number, Profit, Profit per Day, Total Deals, Deals per Day, Profit Factor, Expected Payoff, Drawdown in $, Drawdown in %.
When the table only contains the parameters selected for further work (i.e. unwanted rows have been deleted), we proceed to the next step.
In order to facilitate sorting there is a whole group of macros in the module allowing for sorting by individual columns. Assign hotkeys and ....
3.3. Saving Parameters to a File
You should run "Write" macro, and enter the path where the parameter file will be saved (.... terminal\tester\files\) in the pop-up dialog box
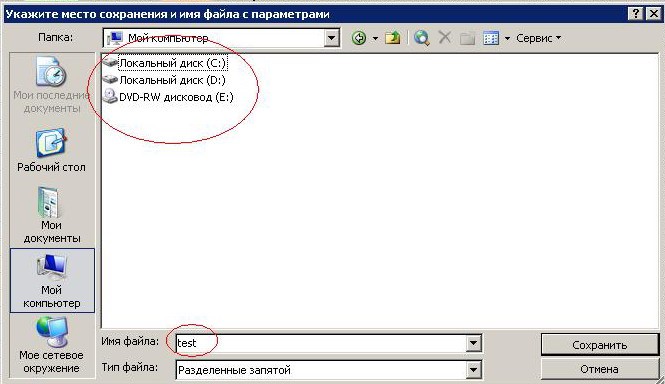
Fig.5 Dialog Box for Saving the Parameter File
The "File Name" window will have a predefined name "test", please do not change it unless it is absolutely necessary but if you do, you will have to do the same in the functions that have been added to your Expert Advisor.
Upon completion of this operation the "test.csv" file will appear (or will be overwritten if existed before) in the specified directory.
Attention, this is important. After creation of the file do not change the row positions in the table otherwise the test results will no longer be bound to the parameters used in testing.
3.4. Testing
Expert Advisor settings:


Fig.6-8 Expert Advisor Settings for the Group Test Implementation
Explanations, I suppose, if at all required, are minor: No set limits, Genetic Algorithm disabled, Counter variable set from 1 to N, where N is a number of rows remaining in the table, Optimization enabled by this parameter only.
And another setting:

Fig.9 Settings of the "Optimization Results" Tab
Now if the testing period and other essential optimization parameters are set, you can click the "Start" button and run the Strategy Tester in the "Optimization" mode.
Upon completion of testing which can take quite a long time especially at the first run when the table is still big, we can proceed to the next step.
3.5. Working with the Test Results
First of all, the Excel table should be prepared for the new data entry and for this purpose we run "Optim_2" macro as a result of which 7 empty columns will appear at the left side of the table. Received results should be sorted by the pass number in ascending order:

Fig. 10 Sorting of the Test Results
The results should afterwards be copied (as in step 2) and pasted into a new Excel worksheet followed by copying of the first 7 columns and pasting of the same into the area previously prepared in the worksheet with our table.
Now run a sequence of "Optim_3" and "Optim_4" macros. If everything has been done correctly, the table will get the following structure:

Fig.11 Structure of the Table After Saving and Processing of the Optimization and Testing Results
We have already discussed columns L-T, columns D-K are similar to columns М-T but their data refers to the test area.
But before we proceed to the first three columns, it should apparently be explained why such criteria as "Profit per Day" and "Deals per Day" were introduced.
Optimization and testing periods may be different in length. In this case a reasonable question arises: how should we compare the results? These two parameters are designed to at least partly solve this problem and facilitate the process of comparing the results.
So, columns: А = N/E (Profits per Day ratio), B = P/G (Deals per Day ratio), С =S/J (Drawdown ratio).
As can be seen, the values in these columns are currently represented by 1 - ideal variant existing only when test area in the history coincides with the optimization area. This is not an oversight but a deliberate action to demonstrate one of the ways to check whether the Expert Advisor has been prepared correctly. Similarly, one can check the correctness of creation of the set-files.
So, everything is ready for the analysis. All the information is available. Everything is in the trader's hands, he is the one who knows all the secret features of his Expert Advisor and can set necessary tolerable limits to the range of results in order to screen the parameters.
Moving on. The table has been further reduced but this is still insufficient. Nothing prevents us from running another test.
Remove columns A-K and go back to step 3.
Following the implementation of 3-4 tests we will have the table consisting of 3-5-8 rows. This is enough so we go further.
3.6. Generation of the Set-Files.
Someone might say that there is no need in it and 5-8 sets of parameters can be processed manually. I don't mind - do so if you like. But I prefer the machine to do routine work for me. All we need is to run "Write" macro and one last time run the Strategy Tester in the "Optimization" mode with the following Expert Advisor settings:

Fig.12 Expert Advisor Settings for Generation of the Set-Files
The settings are almost identical to the ones used in the test mode, the only difference being the value of one variable and the final counter value.
Upon completion of the optimization process the Expert Advisor set-files will be generated in directory tester\files. The last figure in the name is the number of the row in our table.

Fig.13 Generated Set-Files
They can be handled as standard Expert Advisor set-files.
As a matter of fact, the subject of the article has now been exhausted.
Conclusion
The information set out above does not claim to be a discovery in the area conventionally called "Theory of Optimization".... It is a purely practical guidance, no more and no less... This is probably clear but I still find it necessary to mention it.
All that is described here is just a tool designed to maximally facilitate trader's work. Nobody would ever give a 100% guarantee that the balance curve outside the right edge of the chart will look as "good" as in the visible part of the chart.
And one more thing. Don't let the abundance of words and pictures scare you away. In fact, everything is quite simple and after you have carried out such optimization a couple of times, you will learn to do it automatically.
I have a feeling that someone may have an idea on how to make optimization and testing windows more effective.... what if :)
I wish you good luck and profits.
P.S. I never thought it would take so many words to describe a few dozen "mouse" manipulations. :)
Translated from Russian by MetaQuotes Ltd.
Original article: https://www.mql5.com/ru/articles/1347
Warning: All rights to these materials are reserved by MetaQuotes Ltd. Copying or reprinting of these materials in whole or in part is prohibited.
This article was written by a user of the site and reflects their personal views. MetaQuotes Ltd is not responsible for the accuracy of the information presented, nor for any consequences resulting from the use of the solutions, strategies or recommendations described.

 Interview with Dr. Alexander Elder: "I want to be a psychiatrist in the market"
 ATC Champions League: Interview with Boris Odintsov (ATC 2011)
 Statistical Probability Distributions in MQL5
 Dr. Tradelove or How I Stopped Worrying and Created a Self-Training Expert Advisor
- Free trading apps
- Over 8,000 signals for copying
- Economic news for exploring financial markets
You agree to website policy and terms of use
Good work!
Making out a way to analyze big amounts of testing results lead me also to excel in the end. I can underline the aspect mentioned in this article, that the picture of the balance curve tells really much. First I wrote a macro that displays the balance graph of every optimization run. Then I thought about Mathematic in trading: How to Estimate Trade Results. The correlation between the balance graph and the linear regression of the balance graph itself is a good parameter to estimate the "smoothness" of the graph without taking a look at it.
@Rider
Hi, im following your instructions and in the Optimization stage in 3.1, you didnt specify what are the start/end/step of the optimization parameters or what are optimised. and after that an image was shown that the parameters were optimise (you were copying all of them)? Im following your procedure step by step and have no idea what happened in those moments. Im using you moving average example/guide to get to know the steps.
PLease let me know if I missed anything or this is a Part 2 of something.
Your reply is really appreciated!
It is a good idea to do custom test. Creating a new variable, let the tester iterate the created variable. OnInit() reads the variable and corresponding parameters, so that the parameters can be changed freely.