
Evaluating the effectiveness of trading systems by analyzing their components

Introduction
Anyone who starts trading in financial markets very quickly realizes, that in this line of business success is only possible with a certain systematic approach. Spontaneous trading can be a matter of luck, hit-and-miss, emotional and normally doesn't help to achieve positive results and if it does, the success is brief and the consequences can be dramatic. Therefore, any analysis, whether graphic, based on indicators, or any other, is one of the key components of successful trading in financial markets. This article is to some extent a research of few simple and independent trading systems for analyzing their effectiveness and usefulness of the joint application.
Setting criteria for evaluation of the trading system's effectiveness
Usually, evaluation of the effectiveness of any trading system is a certain set of defined and specified parameters, as well as some of the resulting values of the system. Periods of indicators, Stop Loss or Take Profit sizes, or a more complex set of system's coefficients that effect the entry and exit from the market, can be used as set parameters. The resulting values in turn are net profit, drawdown, percentage of successful transactions or the average value of profit trades in the currency deposit.
Any trading system over time has its effectiveness reduced, since the nature of currency markets is constantly changing, as it becomes evident from the resulting indicators. Therefore, the set system parameters have to be changed and adjusted to the changing conditions. In this article we aim to define the concept of a complex trading system.
Complex trading system is a set of separate blocks that have their own algorithms and parameters and work in conjunction with each other. The operation of any of these blocks included in the system can be evaluated by a given set of criteria. We will consider the evaluation scheme of system's effectiveness shown in Figure 1. Complex system has three constituent blocks A, B, C and each of them has its personal operating parameters. Operation and effectiveness of this system can be evaluated by three dimensions: 1, 2, 3. Over time the market conditions, where this system trades, change, and the parameters 1-3 are changed towards unsatisfactory side, which signals that it is time to reconfigure the system. This can be done using the following methods:
- Start optimization of all nine parameters in order to adapt the system to the current market realities. This method, however, contains redundancy - why optimize all parameters, if it is possible to find out which block has started operating worse?
- Accordingly, the second method. A common set of evaluation criteria C1, C2, C3 for all three system blocks is created, which allows to evaluate and compare the operation efficiency for each of the blocks separately.
Advantages of this method:
- Redundancy avoidance. There is no need in optimization, if blocks operate smoothly.
- Monitoring system. The parameters C1-C3 can be measured after some periods of time, thereby clarifying the behavior of the system and its units together and separately at different times of the market (trading sessions, news release, etc.).
- Vulnerability analysis. It allows to determine, which blocks drag the entire system down, in order to optimize, replace or improve solely the particular block, rather than the whole system.
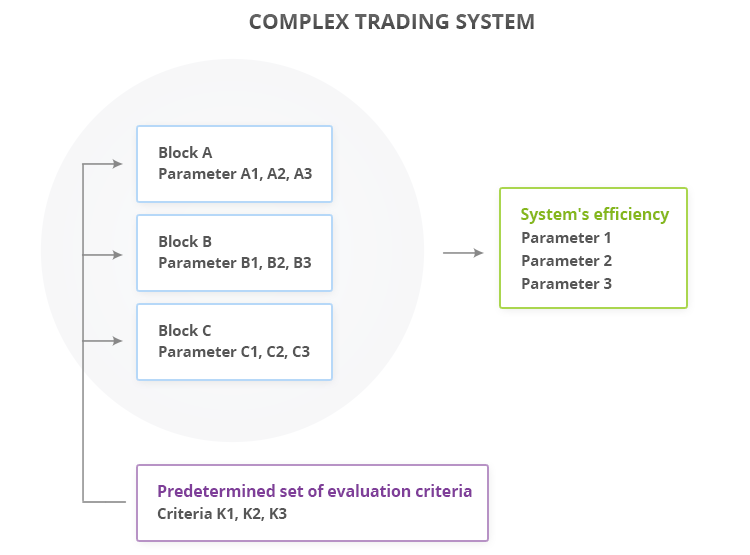
Fig.1. Complex trading system
Example of evaluating the effectiveness of trading system by analyzing its components
In order to test the efficiency of the entire trading system, we need to check how do the system blocks operate separately from each other and how they work together. The testing system will consist of two blocks:
- Block A. It is based on the signals of the standard indicator Parabolic SAR.
- Block B. It is based on the signals of the standard indicator Accelerator Oscillator (AC).
Immediately we will define a set of criteria for evaluating these blocks:
- Criteria C1 — net profit.
- Criteria C2 — maximum drawdown.
- Criteria C3 — profit trades (% of all).
For complete clarity we will choose the same indicators as the parameters of overall efficiency:
- Parameter 1 — net profit.
- Parameter 2 — maximum drawdown.
- Parameter 3 — profitable trades (% of all).
Examples of market entry signals for these indicators are located in the Docs of MQL5 Standard Library: Parabolic SAR signals and Accelerator Oscillator signals (first conditions). For each of them we will describe the entry conditions and find out the conditions under which they are effective at a predetermined interval testing.
All the parameters of the test Expert Advisor are written the following way: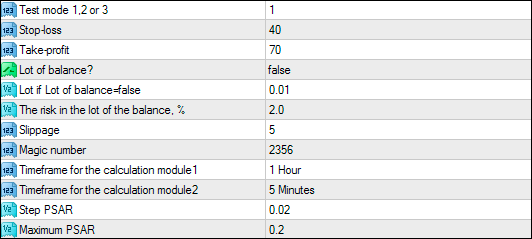
Fig.2. Parameters of Expert Advisor
//+------------------------------------------------------------------+
//|                                                                  |
//|                                                Alexander Fedosov |
//|                           https://www.mql5.com/ru/users/alex2356 |
//+------------------------------------------------------------------+
#property copyright "Alexander Fedosov"
#property link      "https://www.mql5.com/ru/users/alex2356"
#property version   "1.00"
#property strict

#include "trading.mqh"

input int            tm = 1;                       //Test mode 1,2 or 3
input int            SL = 40;                      //Stop-loss
input int            TP = 70;                      //Take-profit
input bool           lot_const = false;            //Lot of balance?
input double         lt=0.01;                      //Lot if Lot of balance=false
input double         Risk=2;                       //The risk in the lot of the balance, %
input int            Slippage= 5;                  //Slippage
input int            magic = 2356;                 //Magic number
input ENUM_TIMEFRAMES tf1 = PERIOD_H1;             //Timeframe for the calculation module1
input ENUM_TIMEFRAMES tf2 = PERIOD_M5;             //Timeframe for the calculation module2
input double         Step = 0.02;                  //Step PSAR
input double         Mxm = 0.2;                    //Maximum PSAR

CTrading tr(magic,Slippage,lt,lot_const,Risk,5);
//+------------------------------------------------------------------+
//| Expert tick function                                             |
//+------------------------------------------------------------------+
void OnTick()
  {
   if(tm<1 || tm>3)
      return;
//--- Market entry conditions for Parabolic SAR module
   if(tm==1 && !tr.isOpened(magic))
     {
      double psar[],prc[];
      ArrayResize(psar,3);
      ArrayResize(prc,3);
      for(int i=0; i<3; i++)
        {
         psar[i]=iSAR(_Symbol,tf1,Step,Mxm,i);
         prc[i]=iClose(_Symbol,tf1,i);
        }

      if(psar[2]>prc[2] && psar[1]<prc[1] && psar[0]<prc[0])
         tr.OpnOrd(OP_BUY,lt,TP,SL);
      if(psar[2]<prc[2] && psar[1]>prc[1] && psar[0]>prc[0])
         tr.OpnOrd(OP_SELL,lt,TP,SL);

     }
//--- Market entry conditions for AC module
   if(tm==2 && !tr.isOpened(magic))
     {
      double ac[];
      ArrayResize(ac,3);
      for(int i=0; i<3; i++)
         ac[i]=iAC(Symbol(),tf2,i);

      if(ac[2]>0 && ac[1]>0 && ac[1]>ac[2])
         tr.OpnOrd(OP_BUY,lt,TP,SL);
      if(ac[2]<0 && ac[1]<0 && ac[1]<ac[2])
         tr.OpnOrd(OP_SELL,lt,TP,SL);

     }
//--- Market entry conditions when two modules operate together
   if(tm==3 && !tr.isOpened(magic))
     {
      double psar[],prc[],ac[];
      ArrayResize(psar,3);
      ArrayResize(prc,3);
      ArrayResize(ac,3);
      for(int i=0; i<3; i++)
        {
         psar[i]=iSAR(_Symbol,tf1,Step,Mxm,i);
         prc[i]=iClose(_Symbol,tf1,i);
         ac[i]=iAC(Symbol(),tf2,i);
        }
      if((psar[2]>prc[2] && psar[1]<prc[1] && psar[0]<prc[0]) || (ac[2]>0 && ac[1]>0 && ac[1]>ac[2]))
         tr.OpnOrd(OP_BUY,lt,TP,SL);
      if((psar[2]<prc[2] && psar[1]>prc[1] && psar[0]>prc[0]) || (ac[2]<0 && ac[1]<0 && ac[1]<ac[2]))
         tr.OpnOrd(OP_SELL,lt,TP,SL);

     }

  }
//+------------------------------------------------------------------+
The first parameter of EA is tm (Test mode) and it can hold values 1, 2 or 3. These values correspond to the three modes of operation:
- tm = 1. Only the market entry conditions with Parabolic SAR indicator are used. Operation mode only for A block.
- tm = 2. Only the market entry conditions with Accelerator Oscillator indicator are used. Operation mode only for B block.
- tm = 3. Joint operation of both blocks. Whole system operates.
By changing the Test Mode parameter we can discover the parameters of our interest: for А and B blocks - C1-C3, for the whole system — parameters 1-3. The following are the block's testing results on Parabolic SAR (Fig.3), AC (Fig. 4) and their joint operation (Fig. 5).

Fig.3. Testing Parabolic SAR module
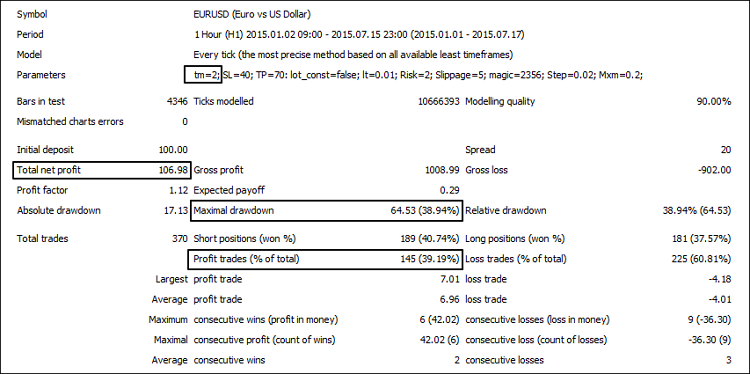
Fig.4. Testing AC modules
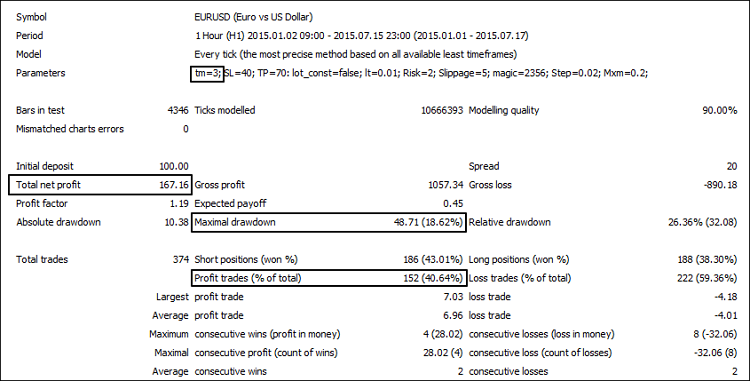
Fig.5. Joint operation of modules Parabolic SAR and AC
Based on the results of three different operating modes the comparative table will be provided for clarification purposes:
| Test Mode | Net Profit | Profit trades,% | Maximum drawdown |
|---|---|---|---|
| 1 | 27,56 | 37,91 | 32,71 |
| 2 | 106,98 | 39,19 | 38,94 |
| 3 | 167,16 | 40,64 | 18,62 |
Simulation of the system deterioration
Let's change the operational parameters of the block A (Test Mode = 1) towards the side of its efficiency reduction. This will give us the answer to the question of what will happen to the system, in case one of its blocks changes for the worse.
To simulate the decrease of the system's efficiency we will change one parameter related to the operation of block A - Timeframe for the calculation module1 - the following way as shown in Fig.6. This will change the period of its calculation based on Parabolic SAR which will affect the market entry points, and hence change the efficiency of the entire system.
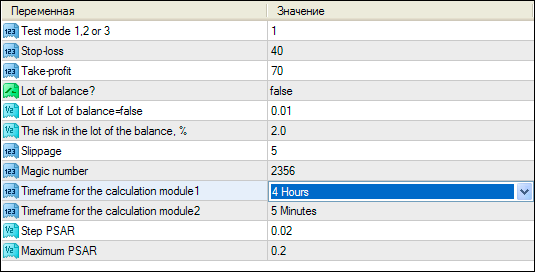
Fig.6. Simulation of decreasing the system's efficiency
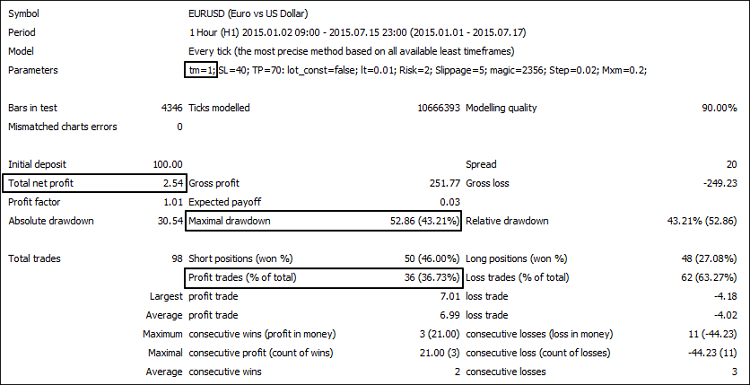
Fig.7. The result of changing the module's parameter based on Parabolic SAR
For illustrative purposes we will compare the observed performance of the block A with two different values of its parameters Timeframe for the calculation module1:
| Timeframe for the calculation module1 | Net profit | Profit trades,% | Maximum drawdown |
|---|---|---|---|
| 1 Hour | 27.56 | 37.91 | 32.71 |
| 4 Hours | 2.54 | 36.73 | 43.21 |
This is evident, that the calculation of 4-hour period gave us poorer results of the module operation for all three evaluation criteria. Testing the entire system with deliberately degraded values of one of its components has also reduced the effectiveness of the parameters 1-3, as shown in Figure 8.
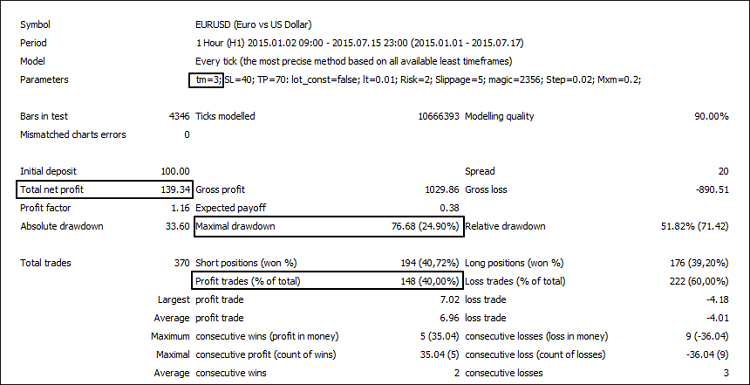
Fig.8. Joint operation of Parabolic SAR (deteriorated) and AC
Now we will put all test results together to determine how the changes in the block A have effected the overall efficiency of the system.
| Timeframe for the calculation module1 | Net profit (module 1) | Profit trades,% (module 1) |
Maximum drawdown,% (module 1) |
Net profit (system) |
Profit trades,% (system) |
Maximum drawdown,% (system) |
|---|---|---|---|---|---|---|
| 4 Hours | 2.54 | 36.73 | 43.21 | 139.34 | 40.00 | 24.9 |
| 1 Hour | 27.56 | 37.91 | 32.71 | 167.16 | 40.64 | 18.62 |
The results showed, that researching each block of the complex system separately in order to improve the efficiency has had a positive effect on the evaluation parameters of the entire system. The theses in the beginning of this article have also got confirmed that this method is less redundant than the optimization of the entire system as a single object; moreover, this method provides the additional abilities to monitor the system.
Conclusion
This article has considered the method of evaluating the effectiveness of trading systems by analyzing their components. On the basis of testing and researching the component of the block system and its modules, the following conclusions can be drawn:
- This method of evaluation is less redundant than the optimization of all system parameters by identifying only those components that are required to be optimized and improved.
- The creation of trading systems in form of the components using blocks that can be measured by set criteria, allowing to manage them better, identify weaknesses and upgrade with more flexibility.
Translated from Russian by MetaQuotes Ltd.
Original article: https://www.mql5.com/ru/articles/1924
Warning: All rights to these materials are reserved by MetaQuotes Ltd. Copying or reprinting of these materials in whole or in part is prohibited.
This article was written by a user of the site and reflects their personal views. MetaQuotes Ltd is not responsible for the accuracy of the information presented, nor for any consequences resulting from the use of the solutions, strategies or recommendations described.


 Calculator of signals
 Applying fuzzy logic in trading by means of MQL4
- Free trading apps
- Over 8,000 signals for copying
- Economic news for exploring financial markets
You agree to website policy and terms of use