Advanced Supply Demand
- Indicateurs
- Bernhard Schweigert
- Version: 7.8
- Mise à jour: 21 juillet 2025
- Activations: 5
CURRENTLY 26% OFF !!
Best Solution for any Newbie or Expert Trader!
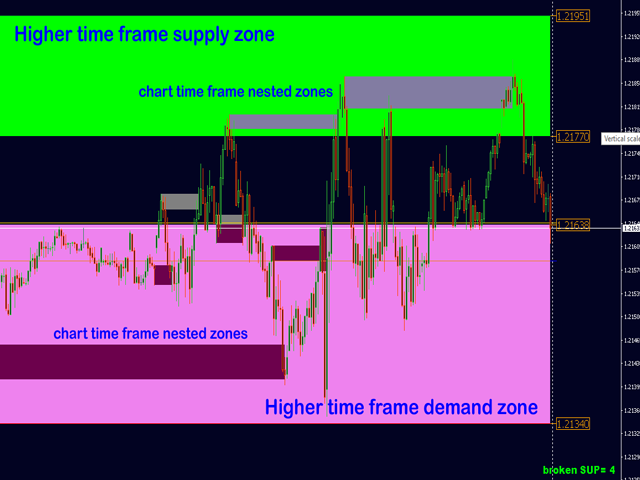
This indicator is a unique, high quality and affordable trading tool because we have incorporated a number of proprietary features and a new formula. With this update, you will be able to show double timeframe zones. You will not only be able to show a higher TF but to show both, the chart TF, PLUS the higher TF: SHOWING NESTED ZONES. All Supply Demand traders will love it. :)
Important Information RevealedMaximize the potential of Advanced Supply Demand, please visit https://www.mql5.com/en/blogs/post/720245
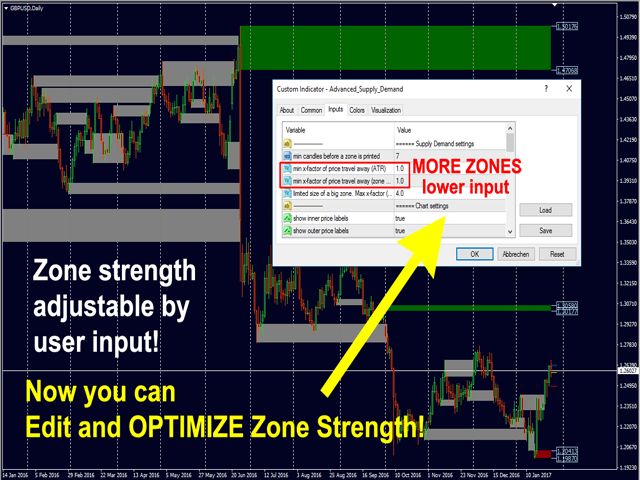
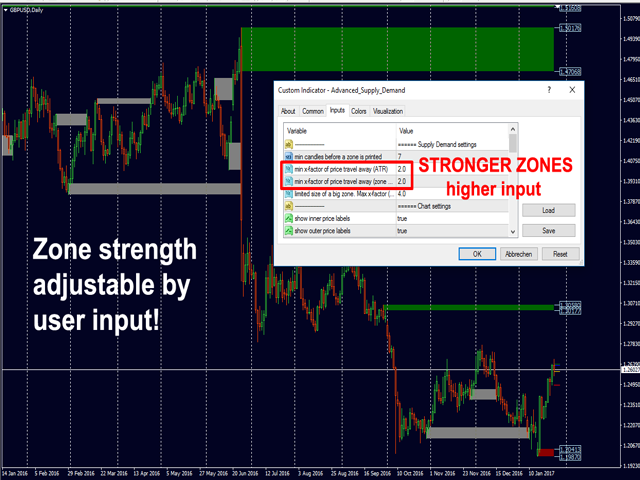
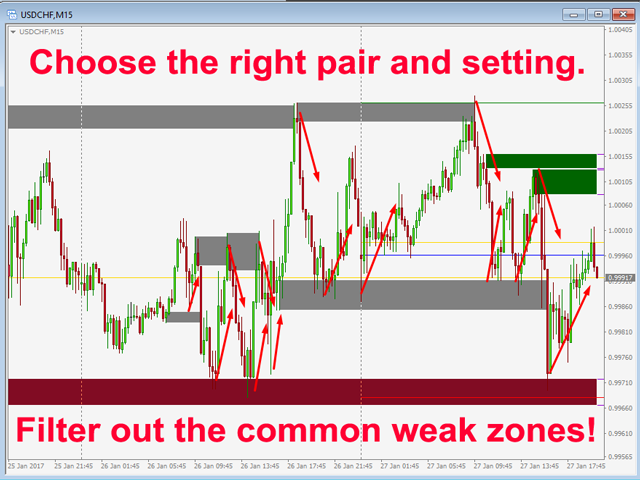
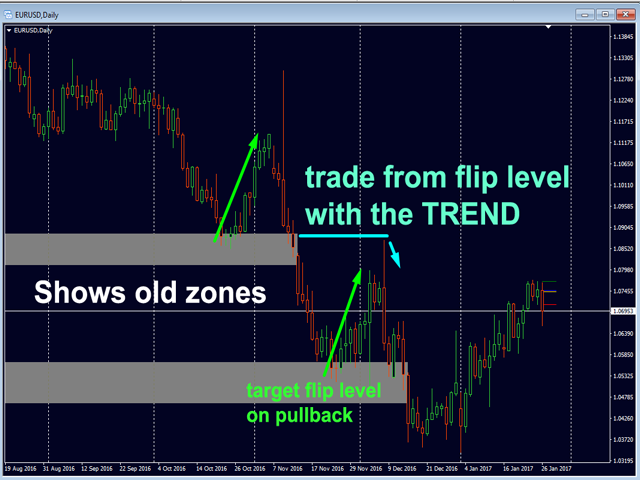
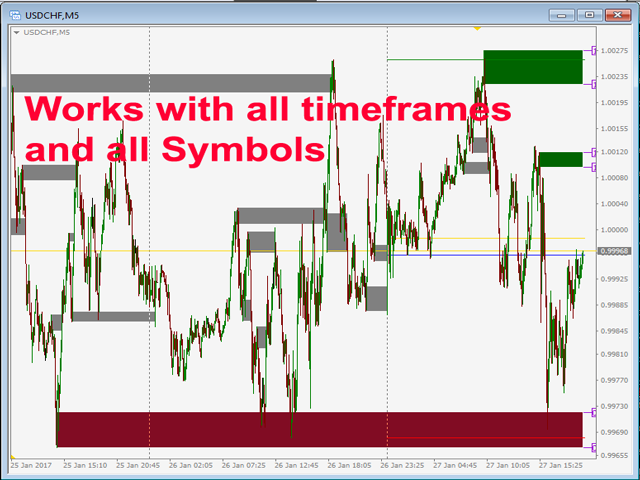
Imagine how your trading will improve because you are able to pinpoint the exact trigger point of entry or target? Built on new underlying algorithms it makes it even easier to identify potential imbalances between buyers and sellers. This is because it graphically shows the strongest supply and demand zones and how it performed in the past (showing old zones). These features were designed to help make it easier for you to find the best entry zones and levels. Now you can optimize and edit the zone strength for your symbol and timeframe!Advanced Supply Demand Indicator works on all products and timeframes. It is a new formula, and the very new features are two zone strength functions adjustable by user input! This is a great advantage in trading. When you learn how to use the proprietary features such as the zone strength with min X-factor of price travel away, you will be able to tell whether the zone is strong or not.
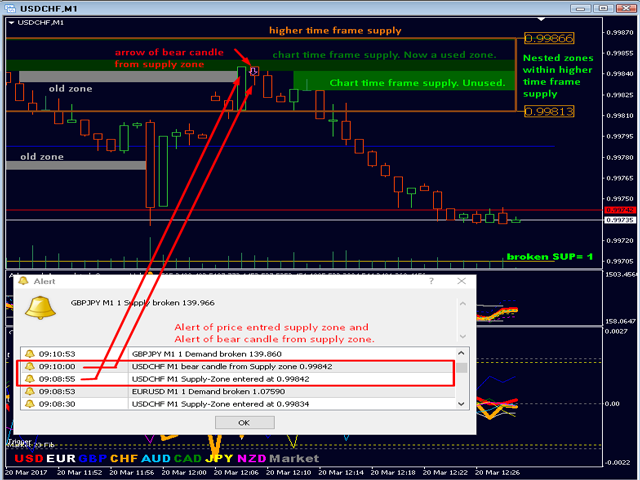
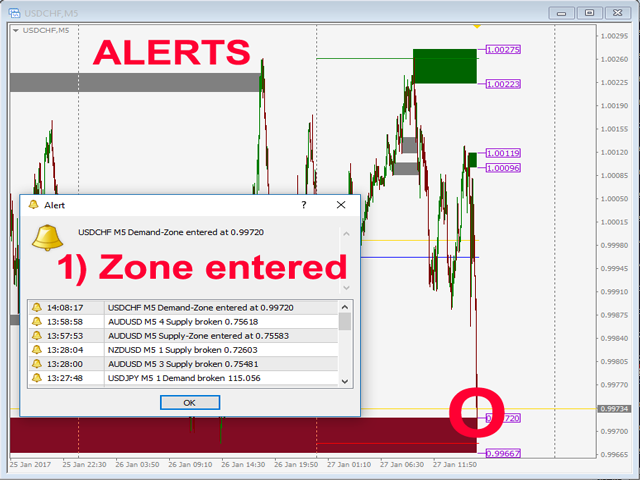
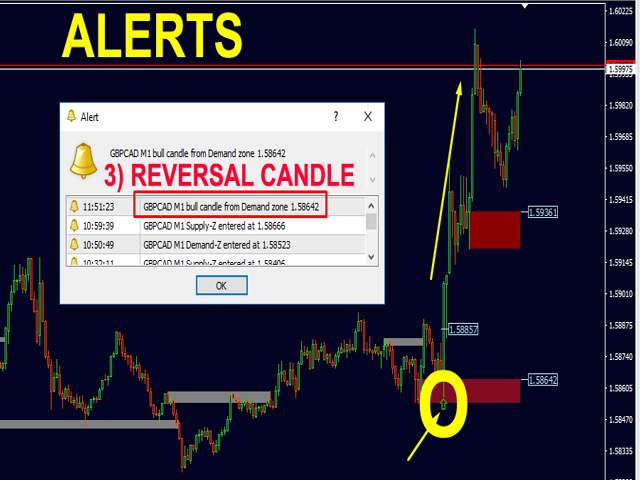
The supply and demand zones are used as an alert trigger. You have the choice of 3 alerts. If the price 1) enters the zone and/or 2) breaks the zone and/or 3) a reversal candle has formed from a zone. You can use popup alert with sound on MetaTrader 4 and/or push and/or email. When you will receive the alert you will know as a trader what to do.
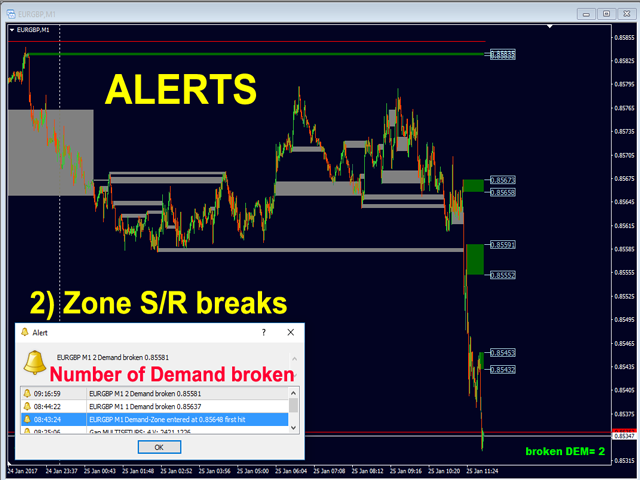
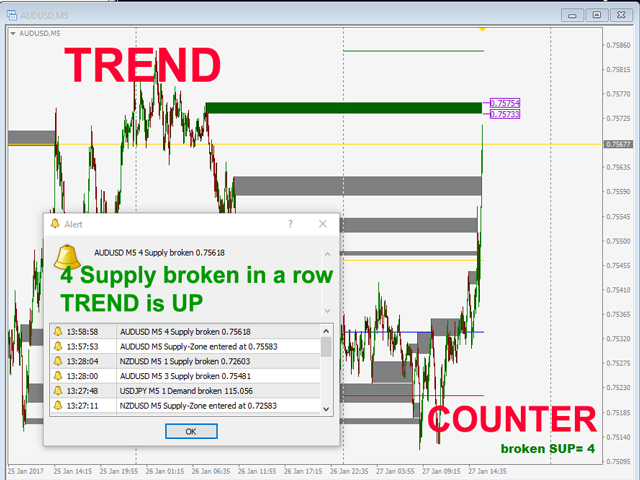
A message will tell you how many demand zones have been broken in a row, so you want to trade with the trend and look for a trend continuation.The indicator can detect nested S/D zones!
A very powerful feature! The alert will tell if a S/D zone is nested (within) a higher timeframe S/D zone! All alerts can be filtered for nested zones.
ParametersSupply Demand settings
- Min candles before a zone is printed (used for live chart).
- Min X-factor of price travel away (ATR) (The higher the number the stronger the zones). OPTIMIZE HERE FOR YOUR SYMBOL AND TIME FRAME!
- Min Y-factor of price travel away (zone size) 2nd Input: The higher the number the stronger the zones. OPTIMIZE HERE FOR YOUR SYMBOL AND TIME FRAME!
- Limited size of a big zone. Max factor (ATR) (Oversized big zones will be reduced. The higher the number the larger zones are allowed).
MTF settings
- Add higher TF
- Higher TF period (if MTF is the same or lower than chart TF, the higher one will be used)
- min HTF!-candles before a zone is printed
- min X-factor of price travel away (ATR) MTF
- min Y-factor of price travel away (zone size) MTF
- Limited size of a big zone. Max factor (ATR) MTF (Oversized big zones will be reduced. The higher the number the larger zones are allowed).
- Show inner price labels MTF
- Show outer price labels MTF
Chart settings
- Show inner price labels.
- Show outer price labels.
- Show old zones (needed for Sup/Dem counter, see below).
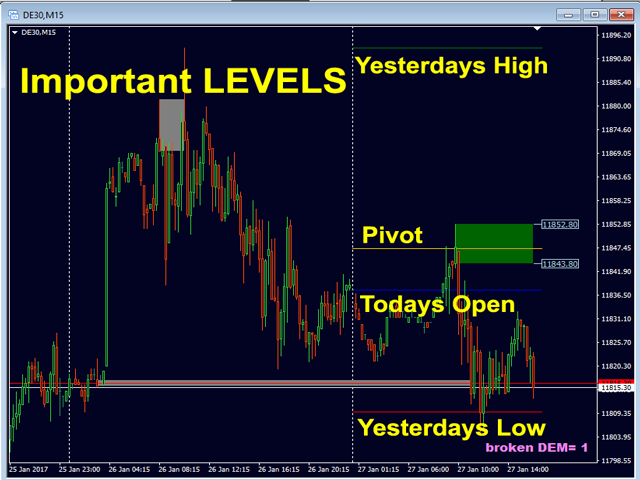
- Show yesterdays high/low
- Show todays pivot
- Show number of broken Sup/Dem in a row (counter)
- Show above in corner
- draw rectangle extended over live candle
Alert settings
- Alert zone hit
- Alert zone break
- Alert reverse candle from zone
- alert only NESTED zones! (within MTF)
- Alert Fake Breakout
- FBO min bar Size Point
- FBO bar close back % (20-90)
- FBO pattern bar count (1-3)
- Popup Alerts (MT4 popup and sound)
- Send email alerts
- Send push alerts
Color settings
- You know how to use it. Each zone has its own color.
To see the full list click here.
Other settings
- use PIN (to use for an EA)
- Show max number of supply zones
- Show max number of demand zones
- To see the full list click here.
Tips
- User Manual: Click Here.
- Use my template (See comments).
- Optimize Zone Strength for your symbol and timeframe.
- Stay within the trend. The indicator is mostly used with one of my other specialized indicators of currency strength.
- Check my news and blogs on profile for trading system and trade examples.
I will always help you if you have any questions.
Best regards, Bernhard


At first, I was disappointed after renting this indicator. It didn’t meet my expectations right away, and I questioned its value. But after spending time exploring its features and optimizing the settings especially for gold trading I realized how powerful it truly is.
Now, I can confidently say this is one of the most reliable and robust tools in my arsenal. The zone detection is precise, the alerts are timely, and the nested zone feature adds serious depth to my analysis. What amazed me most is how some trades barely even float ,they go straight into profit. That level of accuracy is rare and incredibly valuable.
This indicator has become a core part of my strategy. It’s absolutely super for supply/demand-based trading. Highly recommended for serious traders willing to invest time in understanding how it works