SFT Trend Striker MTF
- Indicadores
-
Artem Kuzmin
 ALL PRODUCTS ▶️ https://www.mql5.com/ru/users/zombiezorrofx/seller
🔥 Maximum commission discounts:
💠 Binance 35% (trading bypassing sanctions) - Versión: 1.0
- Activaciones: 5
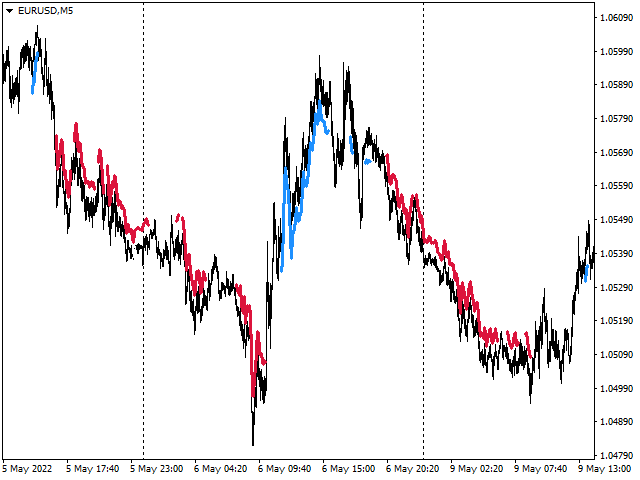
Indicador de tendencia de señal de marco temporal múltiple.
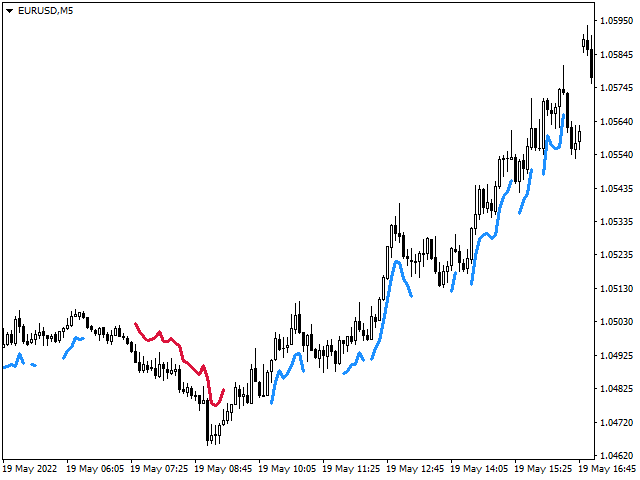
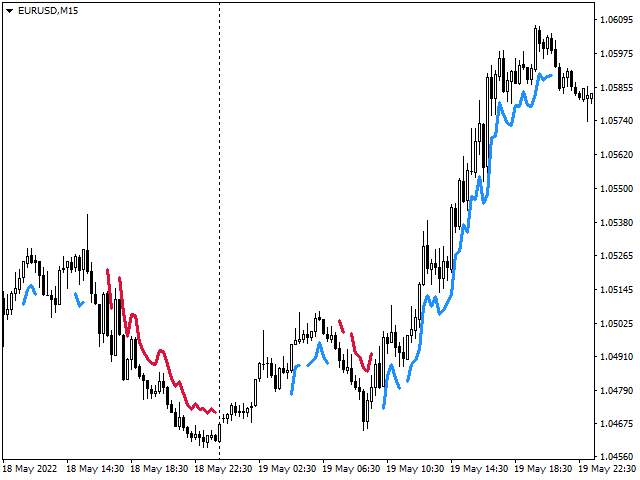
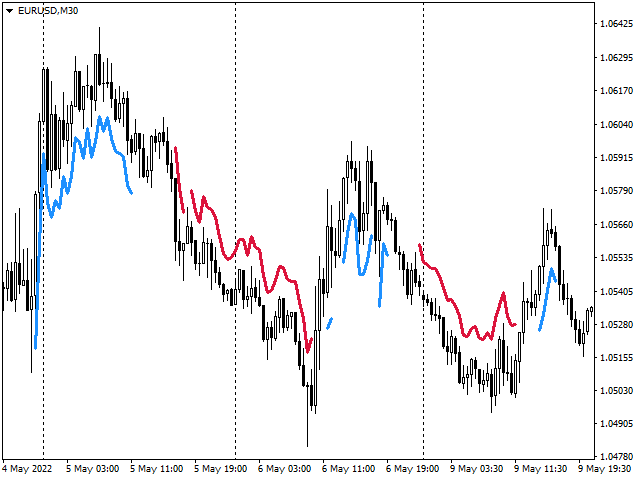
Detecta la dirección de la tendencia y se colorea del color correspondiente.
Tiene tres opciones de sensibilidad diferentes
Puede mostrar la dirección de la tendencia en otros marcos temporales
Tiene incorporadas alertas sonoras y visuales en los cambios de tendencia.
Puede enviar notificaciones a su teléfono o correo electrónico.
Permite operar con tendencias y contra-tendencias.
Funciona en todos los plazos, todos los pares de divisas, metales, índices y criptomonedas.
Se puede utilizar para las opciones binarias.
Características distintivas
- Sin redibujado;
- Multi-marco de tiempo;
- Tres opciones de sensibilidad;
- Cuatro tipos de alertas;
- Ajustes sencillos y claros;
- Funciona en todos los marcos temporales y todas las herramientas de negociación;
- Apto para operar con divisas, índices, metales, opciones y criptomonedas (Bitcoin, Litecoin, Ethereum, etc.);
- Adecuado para el comercio manual y para su uso en la creación de robots de negociación (Expert Advisors);
Se puede utilizar como un sistema de comercio independiente, así como con otros indicadores.
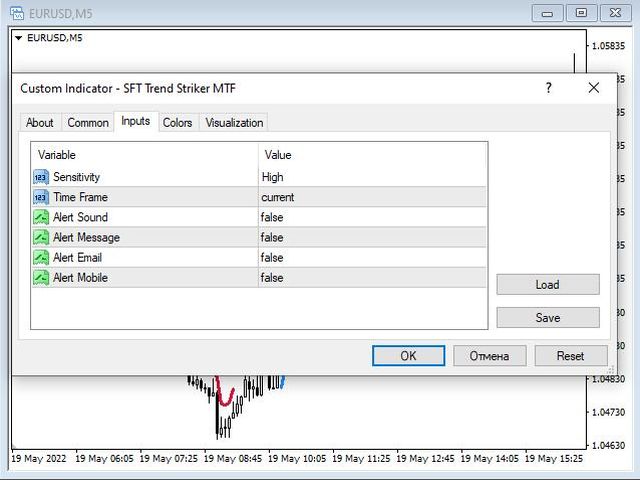
Ajustes del indicador
Sensibilidad - sensibilidad Alta, Media, Baja;
Time Frame - marco de tiempo en el que se define la tendencia;
Sonido de alerta - sólo notificaciones sonoras;
Mensaje de Alerta - muestra el mensaje y el sonido de confirmación de la señal;
Alert Mobile - envía señales a su teléfono, a través del terminal móvil instalado, guía de configuración aquí;
Consejos para operar
- Cuando aparezca una línea roja abra una Venta o Venta (para opciones)
- Cuando aparezca la línea azul abra una Compra o una Opción de compra (para opciones)
- La dirección de la operación debe corresponder a la dirección de la tendencia en un marco temporal superior.
- Salga de una operación en una señal de retorno y a la desaparición de una línea, o por debajo del SL y TP establecidos.
- Cuando se utiliza el SL y TP, es aconsejable establecer el SL para el extremo más cercano, TP = 1...2 SL.
- Bien recomendado para usar en combinación con el indicador libre SFT Flecha Bala.
Otras variantes también son posibles, en el proceso de negociación usted será capaz de elaborar las tácticas más convenientes.
Para obtener más información y una revisión más detallada de las técnicas de negociación con este indicador, haga clic aquí:
Le deseamos un trading estable y rentable y le damos las gracias por utilizar nuestro software.
Si le gusta, haga una buena acción y comparta el enlace con sus amigos.
Y si no quieres perderte nuevos lanzamientos de programas útiles para el trading - agrégate como amigo: SURE FOREX TRADING