Channel FTF MT5
- Indicadores
-
Pavel Verveyko
 Writing scripts, indicators, EAs on MQL5 and MQL4.
Fast, Reliable, And High-Quality.
For all questions, please contact personal messages. - Versión: 1.3
- Actualizado: 7 septiembre 2022
- Activaciones: 5
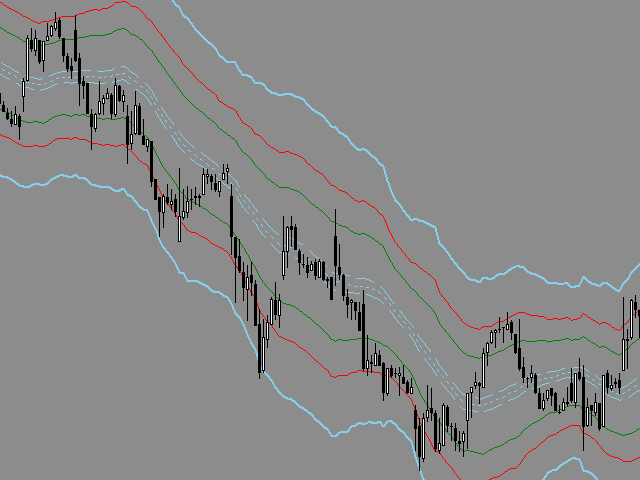
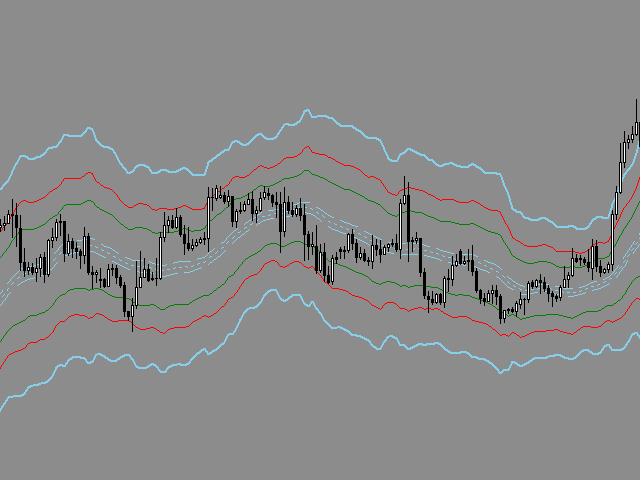
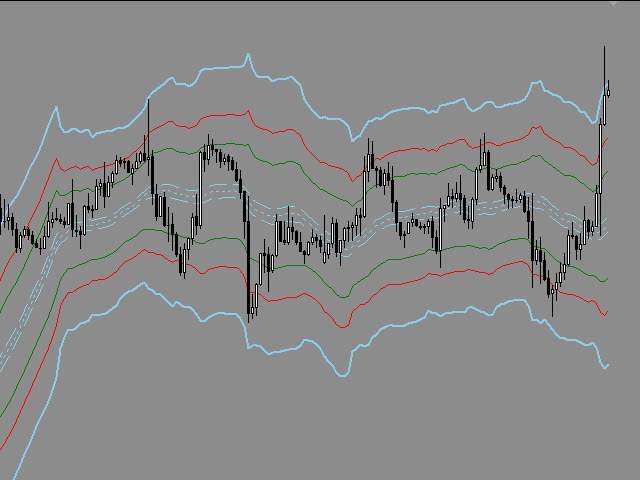
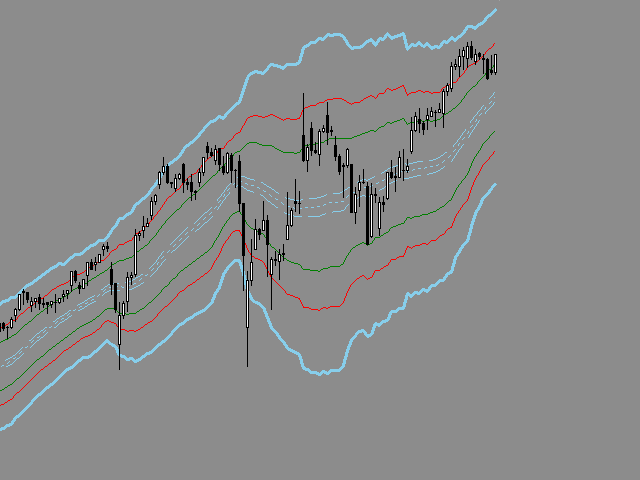
El indicador Envelopes determina la presencia de una tendencia o plana. Tiene 3 tipos de señales, muestra los niveles probables de retroceso y los niveles de los posibles objetivos.
En los cálculos del indicador se utilizan los coeficientes de Fibonacci.
Señales ( se generan al tocar las líneas o al rebotar desde las líneas):
- Tendencia - la línea media de la Envolvente tiene una inclinación marcada; las líneas por debajo de la línea media del canal se utilizan para operaciones de compra, las líneas por encima de la línea media y la propia línea media se utilizan para operaciones de venta;
la dirección de la operación debe coincidir con la dirección de la línea media del canal. - Plano - la línea media de las envolventes es horizontal; las señales se reciben desde los bordes y pre bordes del canal con los objetivos en el borde opuesto del canal.
- Rupturade volatilidad - los bordes del canal son horizontales; la ruptura de uno de estos bordes del canal indica el inicio de un movimiento.
El indicador tiene un sistema de alertas: una alerta de terminal estándar, un mensaje a un terminal móvil, un mensaje de correo electrónico.
En el ajuste Alert_Additional_Symbols, puede configurar alertas para herramientas adicionales distintas de la herramienta actual.
Para utilizar el indicador en los Asesores Expertos, existen los siguientes buffers de indicadores.
Ajustes
- Es posible modificar el color, la anchura y el tipo de cualquier línea del indicador.
- Period_Trend - periodo de tendencia.
- Period_Vol - periodo de volatilidad.
- Alert_ID - es una etiqueta de alerta única.
- Alert_Additional_Symbols - separados por comas, puede especificar herramientas adicionales para las que se recibirán alertas.
- (esto no es necesario para la herramienta actual).
- Send_Notification - activar/desactivar la notificación al terminal móvil.
- Send_Alert - activar/desactivar la notificación al terminal estándar.
- Send_Mail - activar/desactivar la notificación por correo electrónico.