StatChannel
- Indicadores
-
Aleksey Ivanov
 👑 Físico teórico, programador, trader con 15 años de experiencia.
-------------------------------------------------------------------------------
💰 Productos presentados:
1) 🏆 Indicadores con filtrado óptimo de ruidos de mercado (para elegir puntos de apertura y cierre de posiciones). - Versión: 1.20
- Actualizado: 4 septiembre 2019
- Activaciones: 5
El principio del indicador.
El indicador StatChannel ( SC) es un desarrollo del indicador Bandas de Bollinger ( ВВ). BB es una media móvil, a ambos lados de la cual se dibujan dos líneas, separadas de ella por desviaciones estándar std multiplicadas por el coeficiente correspondiente. Al mismo tiempo, una media móvil con un periodo de promediación de (2n + 1) compases se obtiene siempre retrasada respecto a n compases. La desviación std también se retrasa respecto a n compases, también calculada en (2n + 1) puntos. Un retraso tan fuerte reduce la eficacia del uso de BB.
El indicador SC se construye de la misma manera que un BB clásico, pero sólo sobre la base de la media móvil no rezagada. Dicha curva se calcula en los puntos (Inf, n + 1], como media móvil en el segmento (Inf, 0], donde 0 es el número de la última barra, desplazada hacia atrás n barras, y en los puntos del segmento [n, 0] se estima. La estimación es un sector curvilíneo (intervalo de confianza de barrido) en el que se sitúa la línea de la media móvil no rezagada con un nivel de confianza determinado. La media móvil no rezagada también está rodeada por std no rezagado, que se determina en los puntos (Inf, n + 1) del mismo modo que la media móvil no rezagada, y en los puntos del segmento [n, 0] - mediante un algoritmo especial que calcula el conjunto de valores std, que estarán dentro del valor especificado del intervalo de confianza.
Operar con el indicador SC.
El indicador SC construye los patrones de distribución de los canales actuales, en los que todas las fluctuaciones de precios encajan en montón y de manera uniforme. La figura de la línea central da directamente los valores del precio actual que encajan en el nivel de confianza dado (en los ajustes). Las figuras de las líneas superior e inferior describen las variaciones admisibles de las fluctuaciones de precios en la parte superior e inferior, respectivamente.
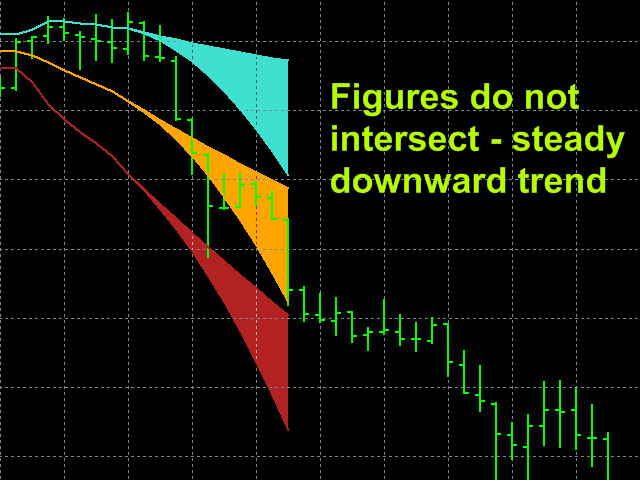
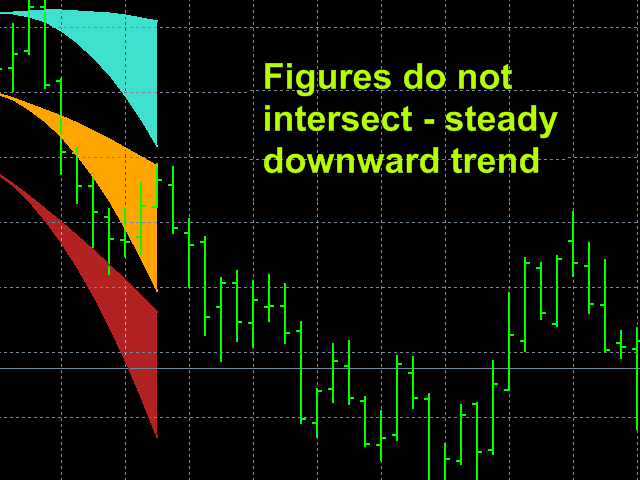
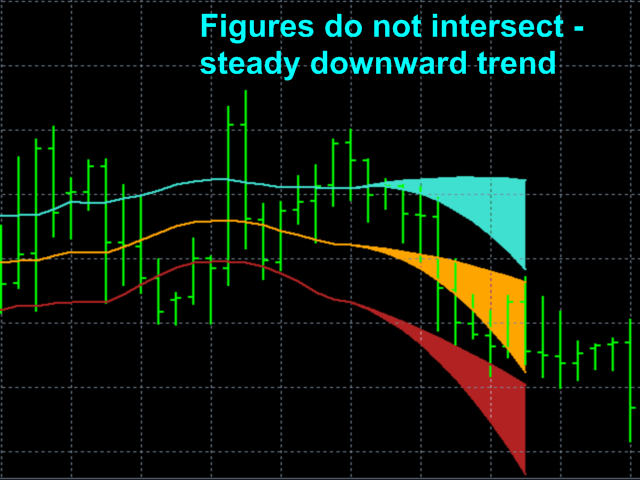
Si el borde inferior del sector de figuras del componente medio del indicador SC se desplaza hacia arriba, entonces existe una tendencia alcista. Si el límite superior del sector curvilíneo del componente medio del indicador SC se orienta hacia abajo, entonces hay una tendencia bajista. En estos casos, se puede confiar en la corrección de la dirección de la tendencia establecida con un nivel de confianza determinado.
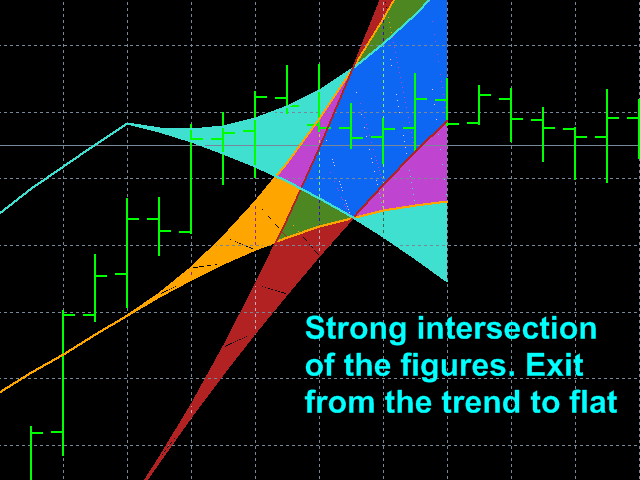
Si el límite superior del sector de figuras del componente medio del indicador SC se desplaza al alza, y el límite inferior se desplaza a la baja, entonces existe un plano, que sirve como señal para cerrar posiciones tendenciales.
Si los sectores de color están claramente divididos, entonces cuando el precio se acerca al borde superior de la línea superior, es necesario abrir una posición en Venta, y cuando el precio se acerca al borde inferior de la línea inferior en Compra, lo que, por supuesto, es necesario hacer si hay una tendencia pronunciada con respecto a ella direcciones, es decir, no juegue en contra de esta tendencia.Es decir, no juegue en contra de esta tendencia. Las posiciones de cierre, por el contrario, Vender cuando el precio cae al sector de la figura de la línea inferior, y Comprar cuando el precio sube al sector de la figura de la línea superior.
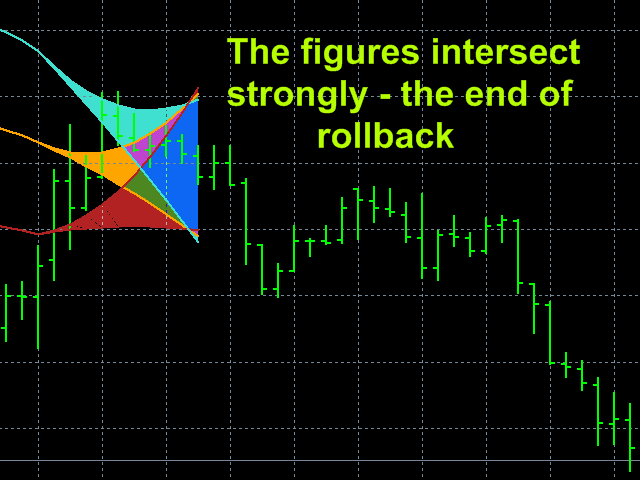
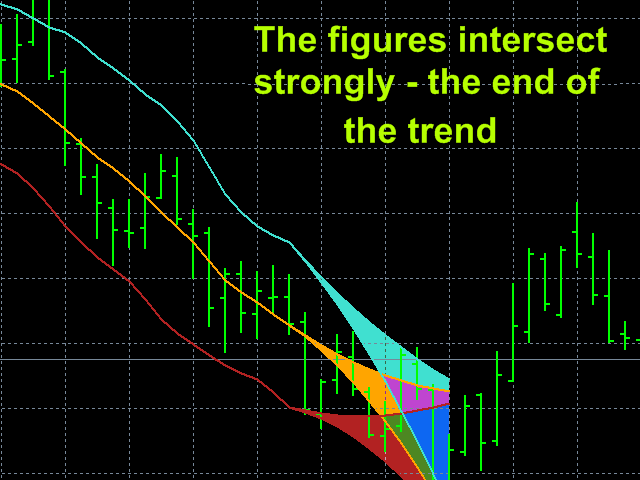
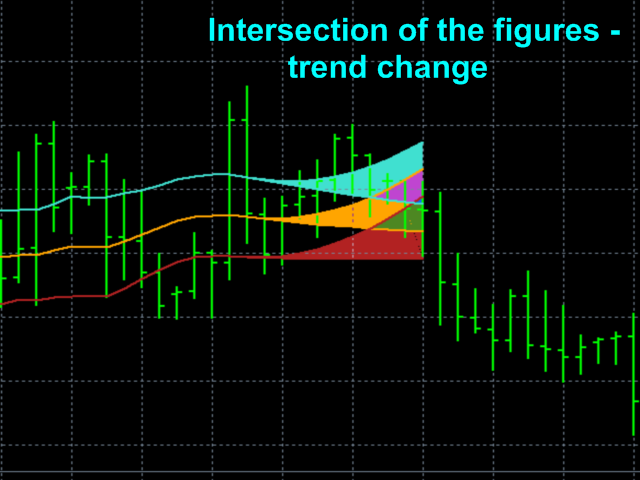
Una fuerte superposición de sectores indica una alta probabilidad de cambio de tendencia.
Configuración del indicador.
- Tipo de precio - precio aplicado. Valores: Precio de cierre, Precio de apertura, Precio alto, Precio bajo, Precio medio ((alto + bajo)/2 - por defecto), Precio típico ((alto + bajo + cierre)/3), Precio ponderado ((alto + bajo + 2*cierre)/4).
- Método de promediación - método de promediación. Valores: Simple (por defecto), Exponencial, Suavizado, Lineal ponderado.
- El período de promedio - período de promedio. Valores: cualquier número entero (21 por defecto).
- Probabilidad de confianza Valores: cualquier número real de 0 a 0,999 (0,67 por defecto).
- Factor de anchura decanal en STD - factor de anchura de canal en desviaciones estándar. Valores: cualquier número real (1.0 por defecto).
- Desplazamiento global - Desplazamiento global del inicio de las lecturas del indicador en barras. Valores: cualquier número entero positivo (0 por defecto).
- Color línea superior - Color de la línea superior y del sector de la figura. Turquesa por defecto.
- Color línea media - Color de la línea media y del sector de figuras. Por defecto Naranja.
- Color líneainferior - Color de la línea inferior y del sector de figuras. Por defecto Ladrillo Fuego.
- ¿Pintar sobre el intervalo de confianza? - Para colorear el sector de la figura del intervalo de confianza. Valores: true (por defecto), false.


Good indicator.