Signal Channel
- Indicadores
-
Aleksey Ivanov
 👑 Físico teórico, programador, trader con 15 años de experiencia.
-------------------------------------------------------------------------------
💰 Productos presentados:
1) 🏆 Indicadores con filtrado óptimo de ruidos de mercado (para elegir puntos de apertura y cierre de posiciones). - Versión: 1.10
- Actualizado: 21 agosto 2020
- Activaciones: 5
El principio de construcción de las líneas del indicador y su significado.
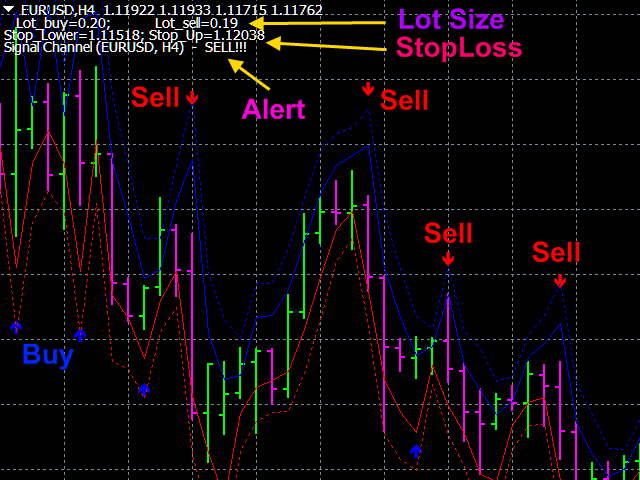
El indicador Signal Channel utiliza un método de filtrado robusto basado en dos medianas móviles aplicables a los precios Alto y Bajo, es decir las líneas <Alto> y <Bajo>, donde <..> es el signo de la media lineal, que se desplazan por determinados valores en una tendencia alcista y por valores opuestos en una tendencia bajista, lo que permite obtener un canal estrecho, que contornea aproximadamente cada barra. Los pliegues agudos de las líneas de dicho canal permiten establecer con la mayor precisión y el menor retraso posible el inicio de un nuevo movimiento tendencial. El posible cambio en la dirección de la tendencia también se indica por el estrechamiento agudo de las líneas del canal, que, de hecho, se expresa por la caída de la volatilidad. El indicador también tiene una función de filtrado adicional, tras la activación de la cual la señal se identifica sólo después de una disminución de la volatilidad, lo que hace que el indicador sea más fiable. Además del canal principal, dentro del cual se producen las fluctuaciones más probables del precio, se construye un canal auxiliar (en líneas discontinuas), más allá de cuyos límites el precio no va más, lo que sirve para fijar stoploss en él.
Las ventajas del indicador y de operar con él.
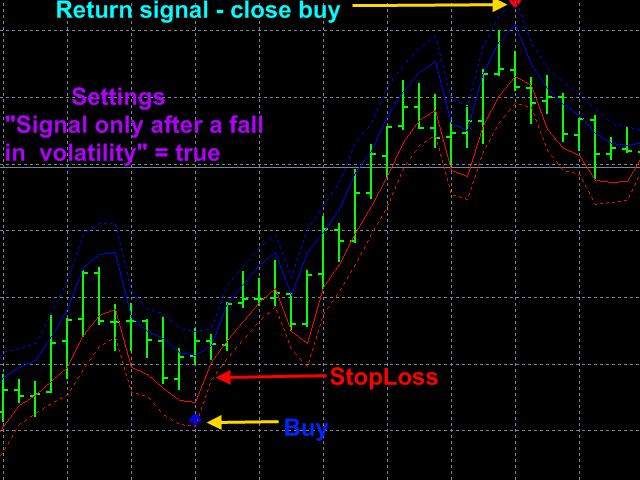
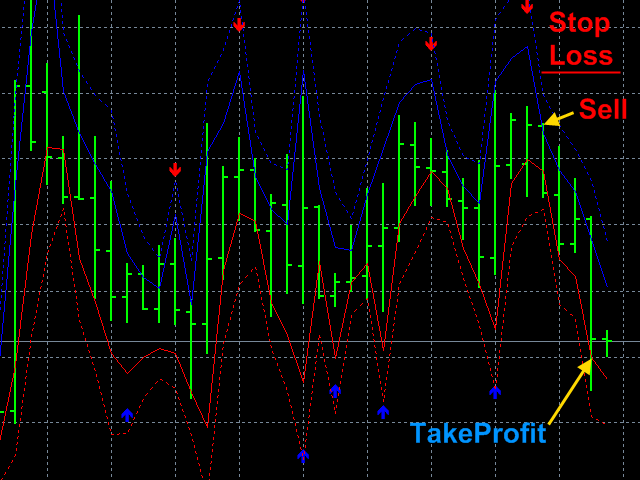
Las lecturas del indicador son extremadamente sencillas y no requieren explicaciones especiales. Las flechas azules que apuntan hacia arriba son una señal de compra, las flechas rojas que apuntan hacia abajo son una señal de venta. Se puede operar en la dirección indicada por la flecha de señal en una barra actual; entonces la línea azul sólida superior del canal sirve como toma de beneficios para las posiciones de compra, y la línea roja discontinua inferior muestra entonces las posiciones de los stoplosses; para las posiciones de venta, por el contrario, la línea roja sólida inferior sirve como toma de beneficios, y los stoplosses se sitúan en la línea azul discontinua superior. Puede operar según las tendencias señaladas por las flechas; entonces sólo se coloca un stop loss, y la posición de beneficios se cierra cuando aparece una flecha dirigida en sentido contrario. También puede, al cierre de cada barra regular, desplazar el stop loss de una posición rentable, que en este caso cerrará con beneficio en el punto del último stop loss. Para estas estrategias, el indicador dispone de una función de cálculo de lotes basada en el tamaño del depósito y el nivel de riesgo aceptado.
El indicador Signal Channel puede utilizarse tanto para operar según estrategias scalper, como cuando se utilizan estrategias de trading a largo plazo. El indicador tiene todo tipo de alertas. El indicador no se redibuja.
Configuración del indicador.
- El período de promediación - período de promediación. Valores: cualquier número entero positivo (3 por defecto).
- Señal sólo después de una caída de la volatilidad. Filtro que permite la señal sólo después de una caída de la volatilidad. Valores: true, false(por defecto).
- Grosor de línea y flecha - Valores: cualquier entero positivo (1 por defecto).
- ¿Calcular el tamaño del lote a partir del riesgo y el depósito? Valores: true, false(por defecto).
- Depósito en$. Depósito en USD.
- Pérdidas permitidas en %. Tasa de pérdidas aceptada en %.
- El método de señal - Tipo de alerta de negociación. Valores: No (por defecto), Enviar alerta, Imprimir (en experto), Comentar (en gráfico), Sonido + Imprimir, Sonido + Comentar, Sonido, Push + Comentar, Push, Mail + Comentar, Mail.