Chart Overlay Indicator
- Indicadores
- Versión: 1.1
- Actualizado: 2 junio 2020
- Activaciones: 5

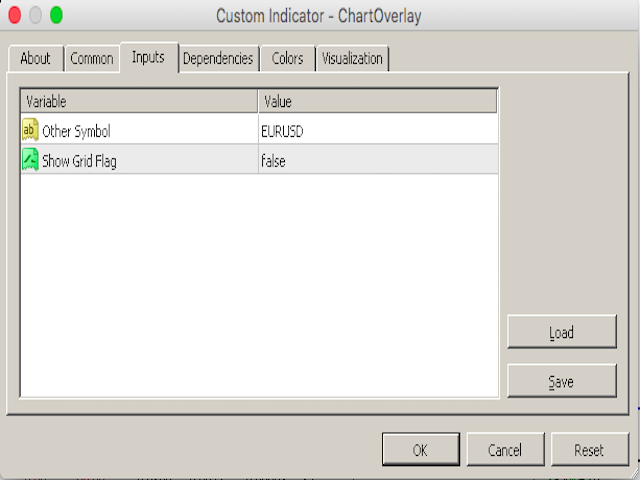
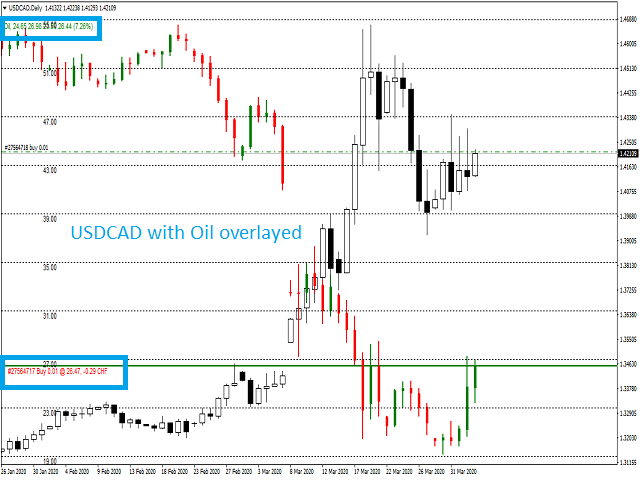
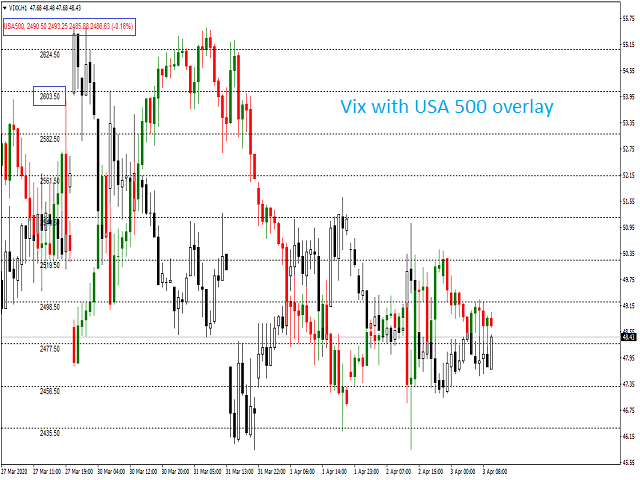
El indicador de superposición de gráficos muestra la acción del precio de diferentes productos en el mismo gráfico, lo que le permite evaluar cómo los diferentes símbolos fluctúan entre sí. Puede utilizarlo para tomar decisiones comerciales basadas en la convergencia / divergencia de los productos mostrados, por ejemplo, USDCAD - XTIUSD, EURUSD - USDCHF, etc.
Utilización
- Encuentra productos sobrecomprados o sobrevendidos
- Se adapta al tamaño del gráfico, al zoom y al marco temporal
- Cálculo automático del nivel de precios
- Colores personalizables
- Haga clic en 'c' para abrir el producto subrayado en gráficos separados (tanto por hora como por día)
- Muestra las posiciones de los productos superpuestos
- Muestra los precios de apertura, máximo, mínimo y cierre del producto superpuestos.