Market View Indicator
- Indicadores
- Versión: 1.1
- Actualizado: 29 noviembre 2019
- Activaciones: 5

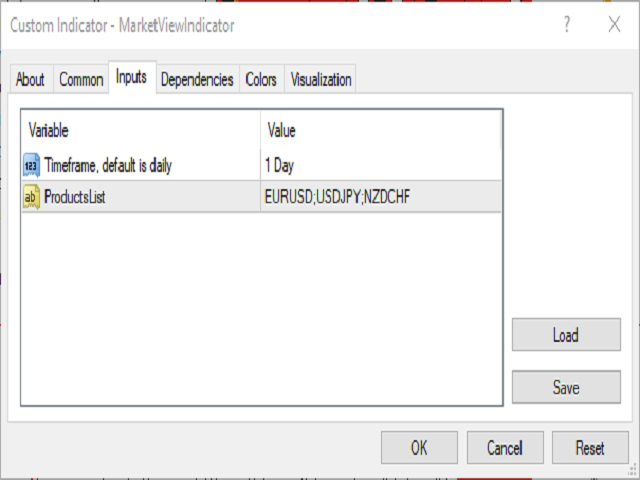
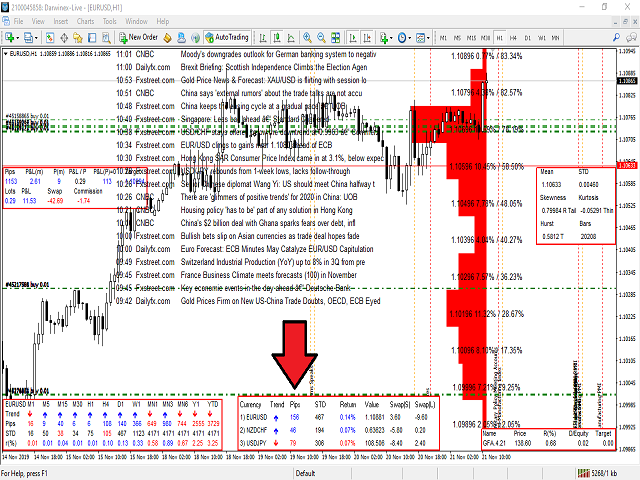
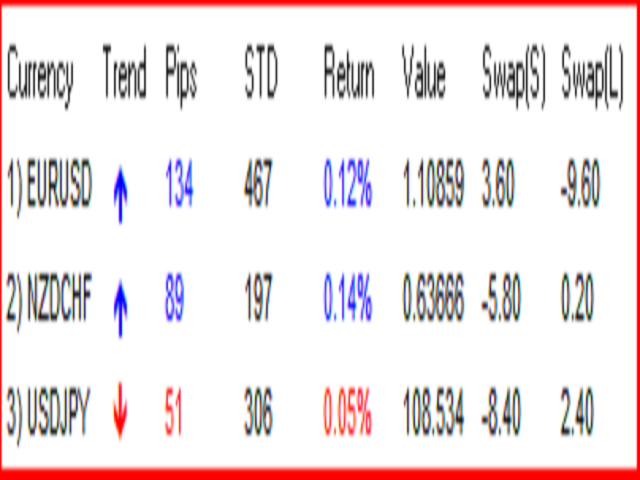
Con el indicador Market View, puede supervisar en un panel específico tantos productos como desee. Sólo tiene que añadir el indicador al gráfico, introducir los productos que desea ver y el período de cambio a seguir y eso es todo. Se abrirá un panel en la parte inferior del gráfico que le mostrará por producto el cambio en pips, la desviación estándar, la rentabilidad, etc.
Personalmente, lo uso para seguir múltiples productos con los que tengo posiciones sin tener múltiples gráficos abiertos, me ahorra ancho de banda y tiempo para saltar entre pantallas. En el ejemplo, tengo posiciones en EURUSD, USDJPY y NZDCHF, así que, solo tuve que abrir el indicador una vez, añadir estas divisas con el cambio diario como seguimiento y listo.
© 2019 Roy Meshulam