Hurst Exponent Indicator
- Indicadores
- Versión: 1.0
- Activaciones: 5

Descripción
El exponente de Hurst se denomina "índice de dependencia" o "índice de dependencia de largo alcance". Cuantifica la tendencia relativa de una serie temporal a retroceder fuertemente hacia la media o a agruparse en una dirección. Un valor H comprendido entre 0,5 y 1 indica una serie temporal con autocorrelación positiva a largo plazo, lo que significa que un valor alto de la serie probablemente irá seguido de otro valor alto y que los valores a largo plazo también tenderán a ser altos. Un valor comprendido entre 0 y 0,5 indica una serie temporal con cambio a largo plazo entre valores altos y bajos en pares adyacentes, lo que significa que a un valor alto le seguirá probablemente un valor bajo y que el valor posterior tenderá a ser alto, con esta tendencia a cambiar entre valores altos y bajos que durará mucho tiempo en el futuro. Un valor de H=0,5 puede indicar una serie completamente descorrelacionada, pero en realidad es el valor aplicable a series para las que las autocorrelaciones en pequeños retardos temporales pueden ser positivas o negativas, pero en las que los valores absolutos de las autocorrelaciones decaen exponencialmente rápido hasta cero (Wikipedia).
En el comercio, el exponente de Hurst puede indicar si el producto está en tendencia o oscilando en torno a la media móvil:
- Cuando el valor de Hurst es 0 <= H < 0,5, puede significar que el producto oscila en torno a la media móvil.
- Cuando el valor de Hurst es 0,5 < H <= 1, puede significar que el producto tiende hacia una dirección específica, ya sea largo o corto.
- Si el valor de Hurst es 0,5, significa que el producto no se encuentra ni en un rango ni en una tendencia.
Utilización
- Guarde el HurstExponent.ex4 en la carpeta Indicadores.
- Adjunte el indicador HurstExponent.ex4 a cualquier producto, seleccione cuantos puntos históricos desea calcular y vea el resultado en el sub gráfico (cuantos más puntos históricos calcule, más tiempo tendrá que esperar hasta que el gráfico de salida esté listo, debe ser >=1).
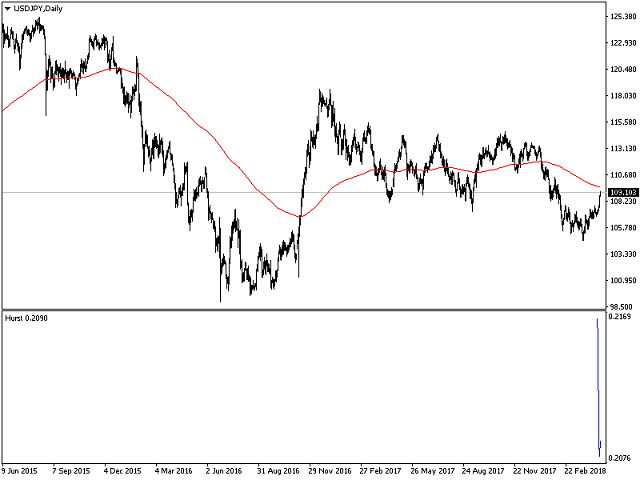
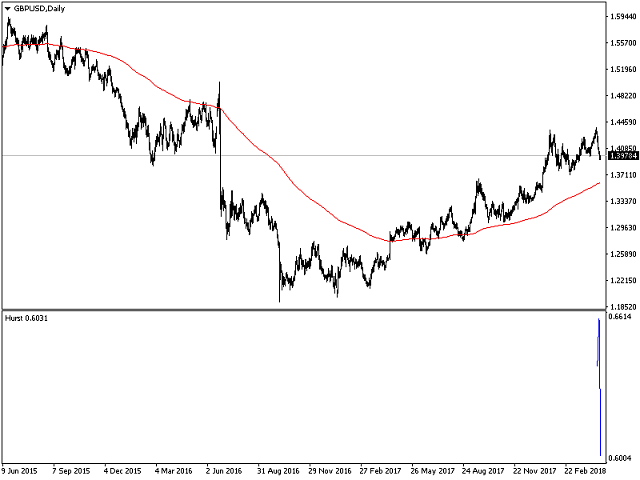
Como se ve en las imágenes adjuntas, adjunté el exponente de Hurst a dos gráficos diarios, USDJPY y GBPUSD:
Para el USDJPY, el valor del exponente Hurst es igual a 0.2090 que está en el rango de reversión media. Podemos ver claramente que el precio diario del USDJPY está fluctuando alrededor de la media móvil de 200 días sin una tendencia obvia.
Para GBPUSD por otro lado, el valor del exponente de Hurst es igual a 0.6031 que está en el rango de tendencia. Podemos ver claramente que el precio diario GBPUSD tiene una tendencia alcista por encima de la media móvil de 200 días siguiendo una tendencia bajista.
© 2019 Roy Meshulam