General Pivot Points Calculator
- Indicadores
- Versión: 1.0
- Activaciones: 5

Introducción
Los operadores profesionales utilizan los puntos pivote como niveles de soporte/resistencia o como indicador de una tendencia. Básicamente, un punto pivote son zonas en las que esposible que cambie la dirección del movimiento del precio. Lo que hace que los puntos pivote sean tan populares es su objetividad, ya que se recalculan cada vez que el precio se mueve más.
El indicador de puntos pivote implementa 5 tipos populares de cálculo y dibujo de puntos pivote:
- Estándar - El tipo más básico y popular de los pivotes, cada punto sirve como indicador de una posible inversión o continuación de la tendencia.
- Woodie - Al igual que los puntos pivote estándar, pero se da más peso al precio de cierre del período anterior.
- Camarilla - Conjunto de ocho niveles muy probables que se asemejan a los valores de soporte y resistencia de una tendencia actual.
- Tom Demark's - Método popular de cálculo de pivotes para pronosticar el precio futuro de la tendencia actual, los resultados son el mínimo y el máximo pronosticados del periodo.
- Fibonnaci - Los populares puntos pivote de Fibonacci se determinan calculando primero los puntos pivote del suelo y multiplicándolos después por los retrocesos del 38,2%, 61,8% y 100%.
Uso
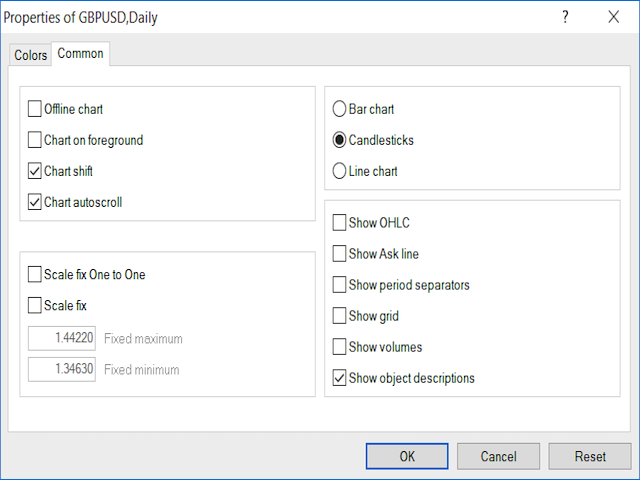
- Haga clic con el botón derecho del ratón en el gráfico y seleccione "Mostrar descripciones de objetos" en Propiedades comunes.
- Adjunte el indicador al gráfico y seleccione el marco temporal y el método de cálculo que desea utilizar.
- El indicador calculará los puntos pivote y los dibujará como líneas que se actualizarán dependiendo del marco temporal que hayas elegido.
2019 Roy Meshulam