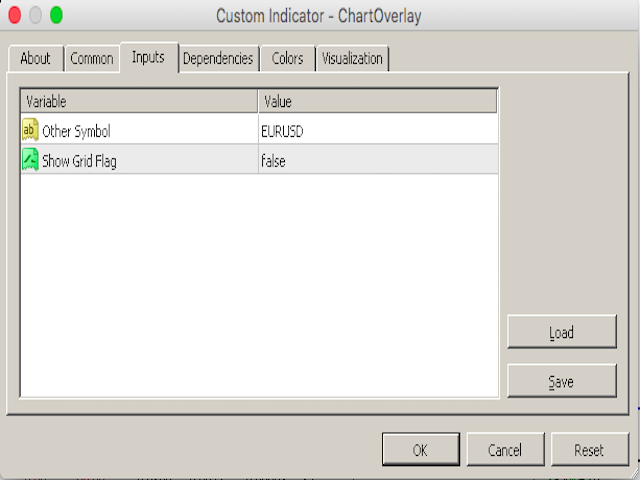
Chart Overlay Indicator
- Indikatoren
- Version: 1.1
- Aktualisiert: 2 Juni 2020
- Aktivierungen: 5

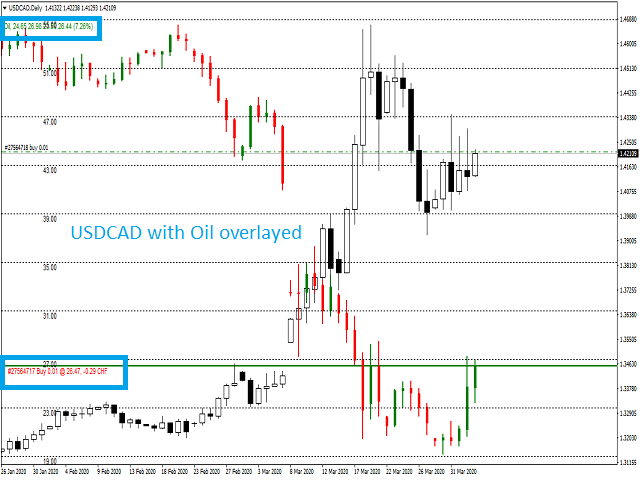
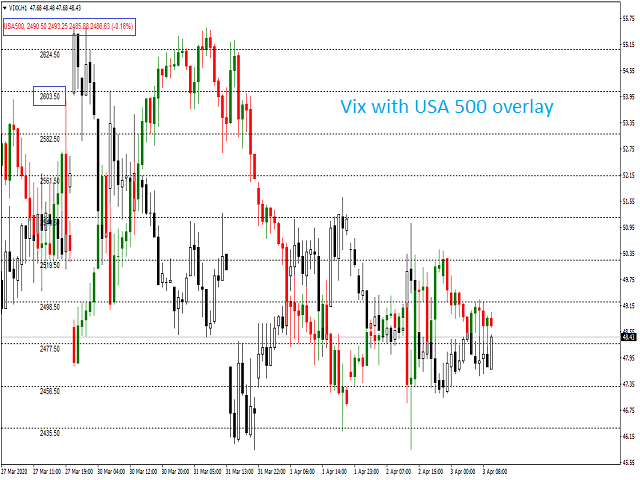
Der Chart-Overlay-Indikator zeigt die Kursentwicklung verschiedener Produkte auf demselben Diagramm an, so dass Sie beurteilen können, wie sich verschiedene Symbole im Verhältnis zueinander entwickeln. Sie können ihn verwenden, um Handelsentscheidungen zu treffen, die auf der Konvergenz/Divergenz der angezeigten Produkte basieren, z.B. USDCAD - XTIUSD, EURUSD - USDCHF usw.
Verwendung
- Findet überkaufte oder überverkaufte Produkte
- Passt sich an Chartgröße, Zoom und Zeitrahmen an
- Automatische Berechnung des Preisniveaus
- Anpassbare Farben
- Klicken Sie auf "c", um das unterstrichene Produkt in separaten Charts zu öffnen (sowohl stündlich als auch täglich)
- Zeigt überlagerte Produktpositionen an
- Zeigt überlagerte Eröffnungs-, Höchst-, Tiefst- und Schlusskurse des Produkts an