Moonwalk
- Indicadores
- Versión: 2.5
- Activaciones: 5

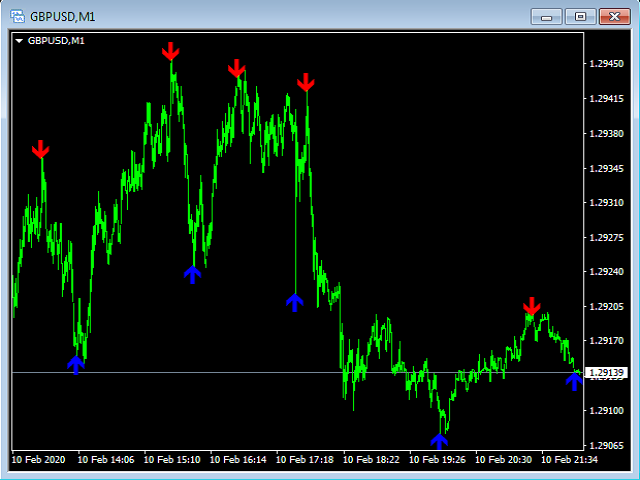
Este indicador es muy sencillo de entender y utilizar para cualquier instrumento financiero y todos los marcos de tiempo.
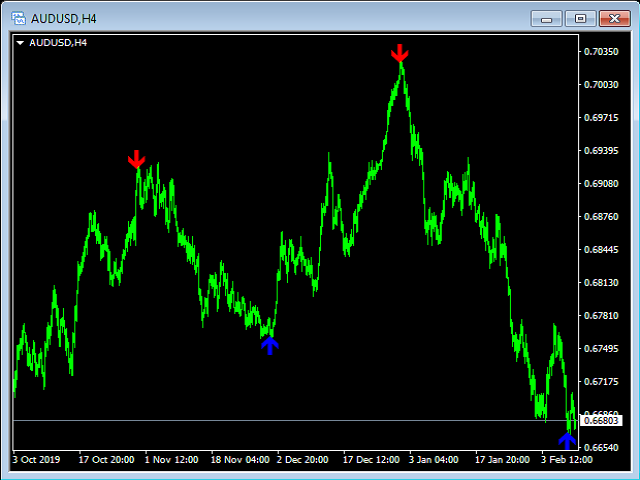
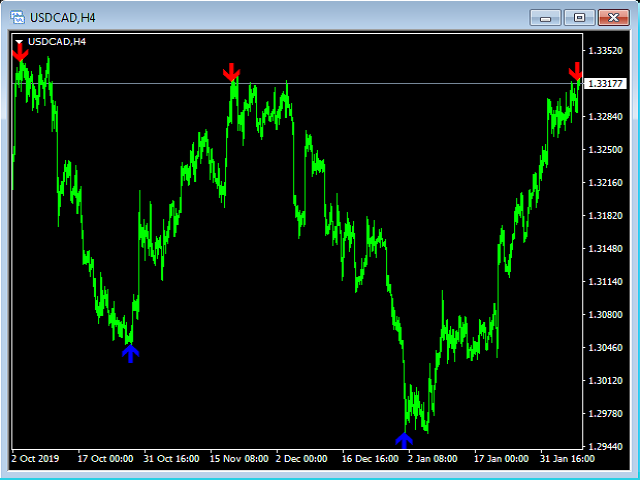
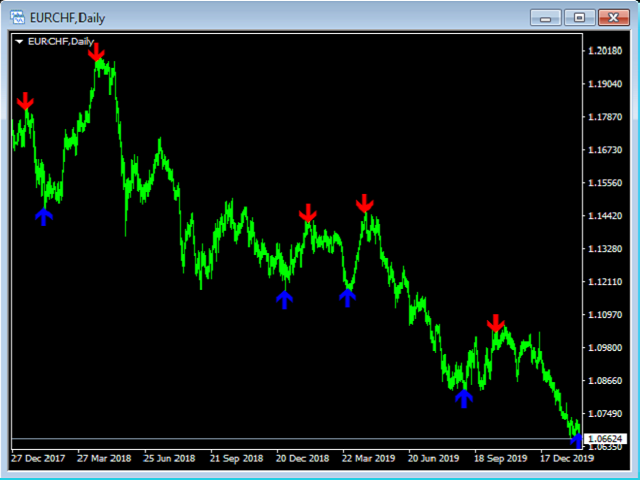
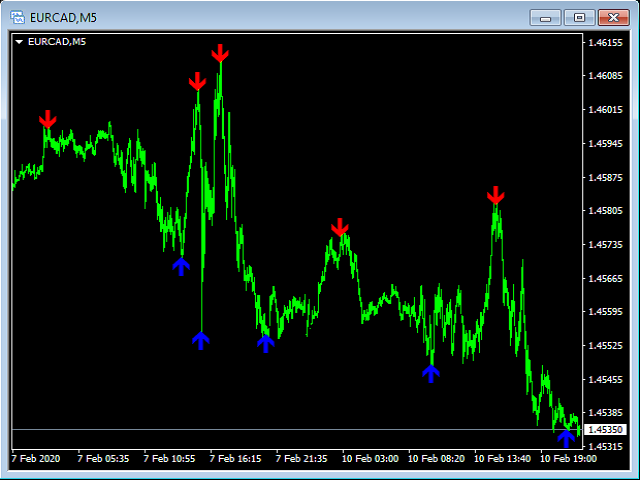
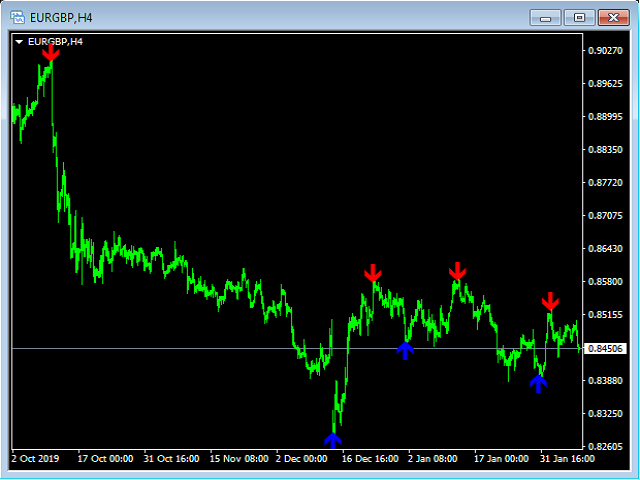
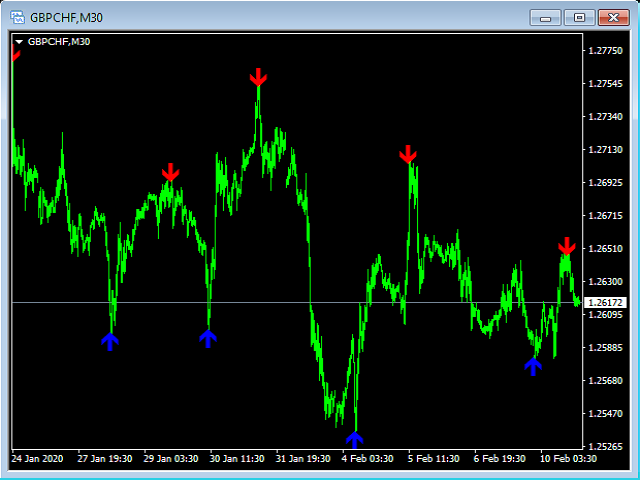
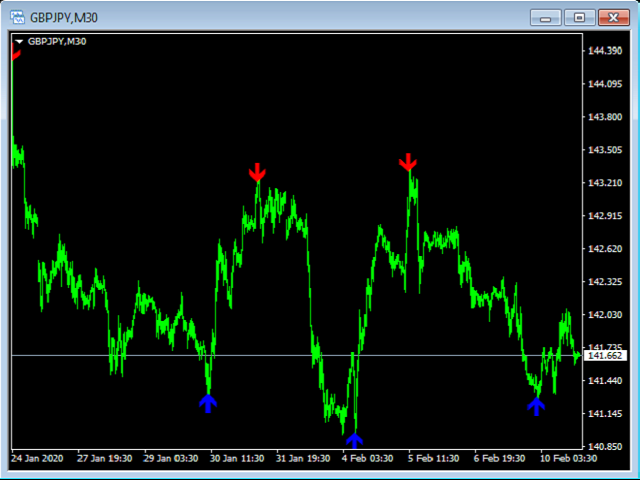
Todos los operadores se han encontrado con indicadores que contienen numerosos parámetros de entrada que cambiarán la posición de compra y venta cuando cambie el valor de esos parámetros. Muchos operadores se preguntan qué valor de parámetro será más preciso. Por lo tanto, decidí hacer un indicador universal sin ningún parámetro de entrada. En este caso usted tendrá indicadores muy estables sin ninguna preocupación que usted pone algunos números incorrectos.Este indicador mostrará la flecha de Compra (color Azul) o Venta (color Rojo) en el momento en que se espera una tendencia local Larga o Corta (local al TimeFrame actual).
Este indicador calcula los Puntos Pivote como niveles de Soporte y Resistencia actuales. En los mercados financieros, un punto pivote es un nivel de precios que es utilizado por los operadores como un posible indicador del movimiento del mercado.