Laguerre SuperTrend Clouds
- Indicadores
-
Libertas LLC
 Libertas LLC is a software company by enterprising math nerds. We make high quality and complex mathematical tools in a user-friendly and easy to use package for retail investors.
 - Versión: 1.0
- Activaciones: 20
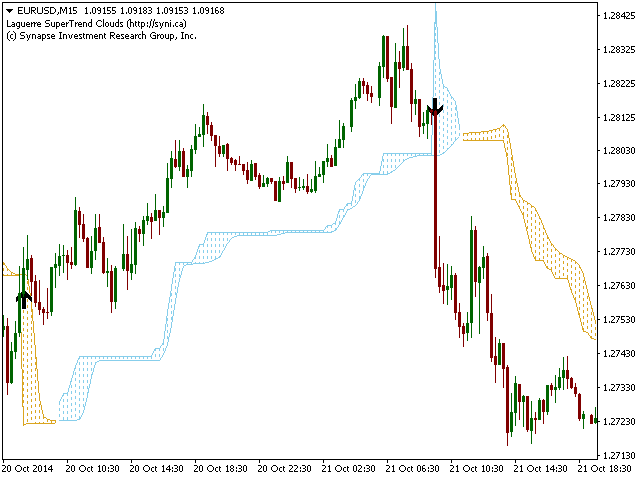
LaguerreSuperTrend Clouds añade un algoritmo de promediación adaptativo de Laguerre y alertas al popular indicador SuperTrend. Como su nombre indica, Laguerre SuperTrend Clouds (LSC) es un indicador de tendencia que funciona mejor en mercados de tendencia (no agitados).
El SuperTrend es un indicador muy popular para operaciones intradía y diarias, y puede utilizarse en cualquier marco temporal. Incorporarle la ecuación de Laguerre puede facilitar una detección de tendencias más sólida y filtros más suaves. El LSC utiliza la versión mejorada de la ecuación de Laguerre adaptativa (que aplica polinomios de Laguerre de cualquier orden), para crear nubes de confianza SuperTrend que se ajustan con flexibilidad a lo largo del tiempo, proporcionando más información sobre la fuerza creciente y decreciente de la tendencia.
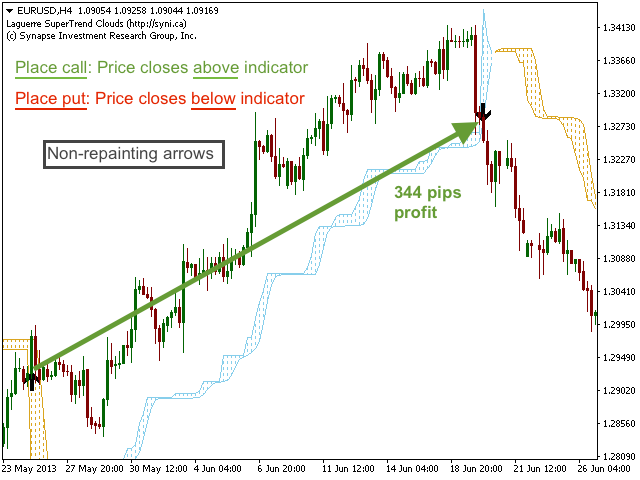
Coloque una opción de compra cuando el precio cierre por encima de la línea de tendencia y una opción de venta cuando el precio cierre por debajo de la línea de tendencia. Estos cruces se resaltan con flechas arriba/abajo que no se repiten.
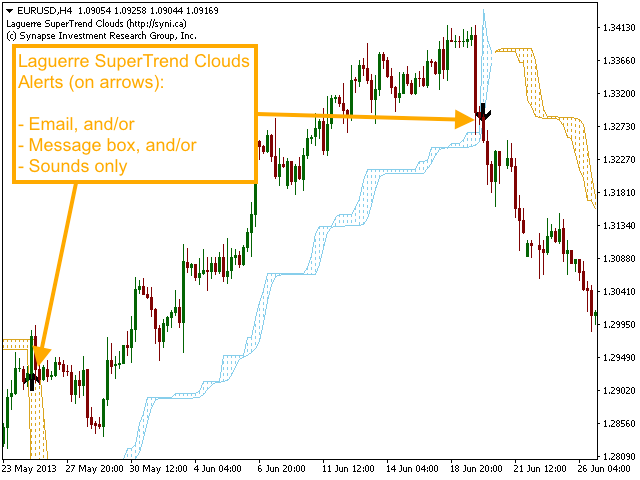
Alertas
Las alertas por correo electrónico, mensaje y sonido pueden activarse/desactivarse para los siguientes eventos. Tenga en cuenta que el destinatario del correo electrónico y la información SMTP deben especificarse en las opciones de MetaTrader 4 antes de utilizar las alertas por correo electrónico.
- El precio cerró por encima de la línea LSC (call)
- Precio cerrado por debajo de la línea LSC (put)
Parámetros
- SuperTrend # Barras usadas para el cálculo (Por defecto=10) - número de barras usadas para calcular la SuperTendencia.
- Multiplicador SuperTrend (Predeterminado=4.0) - factor de multiplicación para calcular el rango medio verdadero en SuperTrend. Valor más alto = menos señales, valor más bajo = más señales pero mayor posibilidad de falsos positivos.
- LaguerreClouds Length (Default=10) - número de barras utilizadas para calcular Laguerre Clouds.
- [opt] Orden de las Nubes de Laguerre (Por defecto=4) - orden del Polinomio de Laguerre [opción avanzada].
- [opt] Periodo de Suavizado del Factor Adaptativo (Por defecto=5) - periodo para suavizar el factor adaptativo Gamma de Laguerre [opción avanzada].
- [opt] Método de Suavizado del Factor Adaptativo (Por defecto=Media) - método de promediado utilizado para suavizar el factor adaptativo Gamma [opción avanzada].
- Alert when price crosses LSC leading edge - Verdadero = se permiten las alertas, falso = se pausan todas las alertas.
- Activar mensaje de alerta - mensaje de alerta.
- Activar alertassonoras - alertas sonoras.
- Turn on alerts email - alertas por correo electrónico.
- Acknowledge alerts warning, disable future alerts - si es true, se desactivará el mensaje de aviso de alertas.
Laguerre SuperTrend Clouds es más efectivo durante condiciones de mercado de tendencia (no picadas), y por eso se empareja bien con nuestro indicador Choppiness Index.


El usuario no ha dejado ningún comentario para su valoración