BreakEven Line
- Indicadores
-
Chantal Sala
 Hi, I'm a programmer (female) from 1995 and in MQL4 from 2008.
I have released most of 2500 Expert Advisor/Indicators and Dashboard.
I have worked with many famous italian traders to automate their strategy. - Versión: 1.4
- Actualizado: 16 mayo 2022
- Activaciones: 10
BreakEven Line es un indicador muy útil y fácil de usar.
En caso de múltiples posiciones abiertas en el mismo instrumento, el indicador muestra el punto de equilibrio en el que es posible cerrar las posiciones.
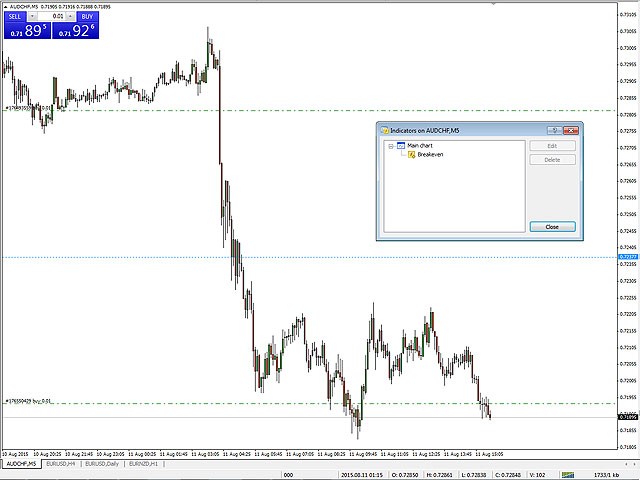
Su simplicidad gráfica lo convierte en una herramienta discreta y personalizable.
Puede activar/desactivar una línea en un gráfico, de modo que puede hacer que el indicador sea invisible.
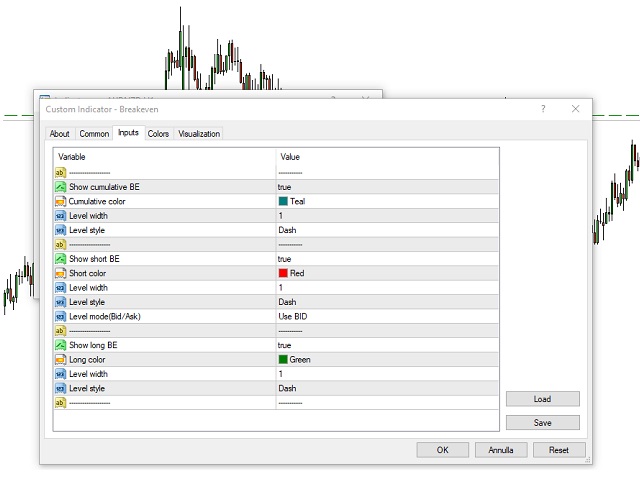
Entradas
- Mostrar BE acumulado (línea activada/desactivada)
- Color de la línea de equilibrio (para cambiar el color de la línea)
- Estilo de la línea de equilibrio
- Ancho de la línea de punto de equilibrio
- Mostrar BE corto (línea activada/desactivada)
- Color de la línea de punto de equilibrio (para cambiar el color de la línea)
- Estilo de línea del punto de equilibrio
- Anchura de la línea de equilibrio
- Mostrar BE largo (línea activada/desactivada)
- Color de la línea de equilibrio (para cambiar el color de la línea)
- Estilo de línea del punto de equilibrio
- Ancho de línea del punto de equilibrio


El usuario no ha dejado ningún comentario para su valoración