SFT Buy Sell Pendulum
- Indicadores
-
Artem Kuzmin
 ALL PRODUCTS ▶️ https://www.mql5.com/ru/users/zombiezorrofx/seller
🔥 Maximum commission discounts:
💠 Binance 35% (trading bypassing sanctions) - Versión: 1.0
- Activaciones: 5
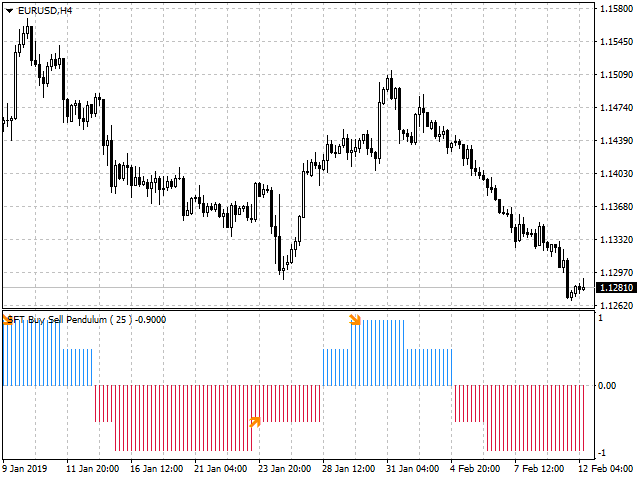
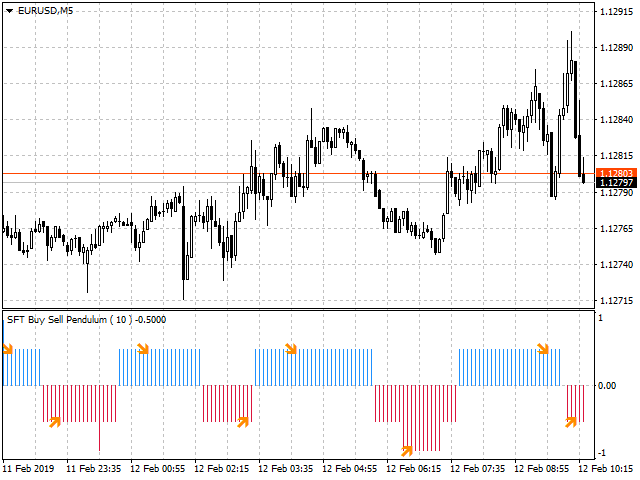
Indicador de flechas que muestra las tendencias del mercado
El histograma muestra la dirección del movimiento, y las flechas indican puntos favorables para abrir posiciones.
Puede utilizarse en cualquier par de divisas, metales y criptodivisas
Adecuado para trabajar con opciones binarias
Características distintivas
- Define un cambio de tendencia;
- Funciona en todos los marcos temporales y en todos los símbolos;
- Adecuado para el comercio de divisas, metales, opciones y criptomonedas (Bitcoin, Litecoin, Ethereum, etc.)
- Adecuado para el comercio manual y para el desarrollo de asesores.
Para entradas más precisas y señales de confirmación adicionales se puede utilizar junto con otros indicadores.
Configuración del indicador
- Buy Sell Pendulum Period - periodo del indicador;
- Profundidad del Grá fico - profundidad del indicador en el gráfico;
- Mensaje de Alerta - muestra mensajes en la pantalla y confirmación sonora de la señal;
- Alert Email - envía señales al correo, instrucciones para configurar el terminal aquí ;
- Alert Mobile - envía al teléfono, a través del terminal móvil instalado, instrucciones de configuración aquí ;
Recomendaciones de negociación
- Histograma rojo - posible reducción del precio.
- Histograma azul - posible subida del precio
- Cuando aparezca una flecha en el histograma azul, abra una venta o una venta (para opciones).
- Cuando aparezca una flecha en el histograma rojo, abra una posición de compra o de venta (para opciones).
- La dirección de la operación debe corresponder a la dirección de la tendencia en un marco temporal superior.
- Salga de la operación en la dirección opuesta o de acuerdo con el SL y TP establecidos.
- Cuando se utiliza SL y TP, es aconsejable establecer el SL para el extremo más cercano, TP = 1..2 SL.
Hay otras opciones, en el proceso de negociación se puede desarrollar la táctica más conveniente para usted.
Para obtener más información y una visión más detallada de los métodos de negociación, consulte aquí:
Estrategia de trading con el indicador SFT Buy Sell Pendulum
Le deseamos un comercio estable y rentable.
Gracias por utilizar nuestro software.
Si le gusta, haga una buena acción y comparta el enlace con sus amigos.
Para no perderse el lanzamiento de nuevos programas útiles para el comercio - añadir como amigo:SURE FOREX TRADING