MACD Alerts MT4
- Indicadores
-
KEENBASE SOFTWARE SOLUTIONS
 Welcome to Keenbase Trading,
📢 Join our Telegram for real-time updates & algo trading tips: https://t.me/keenbasetrading - Versión: 2.0
- Actualizado: 18 abril 2022
- Activaciones: 10
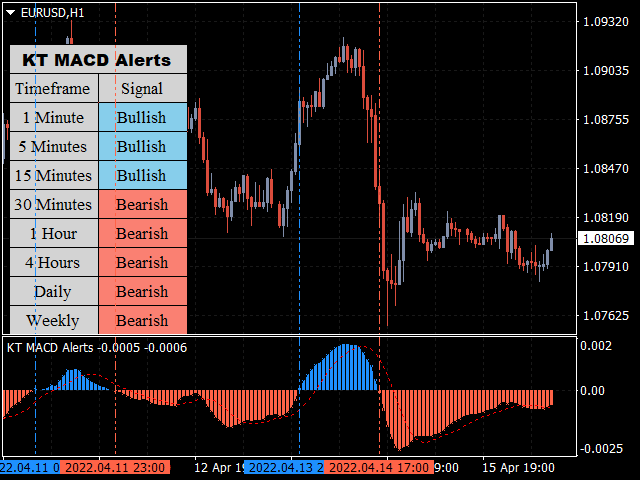
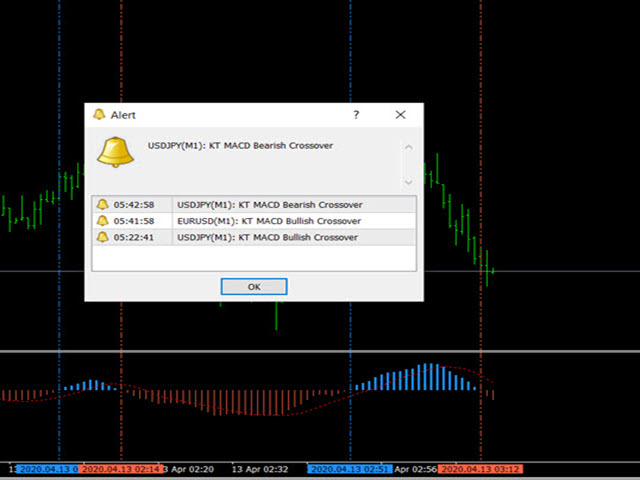
KT MACD Alerts es una versión personalizada del indicador MACD estándar disponible en MetaTrader. Proporciona alertas y también dibuja líneas verticales cuando ocurren los siguientes dos eventos:
- Cuando el MACD cruza por encima de la línea cero.
- Cuando el MACD cruza por debajo de la línea cero.
Características
- Incluye un escáner MTF incorporado que muestra la dirección del MACD en todos los marcos de tiempo.
- Una excelente opción para traders que se enfocan en cruces del MACD con respecto a la línea cero.
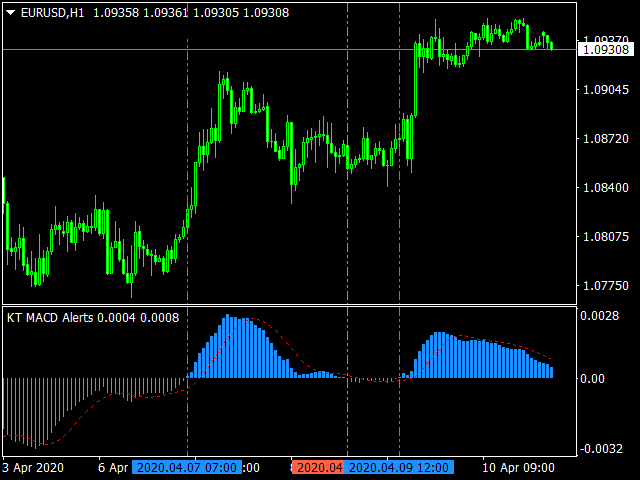
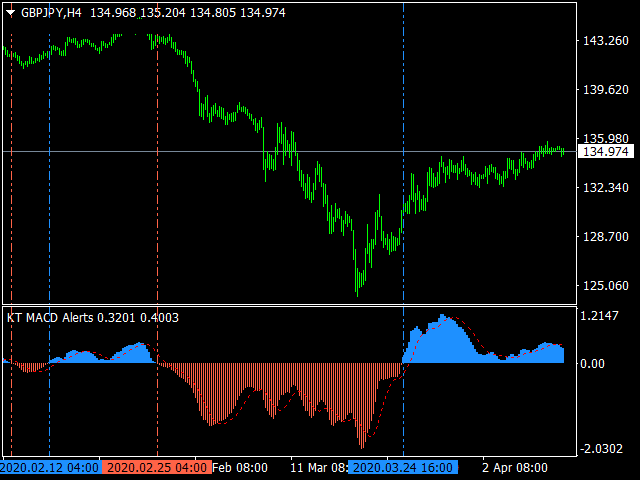
- Además de las alertas, también traza líneas verticales para identificar visualmente los puntos de cruce.
- Está programado de forma ligera, sin consumir muchos recursos ni memoria.
- Implementa todos los tipos de alertas compatibles con MetaTrader.
Historia del MACD
El indicador MACD (Moving Average Convergence Divergence) es ampliamente utilizado en el análisis técnico de precios. Fue creado por Gerald Appel en 1970. El MACD ayuda a detectar cambios en la fuerza, el impulso y la duración de una tendencia, siendo un componente clave para muchos sistemas de trading basados en tendencias.