Crossing signal ema
- Indicadores
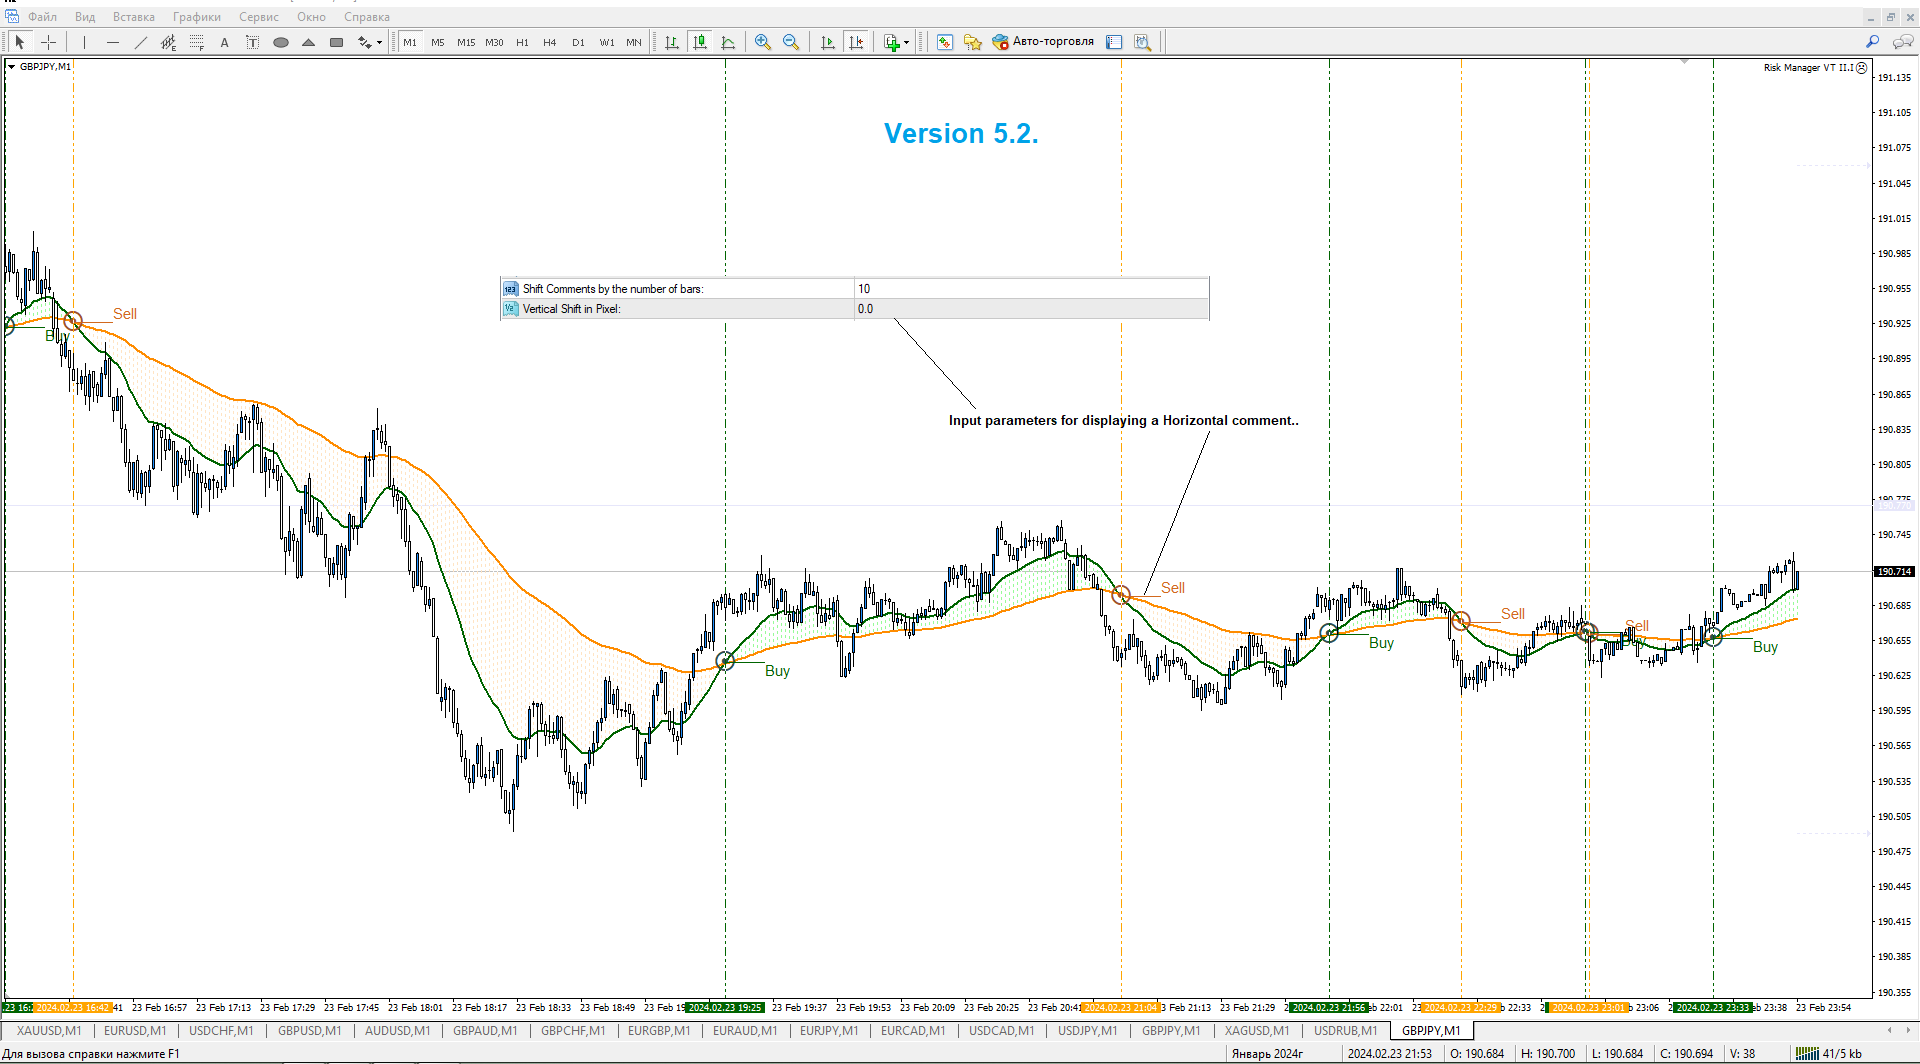
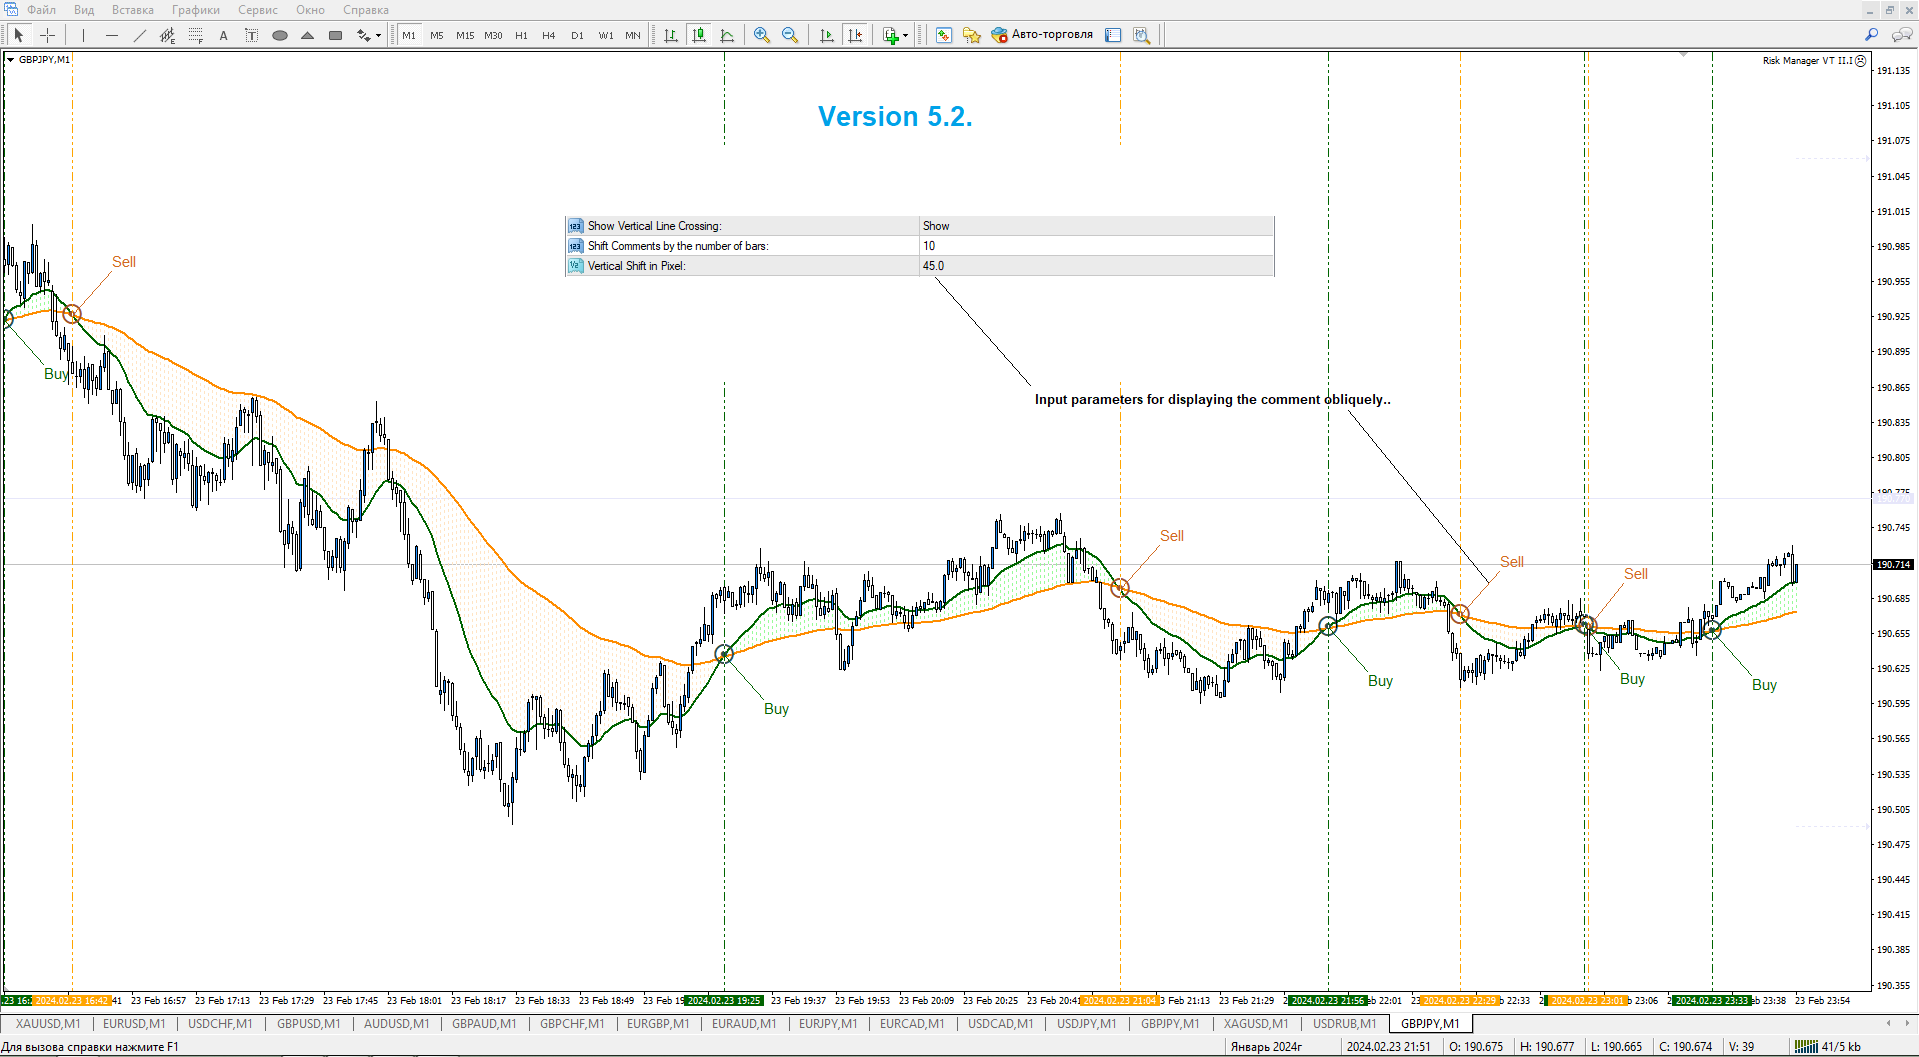
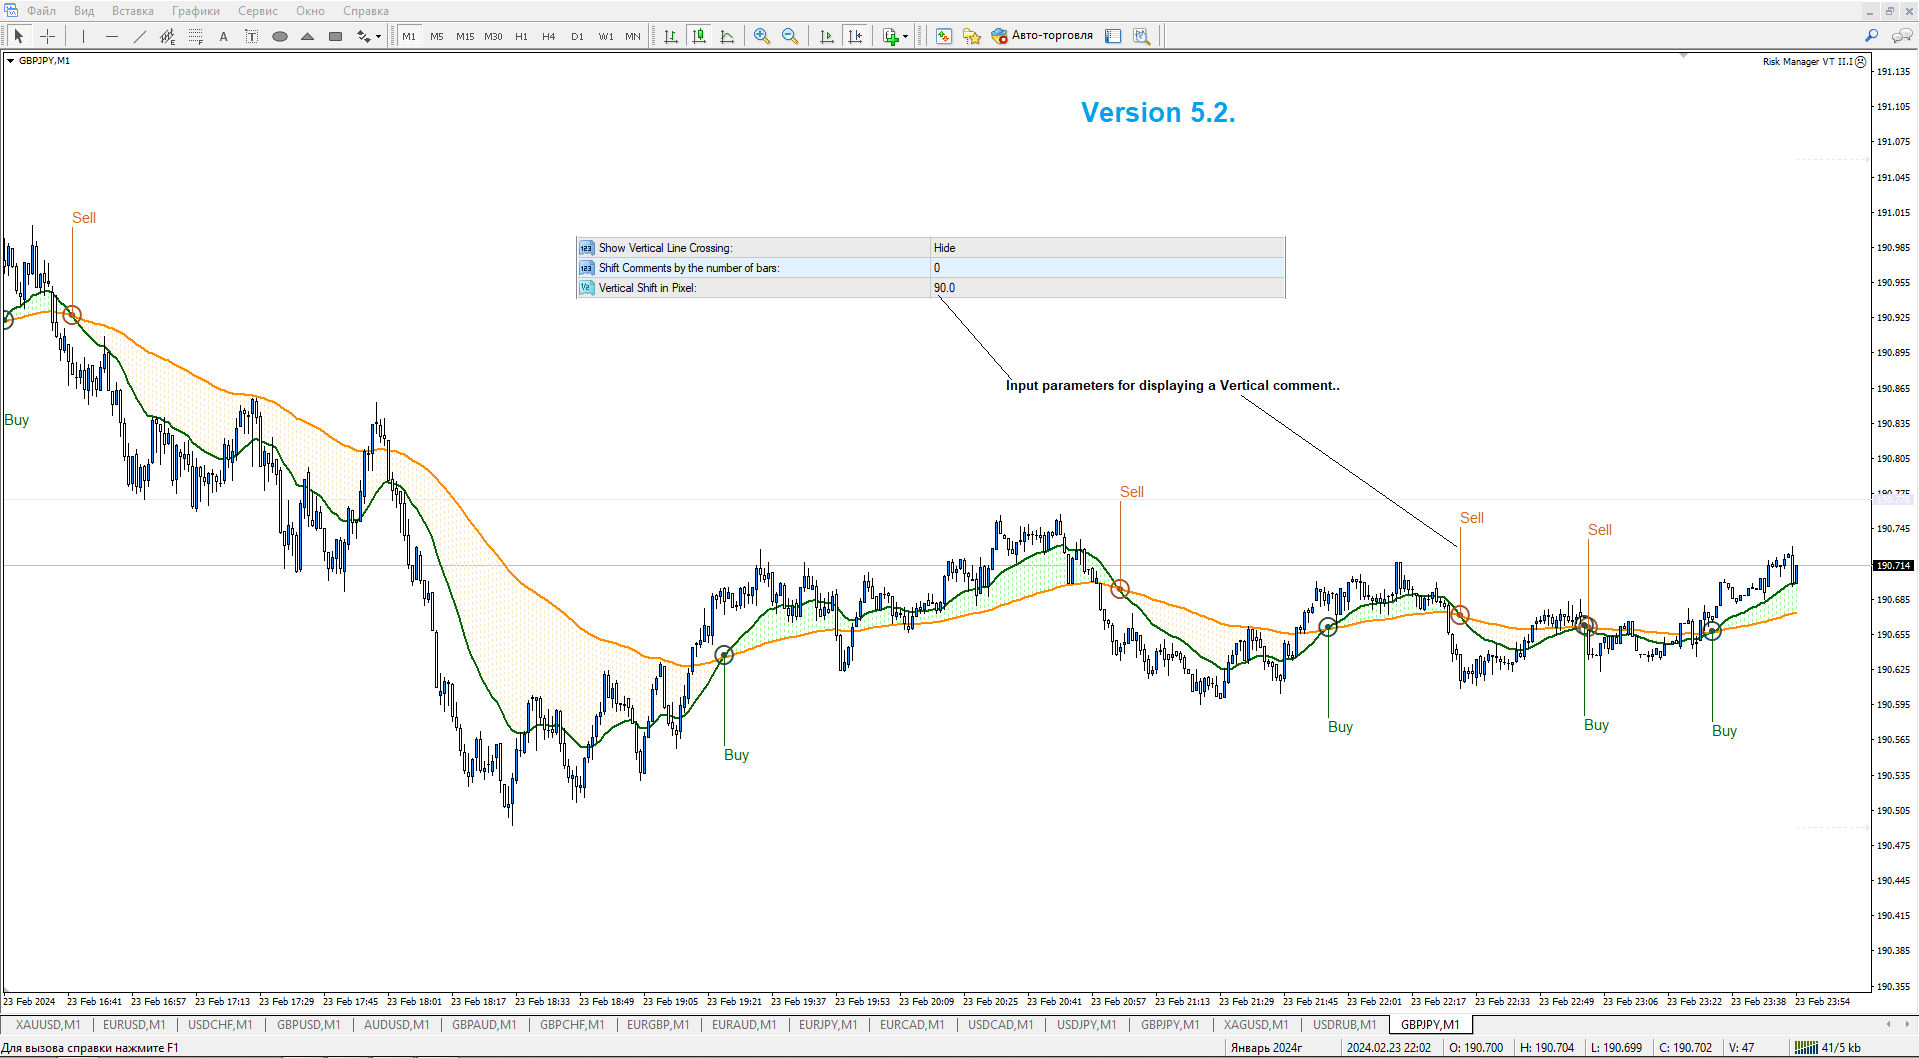
- Versión: 5.2
- Actualizado: 24 febrero 2024
- Activaciones: 15

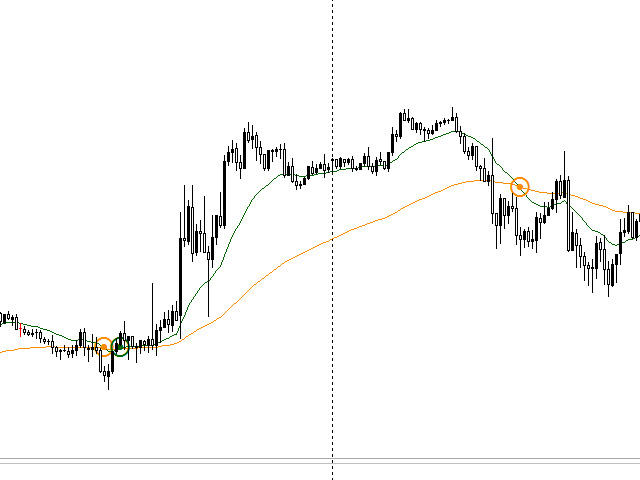
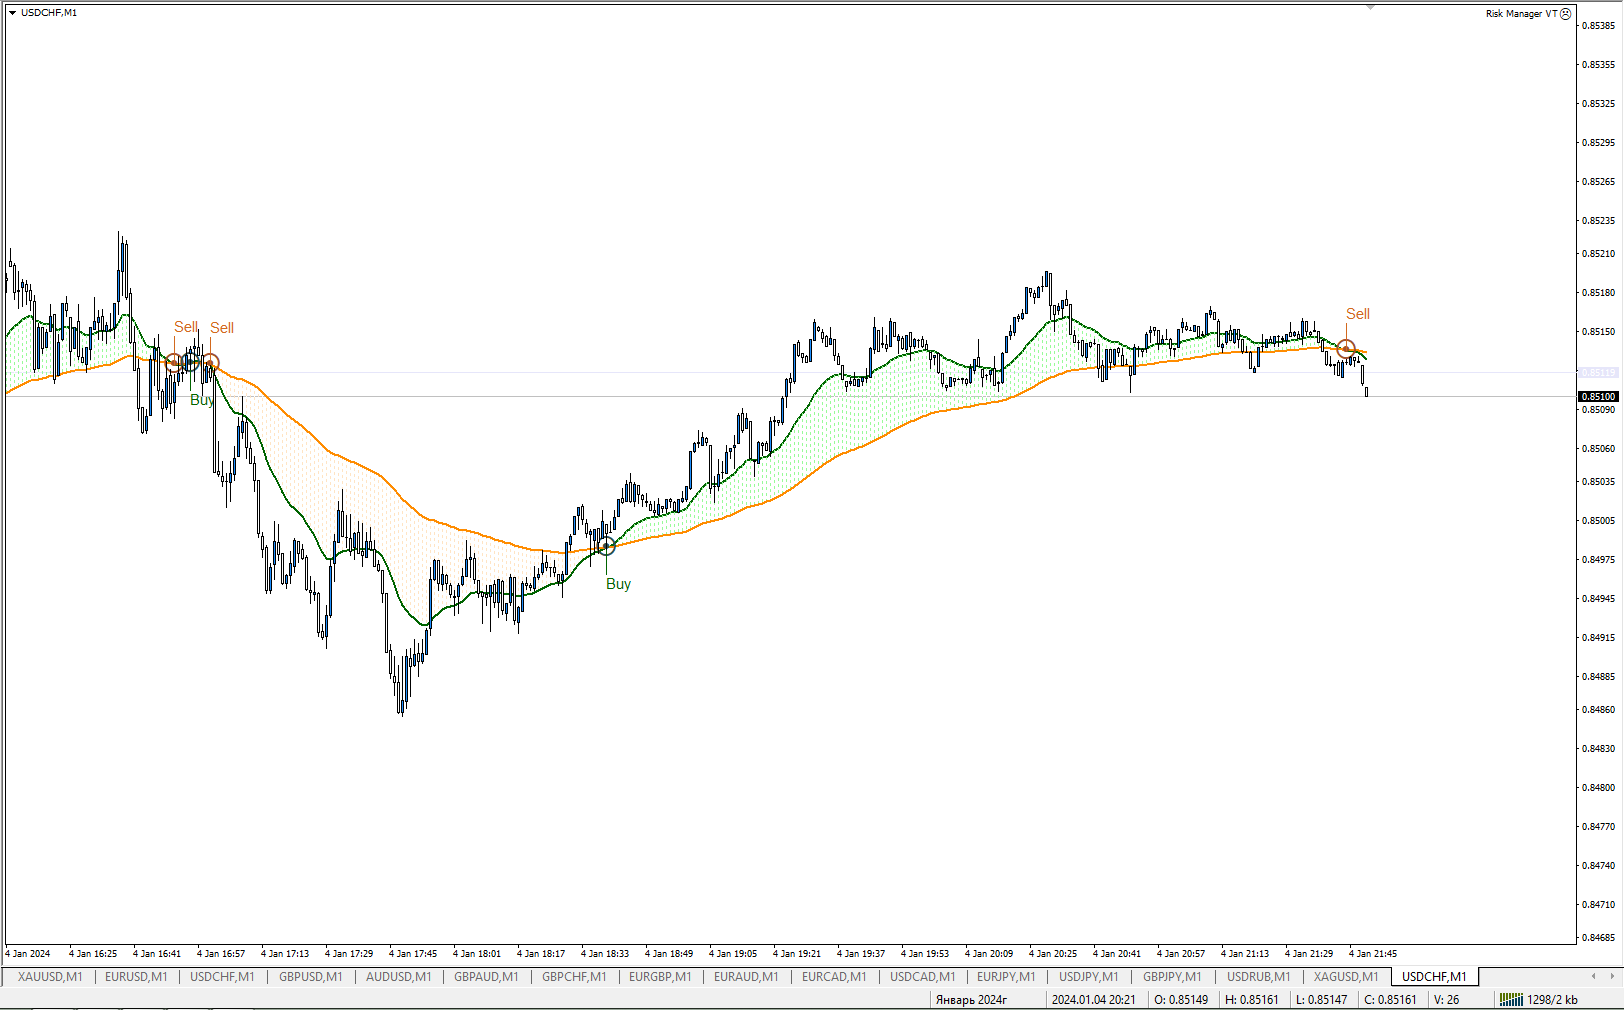
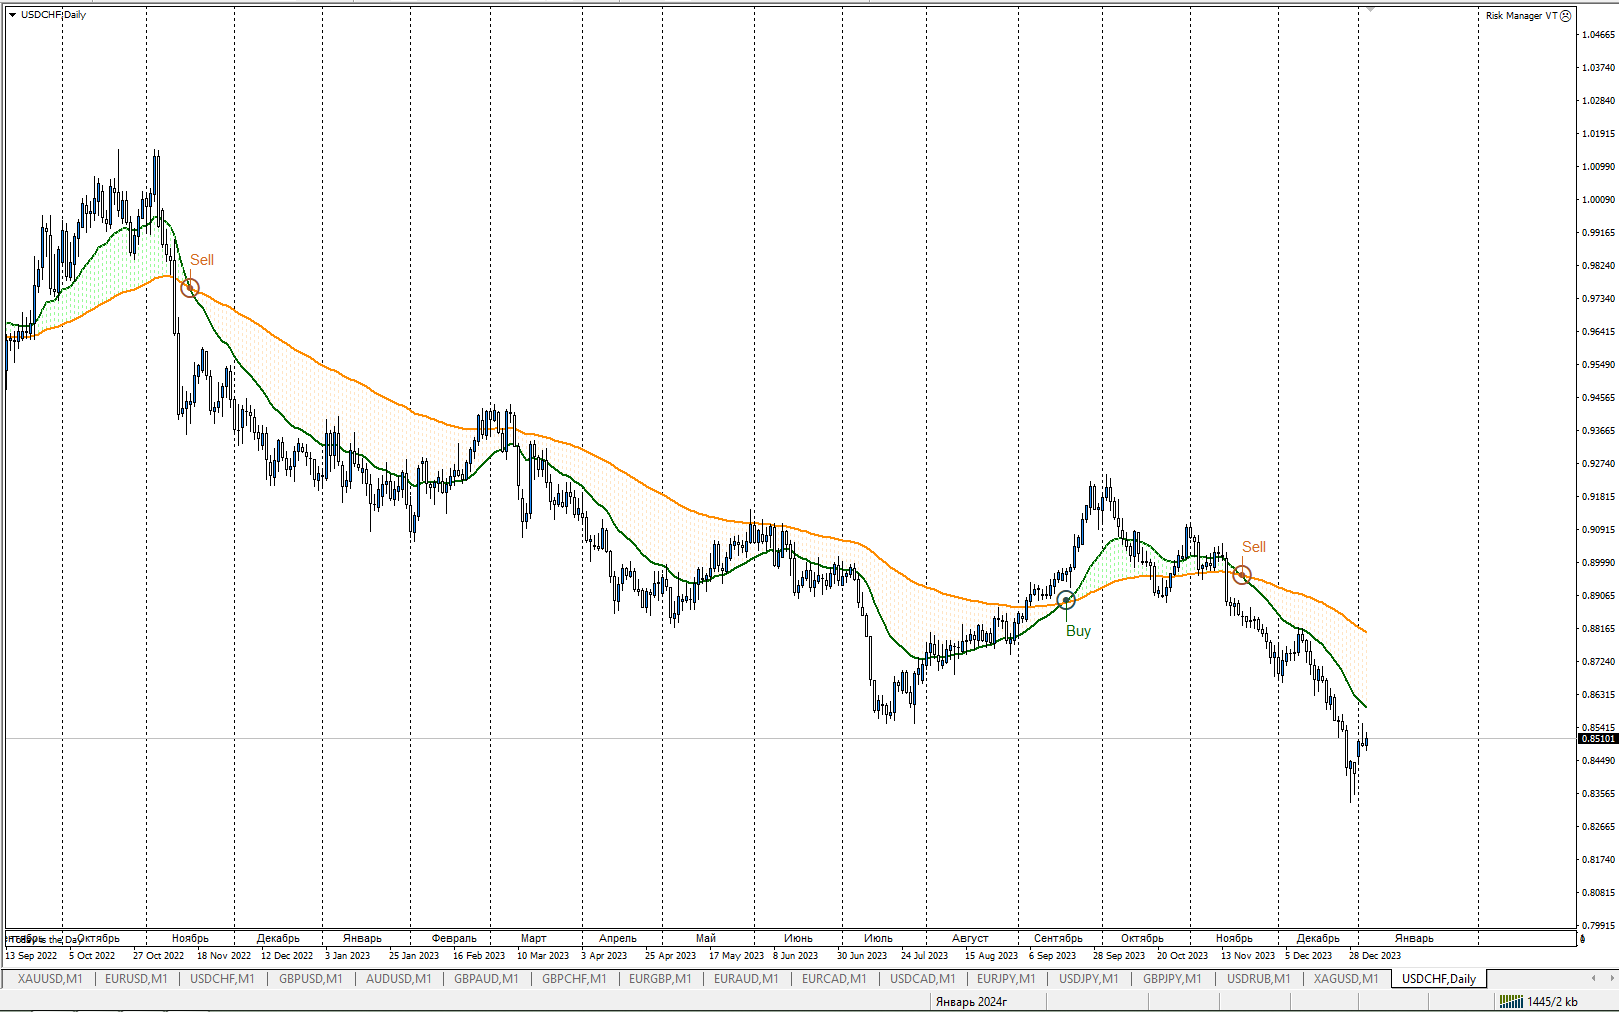
Este indicador visualiza la intersección de dos medias móviles. (SМА, EMA, SMMA, LWMA).
Ha sido creado para visibilidad de señales y notificación sobre intersecciones de Medias Móviles.
Media móvil es simplemente el valor promediado del precio para el marco de tiempo seleccionado (TF).
Por lo tanto, las medias móviles se utilizan en una amplia variedad de marcos temporales, desde 1 minuto hasta un año e incluso décadas.
Posibles tipos de medias móviles en el indicador
- SMA (Media móvil simple);
- EMA (Media móvil exponencial);
- SMMA (Media móvil suavizada);
- LWMA (Media móvil lineal ponderada);
El indicador tiene la capacidad de cambiar los colores y los períodos de la Media Móvil. Con la comprensión correcta, el indicador muestra visualmente la dirección de la tendencia para el instrumento de divisas.
La intersección de medias móviles de diferentes períodos y tipos es la estrategia más simple y más común de la variedad de métodos de negociación de Forex.
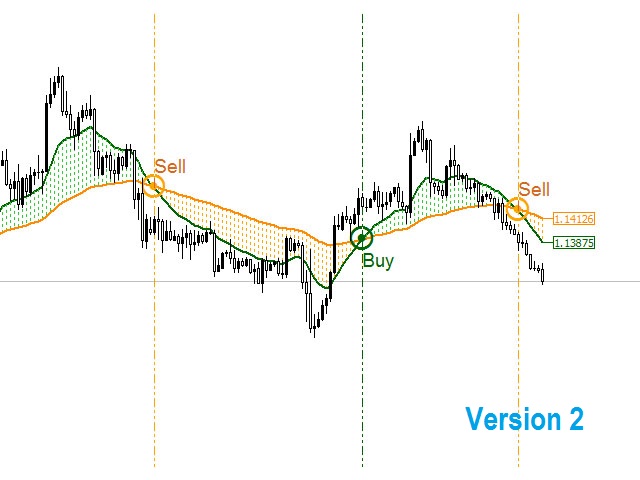
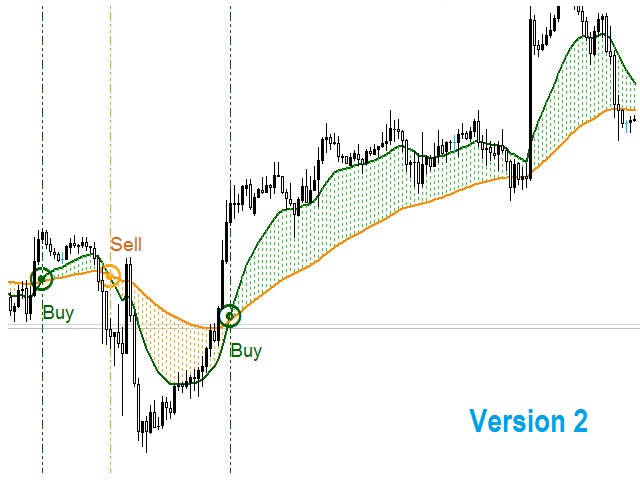
Por ejemplo, si una MA con un período más pequeño (rápido) cruza una MA con un período largo (lento), entonces aparece una señal, indicando una entrada en la dirección de la tendencia.
En una intersección inversa, la tendencia puede cambiar, generando una señal para salir de las operaciones actuales y entrar en la otra dirección.
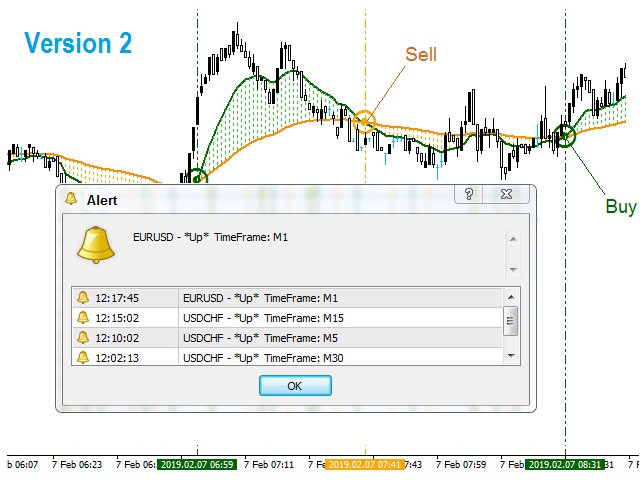
Notificación de intersección
Cuando dos medias móviles se cruzan, se crea la señal de cruce EMA:
- Notificación sonora.
- Dibuja un icono gráfico en el punto de intersección.
- Abre un cuadro de alerta, que contiene la hora de la intersección, el nombre del instrumento monetario, el marco temporal (TF) y el nombre de la señal de entrada ("Down" o "Up").
Entradas por defecto del indicador
- PeriodMA_1 - periodo de la primera Media Móvil (rápida), por defecto: 19.
- MA_metod_1 - tipo de cálculo de la Media Móvil, por defecto: EMA.
- Appied_price_1 - tipo de precio utilizado en el cálculo de MA, por defecto: Precio de cierre.
- PeriodMA_2 - periodo de la segunda Media Móvil (lenta), por defecto: 79.
- MA_metod_2 - tipo de cálculo de la Media Móvil, por defecto: EMA.
- Appied_price_2 - tipo de precio utilizado en el cálculo de MA, por defecto: Precio de cierre.
- ShowArrows - mostrar intersección (iconos), por defecto: true;
- Arrows_code_up - código de caracteres para la señal de subida, por defecto: 164;
- Arrows_code_down - código de caracteres para la señal bajista, por defecto: 164;
- Width - ancho del icono, por defecto: 3.
- Num_cross - número de notificaciones en el historial del cuadro de alerta, por defecto: 5.
- ShowHistogram - rellenar el espacio entre medias móviles, por defecto: true.
Opciones de color del indicador por defecto
- 0 - color de relleno (histograma) para la señal "Down", por defecto: Siena.
- 1 - color de la media móvil (rápida), por defecto: Verde oscuro.
- 2 - color de relleno (histograma) para la señal "Up", por defecto: VerdeOscuro.
- 3 - Color de la media móvil (lenta), por defecto: Naranja oscuro: NaranjaOscuro.
- 4 - color del icono para las señales "Down", por defecto: NaranjaOscuro.
- 5 - color del icono para las señales "Up", por defecto: Lima.
Algunos consejos sobre la estrategia de intersección MA
- No abra operaciones en la otra dirección hasta que se produzca una intersección.
- Un movimiento que comenzó es probable que vuelva.
- Recuerde que las medias móviles también son niveles dinámicos de soporte y resistencia.