Round price levels alert
- Indicadores
- Versión: 5.2
- Actualizado: 4 enero 2024
- Activaciones: 10

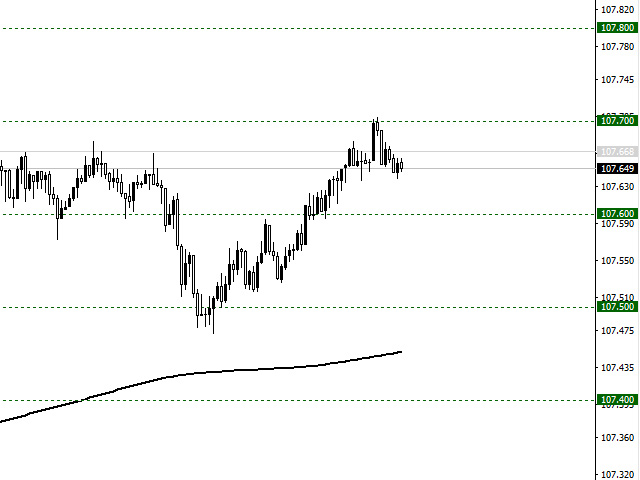
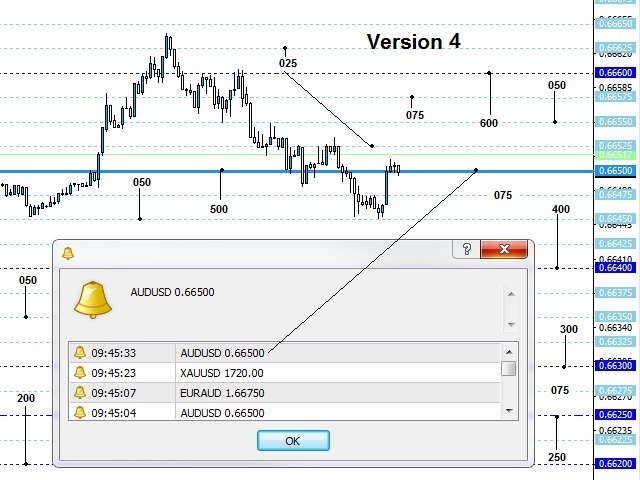
Un indicador de niveles redondos. Un rango de niveles de precios importantes con alertas sonoras y de texto, que se generan cuando el precio de oferta actual de un par de divisas es igual a un número redondo.
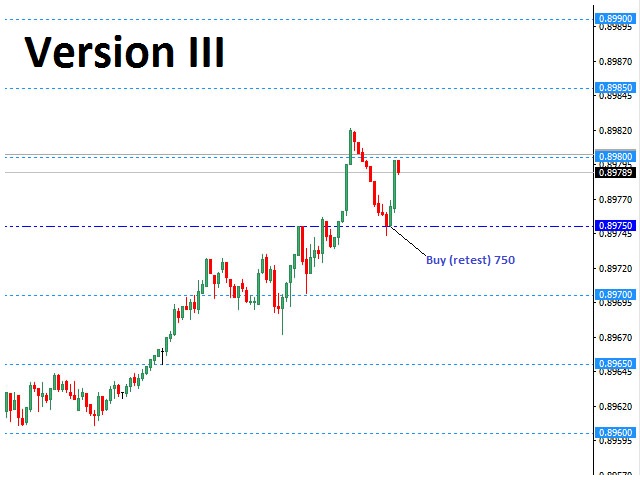
Este indicador muestra visualmente al trader los verdaderos niveles de soporte y resistencia, que son utilizados por la mayoría de los traders y robots de trading.
La ventaja de este indicador es que el operador que lo utiliza en un gráfico no necesita dibujar niveles adicionales.
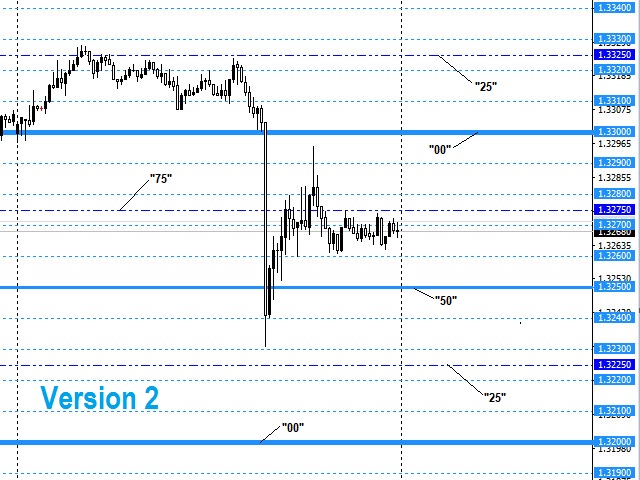
Los niveles de precio redondos representan una cierta barrera, por lo que podemos decir que los valores de precio que son múltiplos de cien (00) se pueden utilizar como niveles de soporte/resistencia para el precio.
Cómo funcionan los niveles redondos
Para los inversores que trabajan en plazos más altos o en plazos intradía más pequeños, es más fácil memorizar el número redondo siguiendo la dinámica de precios de los instrumentos financieros.
Se trata de un deseo humano común de simplificar las cosas. Los operadores también prefieren formas más sencillas. Por eso, los múltiplos de cien son tan atractivos.
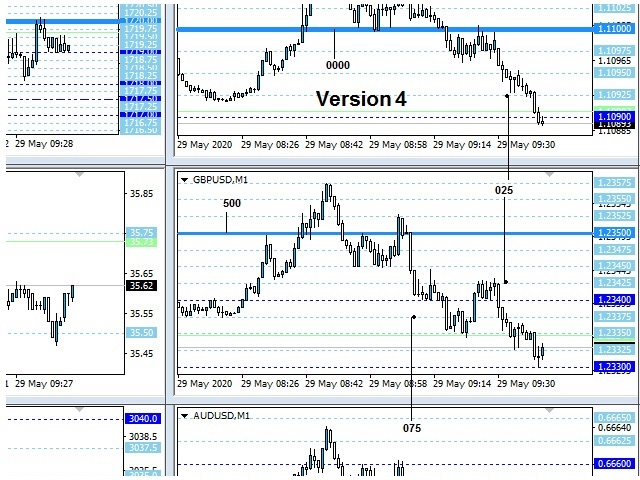
Así pues, la verdadera lucha entre toros y osos suele producirse en niveles como 1,23000, 1,4000, 1,23500, etc.
Al determinar quién ganó en ese momento en función del rebote o la ruptura en esos niveles, podemos unirnos a la mayoría de las órdenes abiertas en el mercado.
Al abrir operaciones en una ruptura de estos niveles, lo que ocurre más a menudo según las estadísticas, podemos colocar un Take Profit en el siguiente nivel de precios y así establecer la reserva mínima para el movimiento del precio.
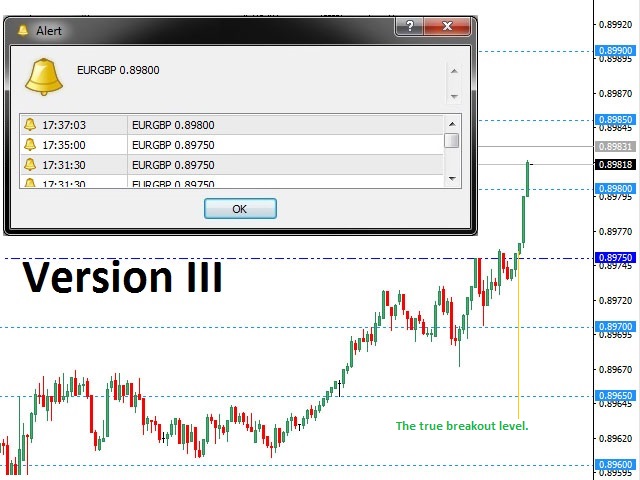
Cuando el precio se rompe y se consolida cerca de un nivel redondo, podemos abrir operaciones esperando la continuación del movimiento, ya que la barrera de precios fue superada, y establecer un Stop Loss detrás del nivel roto estableciendo así nuestros riesgos.
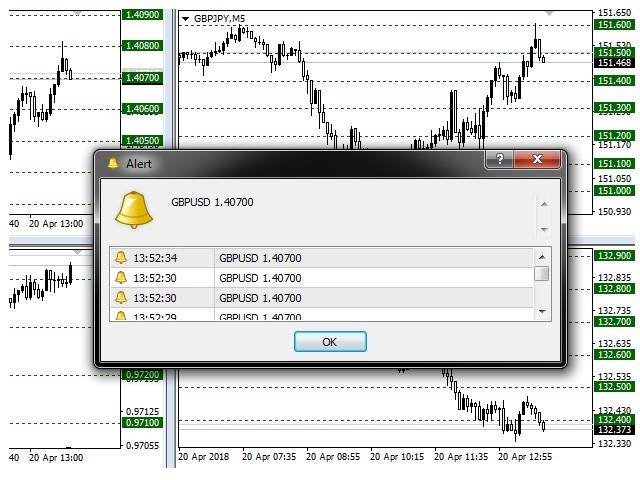
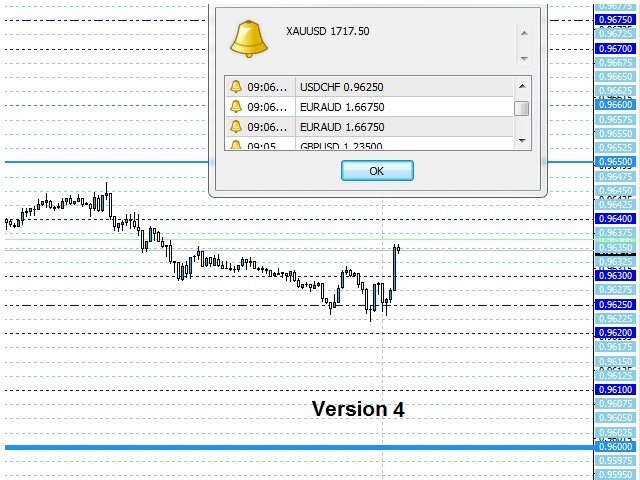
Alertas sonoras y de texto
Las alertas pueden ser habilitadas en los parámetros del indicador.
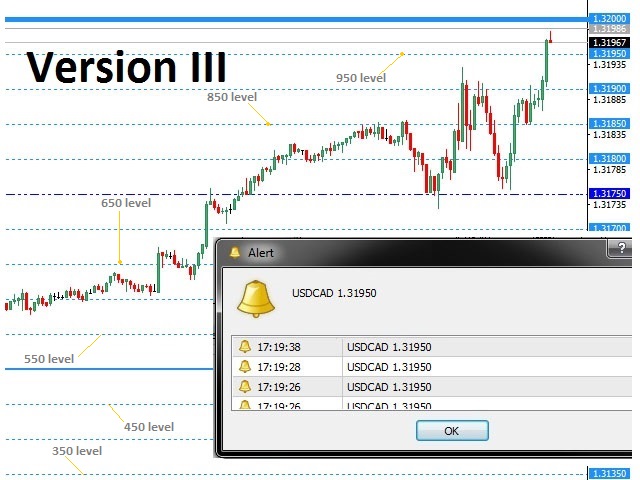
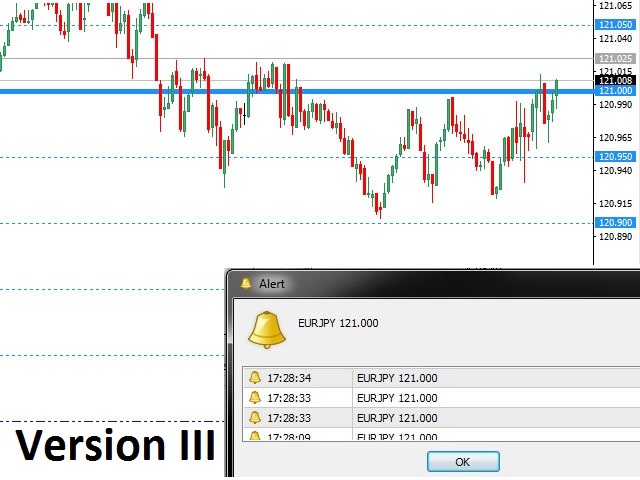
Cuando AlertPlay = true, el indicador mostrará un cuadro de diálogo cuando el precio del par de divisas alcance un nivel redondo. La alerta contiene información sobre el par de divisas y el precio de oferta actual.
Además, cuando se toca un nivel, se reproduce el sonido estándar "alert.wav".
Parámetros de entrada del indicador
- Mostrar 00 Niveles - mostrar el nivel redondo absoluto, por defecto es true.
- Mostrar 10 Niveles - muestra un nivel redondo múltiplo de cien, por defecto es true.
- Mostrar 20 Niveles - muestra el nivel de ronda 200, por defecto es verdadero.
- Mostrar 30 Niveles - muestra el nivel de ronda 300, por defecto es true.
- Mostrar 40 Niveles - muestra el nivel 400, por defecto es verdadero.
- Mostrar 50 niveles - muestra el nivel 500, por defecto es verdadero.
- Mostrar 60 niveles - muestra el nivel 600, por defecto es verdadero.
- Mostrar 70 niveles - muestra el nivel 700, por defecto es verdadero.
- Mostrar 80 niveles - muestra el nivel 800, por defecto es verdadero.
- Mostrar 90 Niveles - muestra el nivel 900, por defecto es verdadero.
- Mostrar 20 Niveles - muestra el nivel 200, por defecto es verdadero.
- Niveles 00 Color - el color del nivel de ronda absoluto, por defecto es Verde Oscuro.
- Niveles 10 Color - el color del nivel de ronda múltiplo de cien, por defecto es Verde Oscuro.
- Niveles 20 Color - el color del nivel redondo múltiplo de 200, por defecto es VerdeOscuro.
- Niveles 30 Color - el color del nivel 300, por defecto es VerdeOscuro.
- Niveles 40 Color - el color del nivel 400, por defecto es VerdeOscuro.
- Niveles 50 Color - el color del nivel 500, por defecto es VerdeOscuro.
- Niveles 60 Color - el color del nivel 600, por defecto es VerdeOscuro.
- Niveles 70 Color - el color del nivel 700, por defecto es VerdeOscuro.
- Niveles 80 Color - el color del nivel 800, por defecto es VerdeOscuro.
- Niveles 90 Color - el color del nivel 900, por defecto es Verde Oscuro.
- Ancho 00; 10; 20; 30; 40; 50; 60; 70; 80; 90 - el ancho de los niveles redondos, por defecto es 1.
- Estilo de Nivel - los estilos de niveles redondos con el ancho de 1, por defecto es Punto.
- AlertPlay - activar/desactivar el sonido y la alerta de texto, por defecto es false (desactivado).
Nota: el indicador se puede utilizar en todos los instrumentos de negociación. El marco temporal recomendado es M15.
Los niveles de precios redondos pueden desactivarse en marcos temporales superiores.