ATR Sessions Pips
- Indicadores
- Versión: 5.3
- Actualizado: 3 abril 2024
- Activaciones: 10

Otro sencillo indicador de información que muestra las sesiones de negociación más importantes del mercado de divisas.
Sobre el concepto de sesiones de negociación.
Todo el mundo sabe que una sesión de negociación es un periodo de tiempo durante el cual los bancos y otros participantes del mercado
negocian activamente, y se activan durante determinadas horas de la jornada laboral.
Los mercados de divisas, acciones y materias primas funcionan las veinticuatro horas del día, de lunes a viernes, excepto los días festivos .
Mientras un país sigue durmiendo, en otro la jornada laboral está en pleno apogeo, y en otro está empezando o llegando ya a su fin.
En el terminal comercial MetaTrader 4, las marcas horarias estándar sólo se muestran al comienzo de un nuevo día.
Estos periodos están separados por líneas de puntos verticales, que pueden activarse y desactivarse simplemente pulsando la combinación de teclas "Ctrl + Y".
Funcionamiento del indicador.
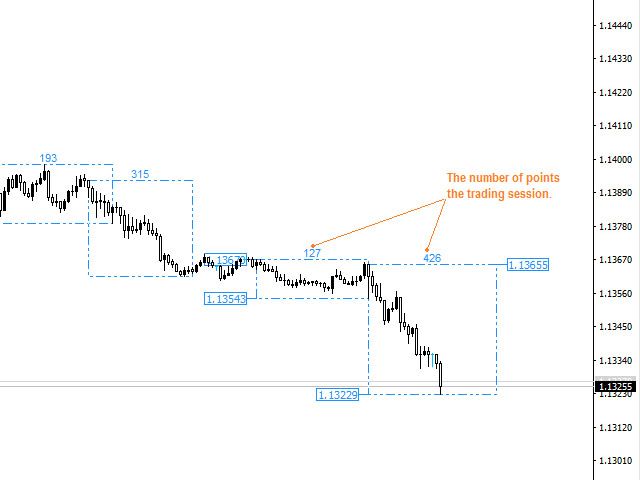
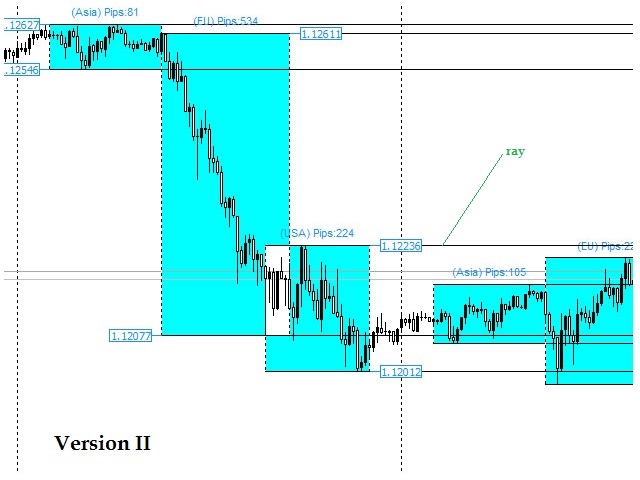
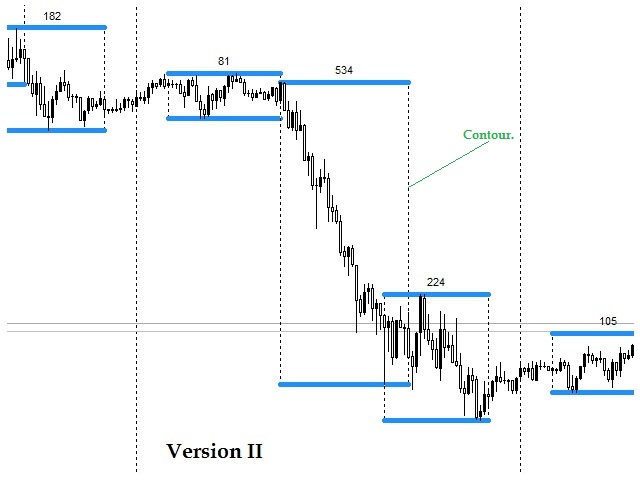
Este indicador muestra claramente en el gráfico el comienzo, el final, los máximos y los mínimos de las sesiones de negociación.
Así como el número de puntos transcurridos por el precio (TAE), las sesiones pasadas y la sesión que está activa ahora.
Al añadirlo a un gráfico, coloca objetos gráficos relacionados con las sesiones de negociación.
El color, el tamaño del texto, las etiquetas de precios y los estilos de todos los objetos gráficos, así como la configuración de la hora de las sesiones de negociación del indicador,
se pueden cambiar en los parámetros de entrada.
El indicador hace que sea muy fácil de entender el gráfico y los movimientos de precios para el período de tiempo pasado y actual.
Se considera que las principales sesiones de negociación son :
- Asiática (Asia)
- Europea
- Americana (América)
Nota 1: También existe la sesión australiana (Pacífico),
, pero es menos volátil y de corta duración. No se muestra en el Indicador.
Nota 2: Cada una de las sesiones de negociación del mundo difiere de las demás no sólo en el horario de trabajo,
, sino también en algunas características específicas de la negociación .
Parámetros del indicador
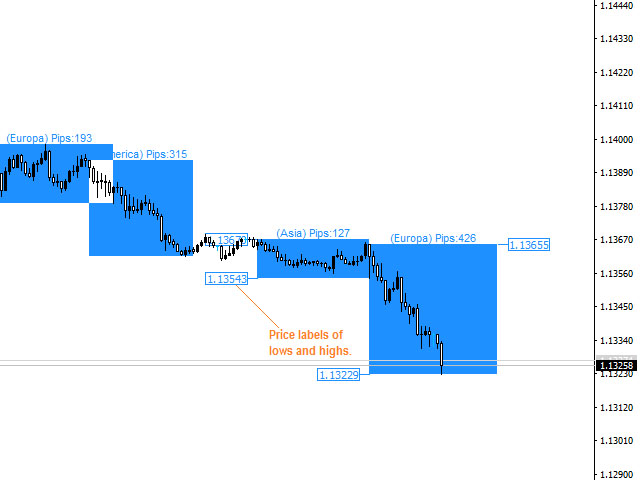
- Show price tags high and low sessions current day - Mostrar etiquetas de precios de las sesiones de negociación del día actual, por defecto: True.
- Color Price Tags trading sessions - Color de las etiquetas de precio, por defecto: DodgerBlue.
- Size Price Tags trading sessions - Tamaño de las etiquetas de precios , por defecto: 1.
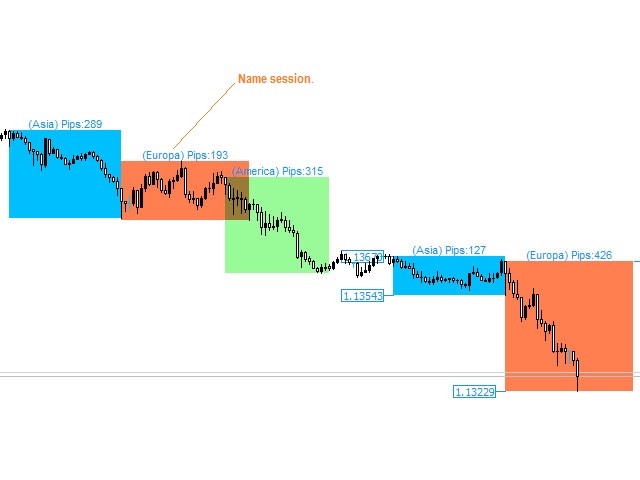
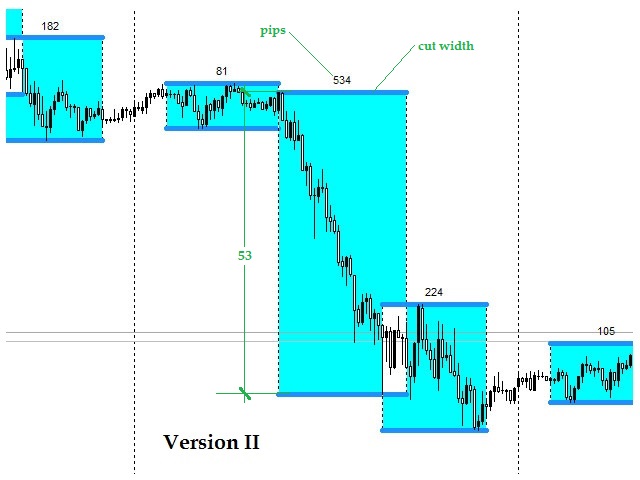
- Mostrar el nombre y ATR sesiones - Mostrar el nombre de las sesiones de negociación y ATR (el número de pips entre el mínimo y el máximo para la sesión de negociación), por defecto: true.
- Activar/ Desactivar el nombre de las sesiones - Activar / Desactivar sólo el nombre de la TS, por defecto: falso.
- El color de los nombres de los nombres de la sesión y ATR - El color del texto ATR y puntos pasados, por defecto: DodgerBlue.
- El tamaño de fuentede los nombres de los nombres de la sesión y ATR - Tamaño del texto, por defecto: 8.
- Lasangría delnombre de la fuente dela sesión y ATR - Lasangría del texto desde el rectángulo de las sesiones de negociación hacia arriba, por defecto: 20.
- El número de días de sesiones de negociación se muestran - Número de días de sesiones denegociación que se mostrará por el indicador, por defecto: 5. (si hay muchas líneas de reducir a 2.)
- Horario de apertura de la sesión asiática - Horario de apertura de la sesión de negociación asiática, por defecto: 02:00. (hora de Moscú)
- Hora de cierre dela sesión asiática- Hora de cierre de la sesión asiática, por defecto: 09:00. (hora de Moscú). (hora de Moscú)
- El rectángulo de color de la sesión asiática - El rectángulo de color de la sesión de negociación asiática, por defecto: DodgerBlue.
- Horario de apertura de la sesión europea - Horario de apertura de la sesión de negociación europea, por defecto: 09:00. (hora de Moscú)
- Horario de cierre de la sesióneuropea - Horario de cierre de la sesión de negociacióneuropea , por defecto: 17:00. (hora de Moscú). (hora de Moscú)
- El rectángulo de color de la sesión europea - El rectángulo de color de la sesión de negociacióneuropea , por defecto: DodgerBlue.
- Horario de apertura de la sesiónamericana - Horario de apertura de la sesión americana, por defecto: 15:30. (hora de Moscú)
- Horario de cierre de la sesiónamericana - Horario de cierre de la sesión de negociaciónamericana , por defecto: 22:00. (hora de Moscú)
- El rectángulo de color de la sesión americana -El rectángulo de color de la sesión de negociación americana, por defecto: DodgerBlue.
Nota: El indicador es adecuado para trabajar con cualquier color de fondo del gráfico y es muy conveniente para el análisis de los movimientos de precios en el tiempo.
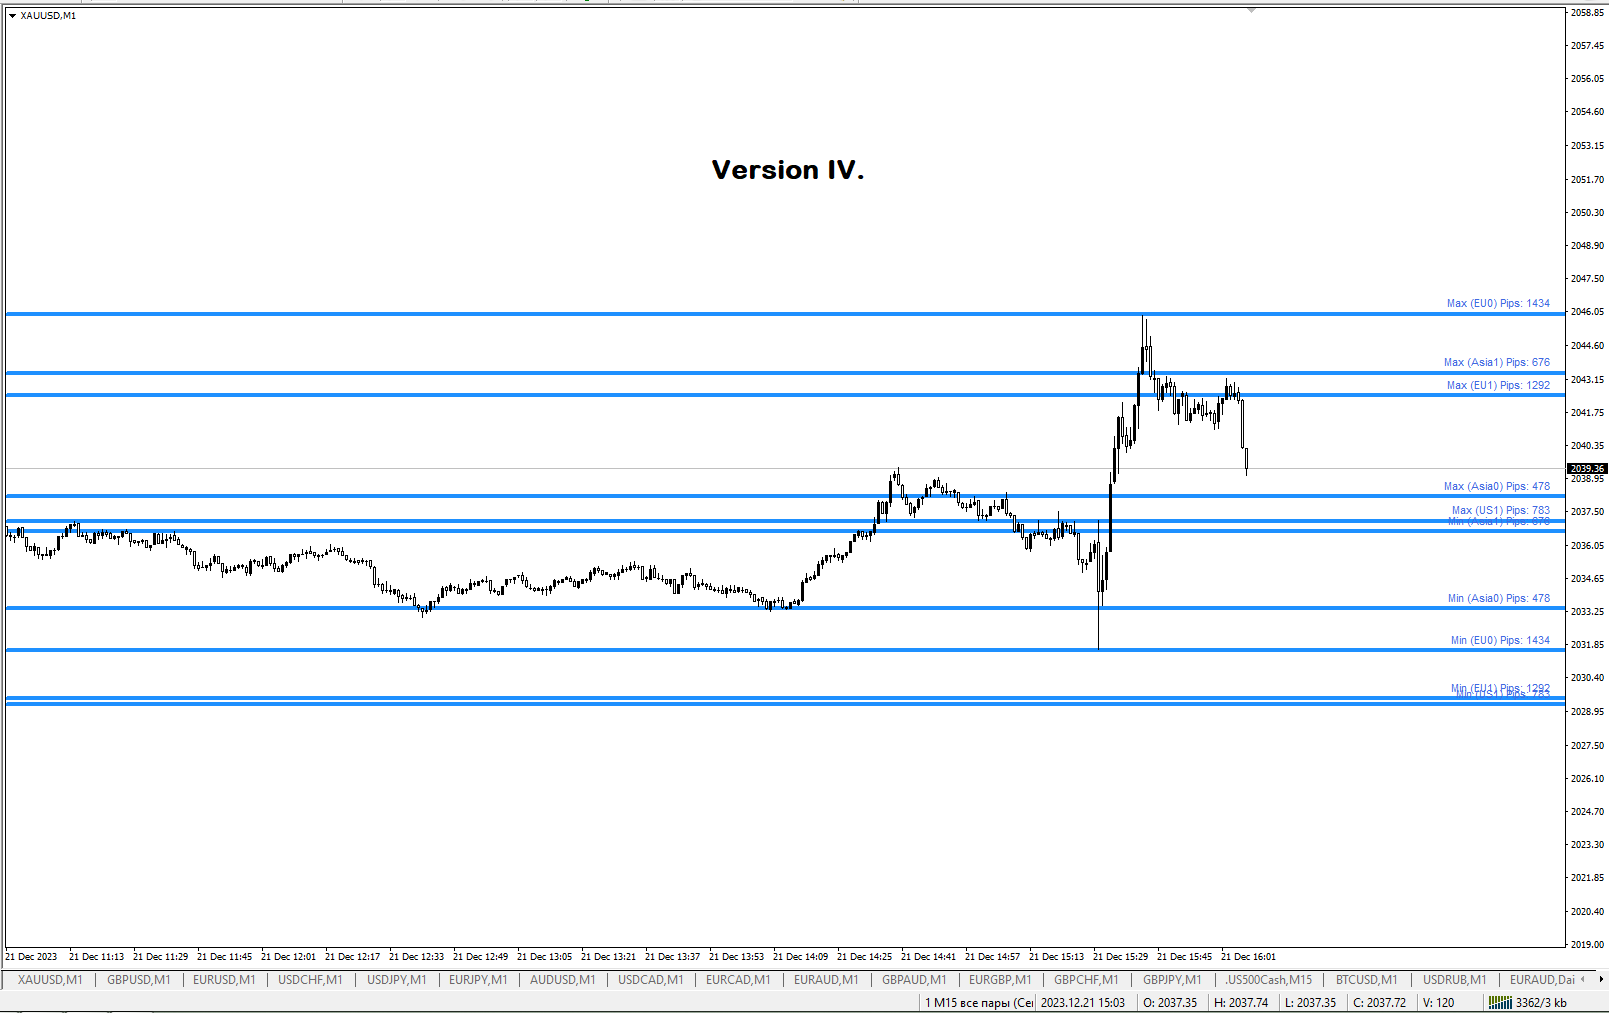
Nota: En la versión IV del indicador se ha añadido el texto Mínimo y Máximo (max min) en los nombres de las sesiones de negociación.
Por ejemplo: Min (Asia0) Pips: 478 - donde 0 es el día de hoy. Es decir, el mínimo de la sesión asiática de hoy.
Si 1, entonces el día antes de ayer. Si 2, entonces el día antes de ayer... etc.
Importante: La visualización por defecto del número de días y sesiones de negociación en ellos puede exceder su percepción visual de los niveles. (puede hacerlo más pequeño).
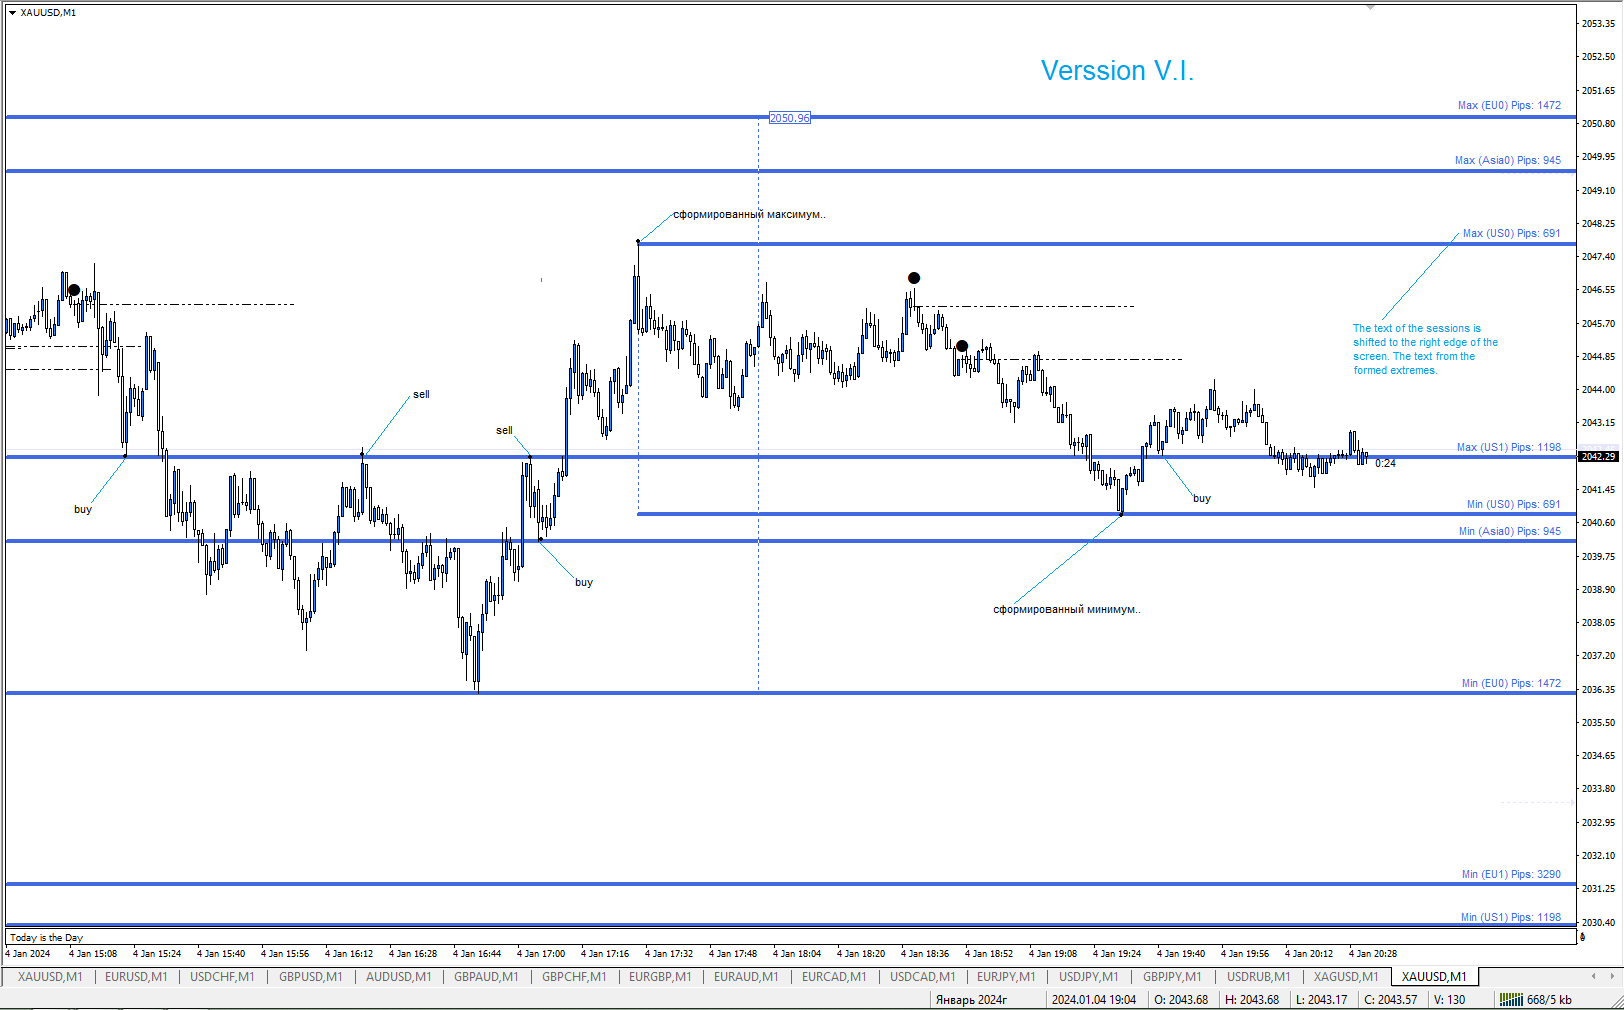
Desplazar el texto es muy conveniente en marcos temporales no superiores a M15. Si el indicador no se dibuja, espere a un nuevo Tick, es decir, a una actualización de la cotización.
Nuevos parámetros importantes del indicador:
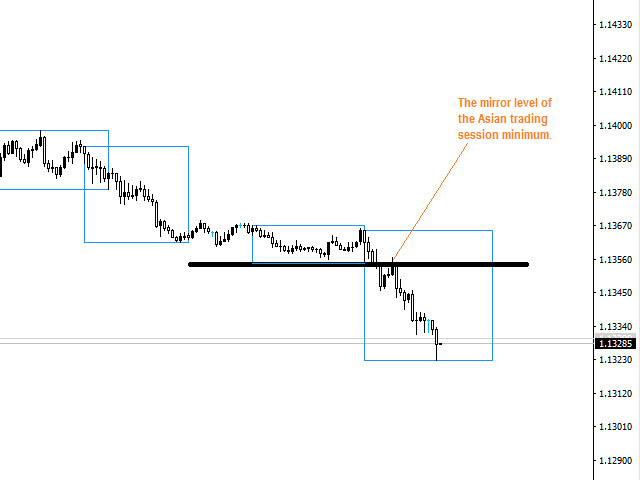
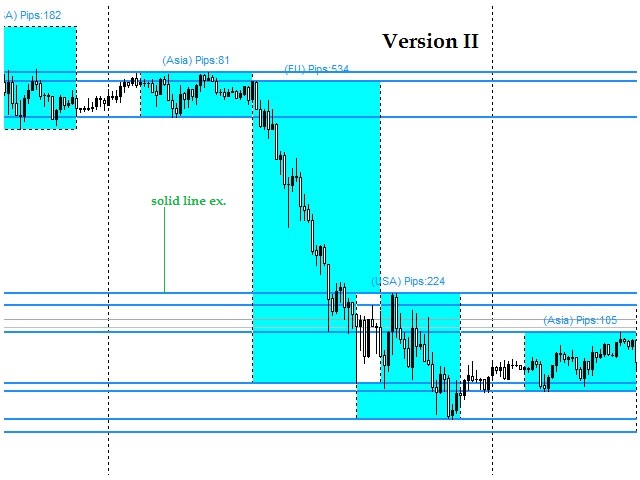
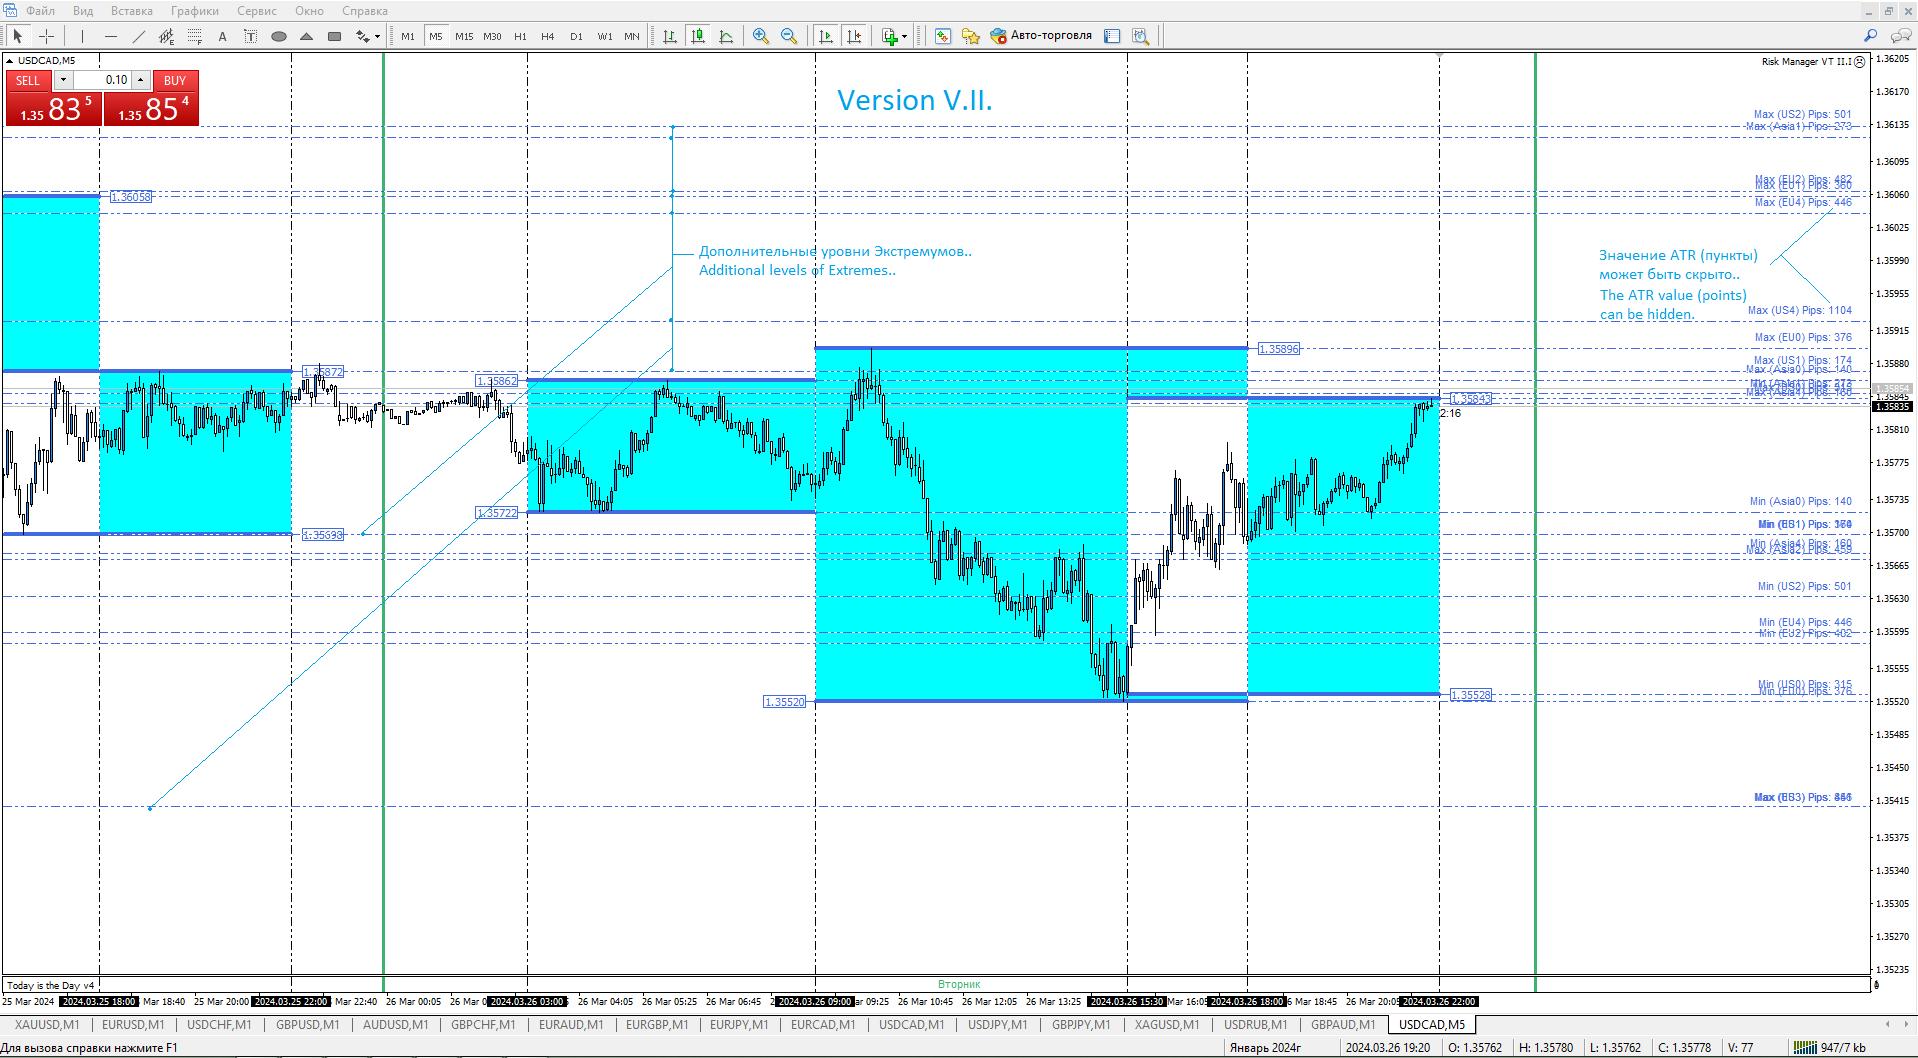
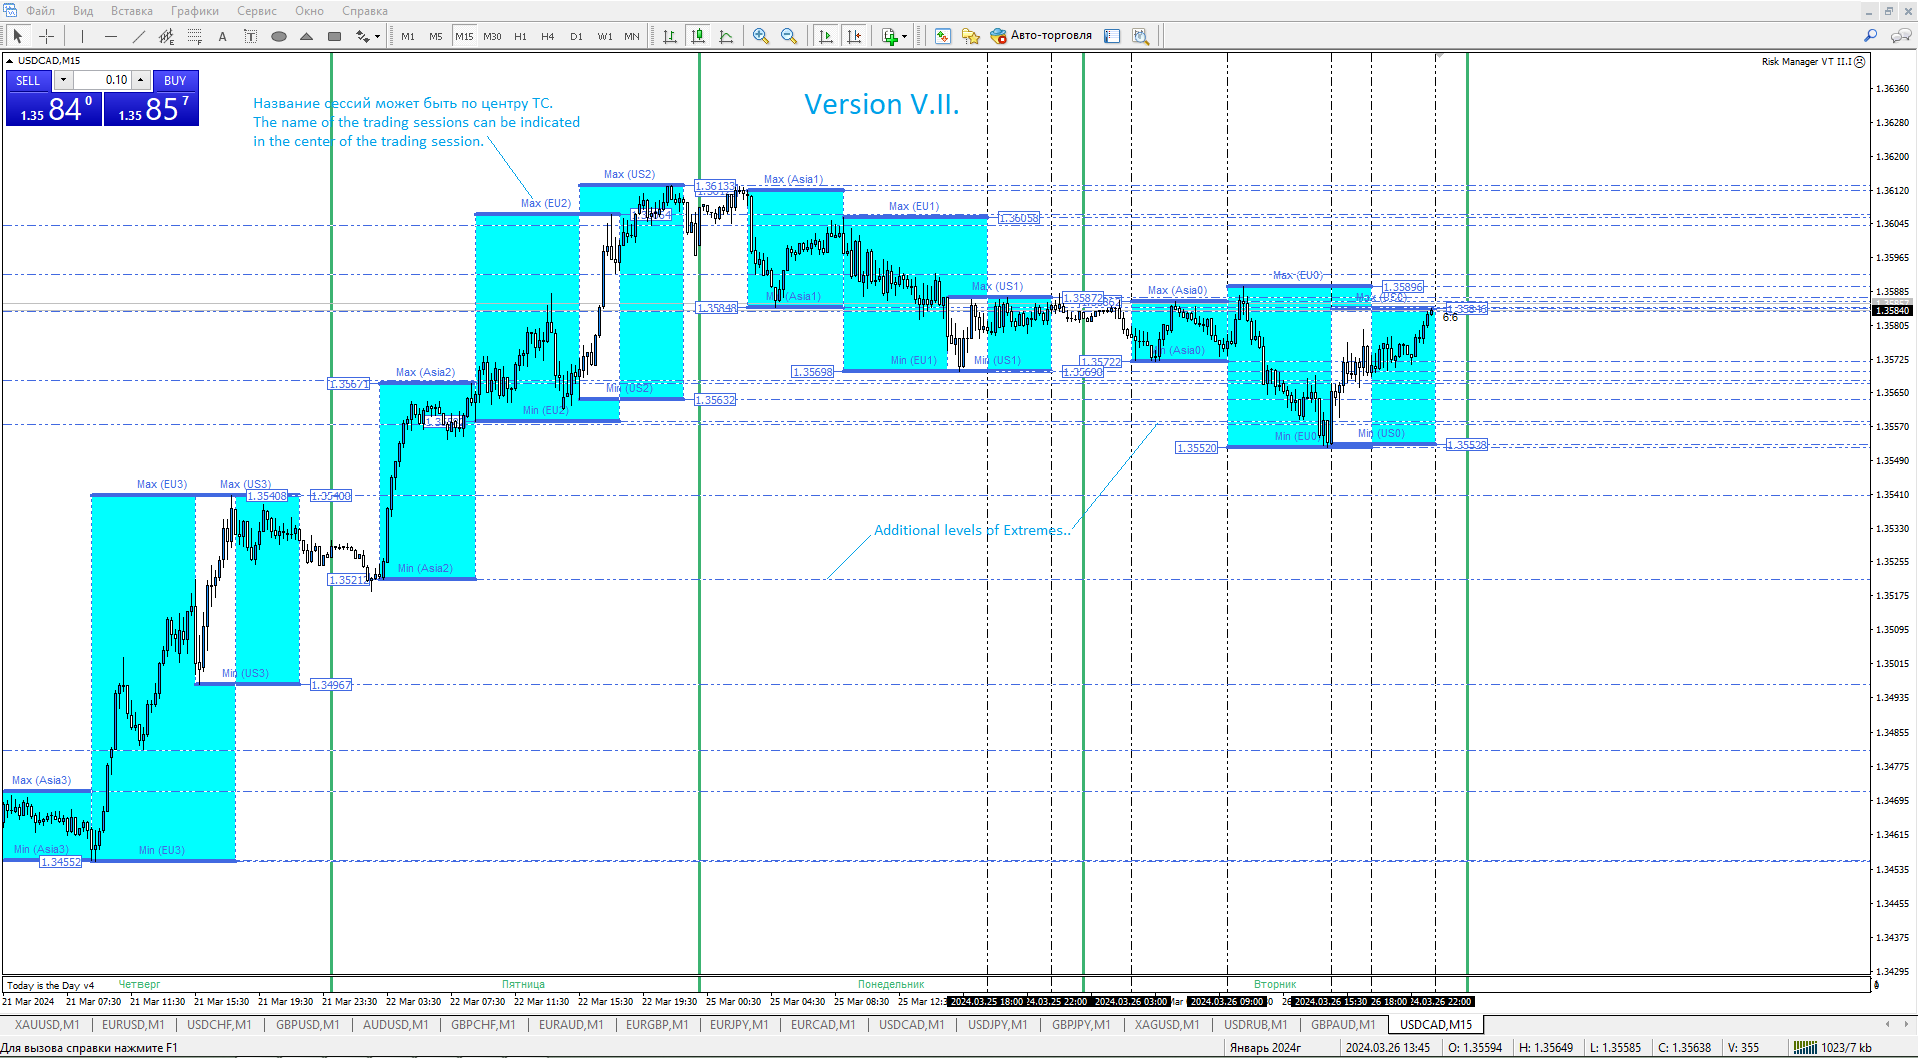
1. Añadidos niveles adicionales de extremos.
2. El nombre de los niveles y el valor ATR pueden desplazarse hacia la derecha.
3. El valor numérico ATR, en puntos, se puede desactivar.
4. 4. Se pueden desactivar los niveles Extremum adicionales.
5. Se puede cambiar el número de días que se muestran las sesiones.
6. Puede activar y desactivar el relleno de los cuadros de sesión.
Cuando se muestra el texto indicador, por ejemplo:
1. Max(EU0) es el máximo de la sesión europea "hoy".
1.1. Min(EU0) es el mínimo de la sesión europea "hoy".
2. Max(EU1) es el máximo de la sesión europea "ayer".
2.1. Min(EU1) es el mínimo de la sesión europea "ayer".
3. Max(EU2) es el máximo de la sesión europea de "anteayer".
3.1. Min(EU2) es el mínimo de la sesión europea de "anteayer". etc. .... 3,4,5.
Lo mismo con otras sesiones de negociación. US1. US2. US3... y así sucesivamente... donde
US1 es la sesión de ayer. La de hoy es el valor con el número 0.
El número 5 es la sesión de hace cinco días. Por ejemplo: Max(Asia5). Es el máximo
de la sesión asiática de hace cinco días.