History VT
- Indicadores
- Versión: 1.4
- Actualizado: 14 abril 2024

Historia VT
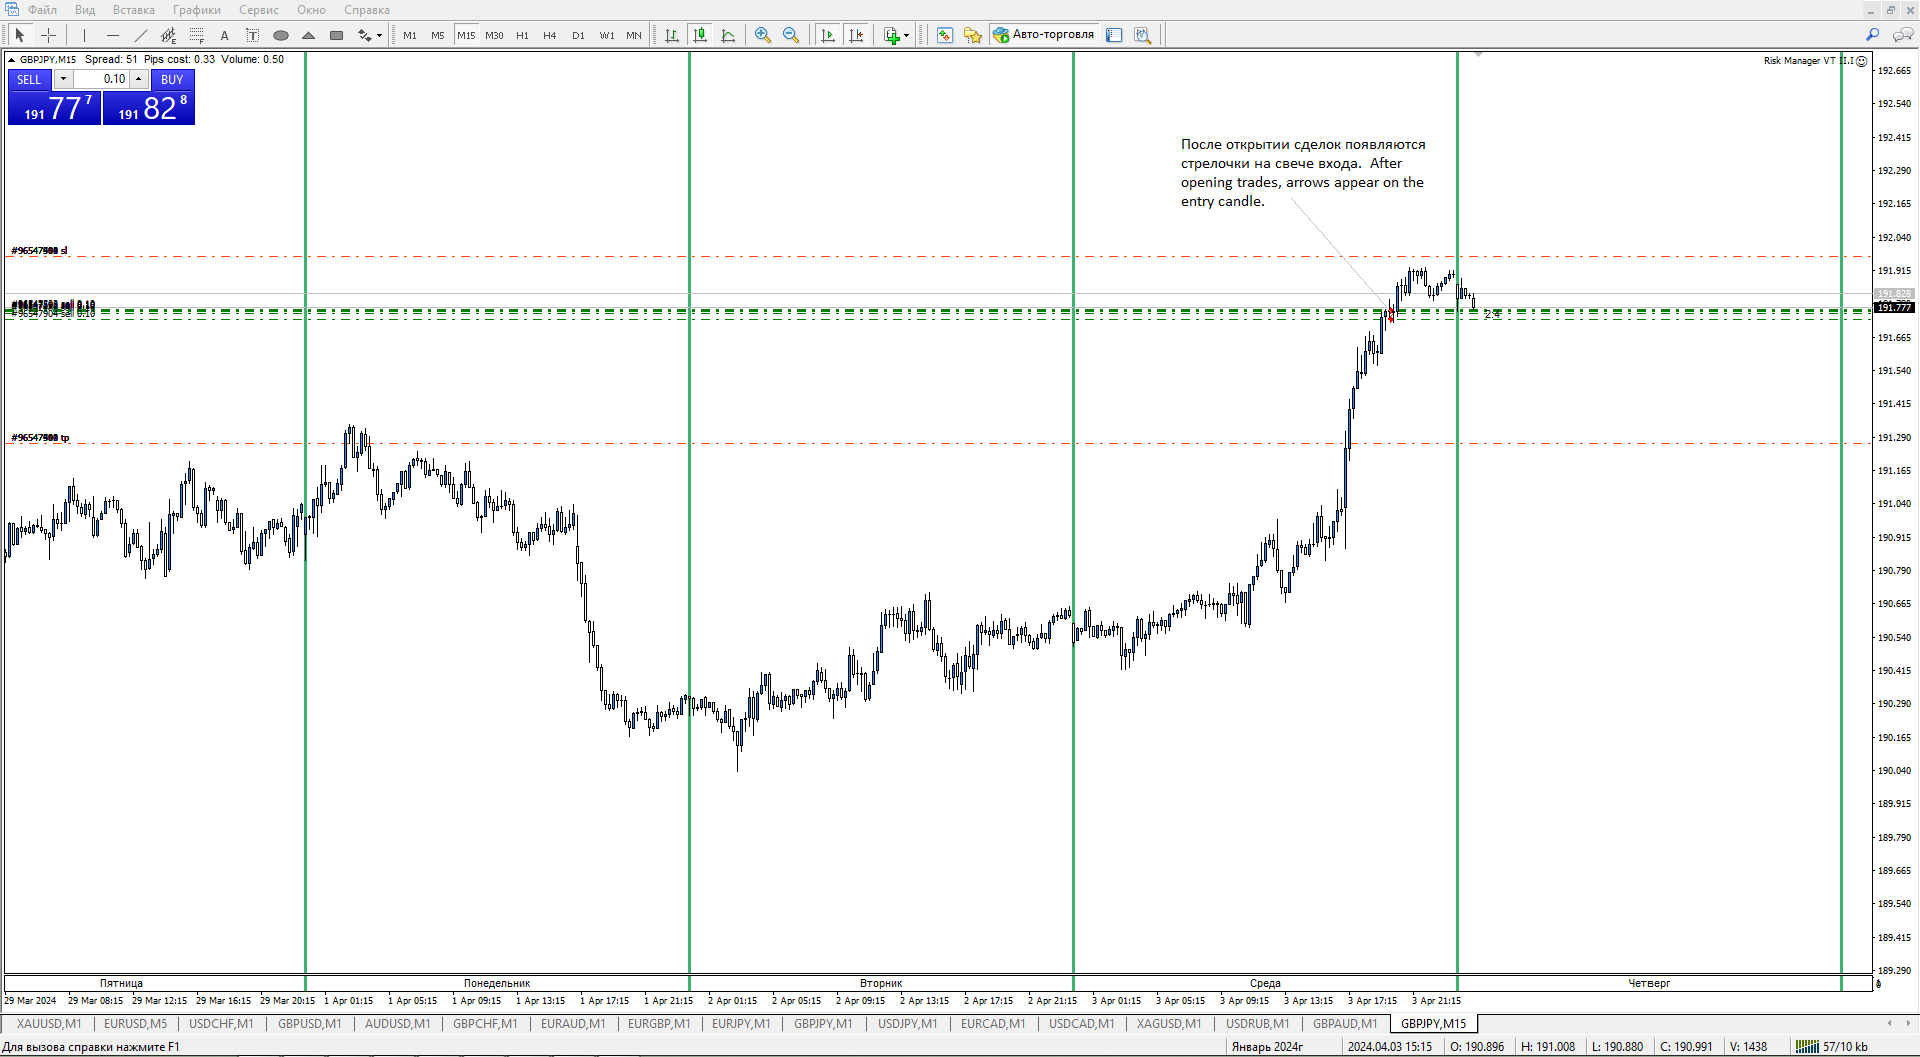
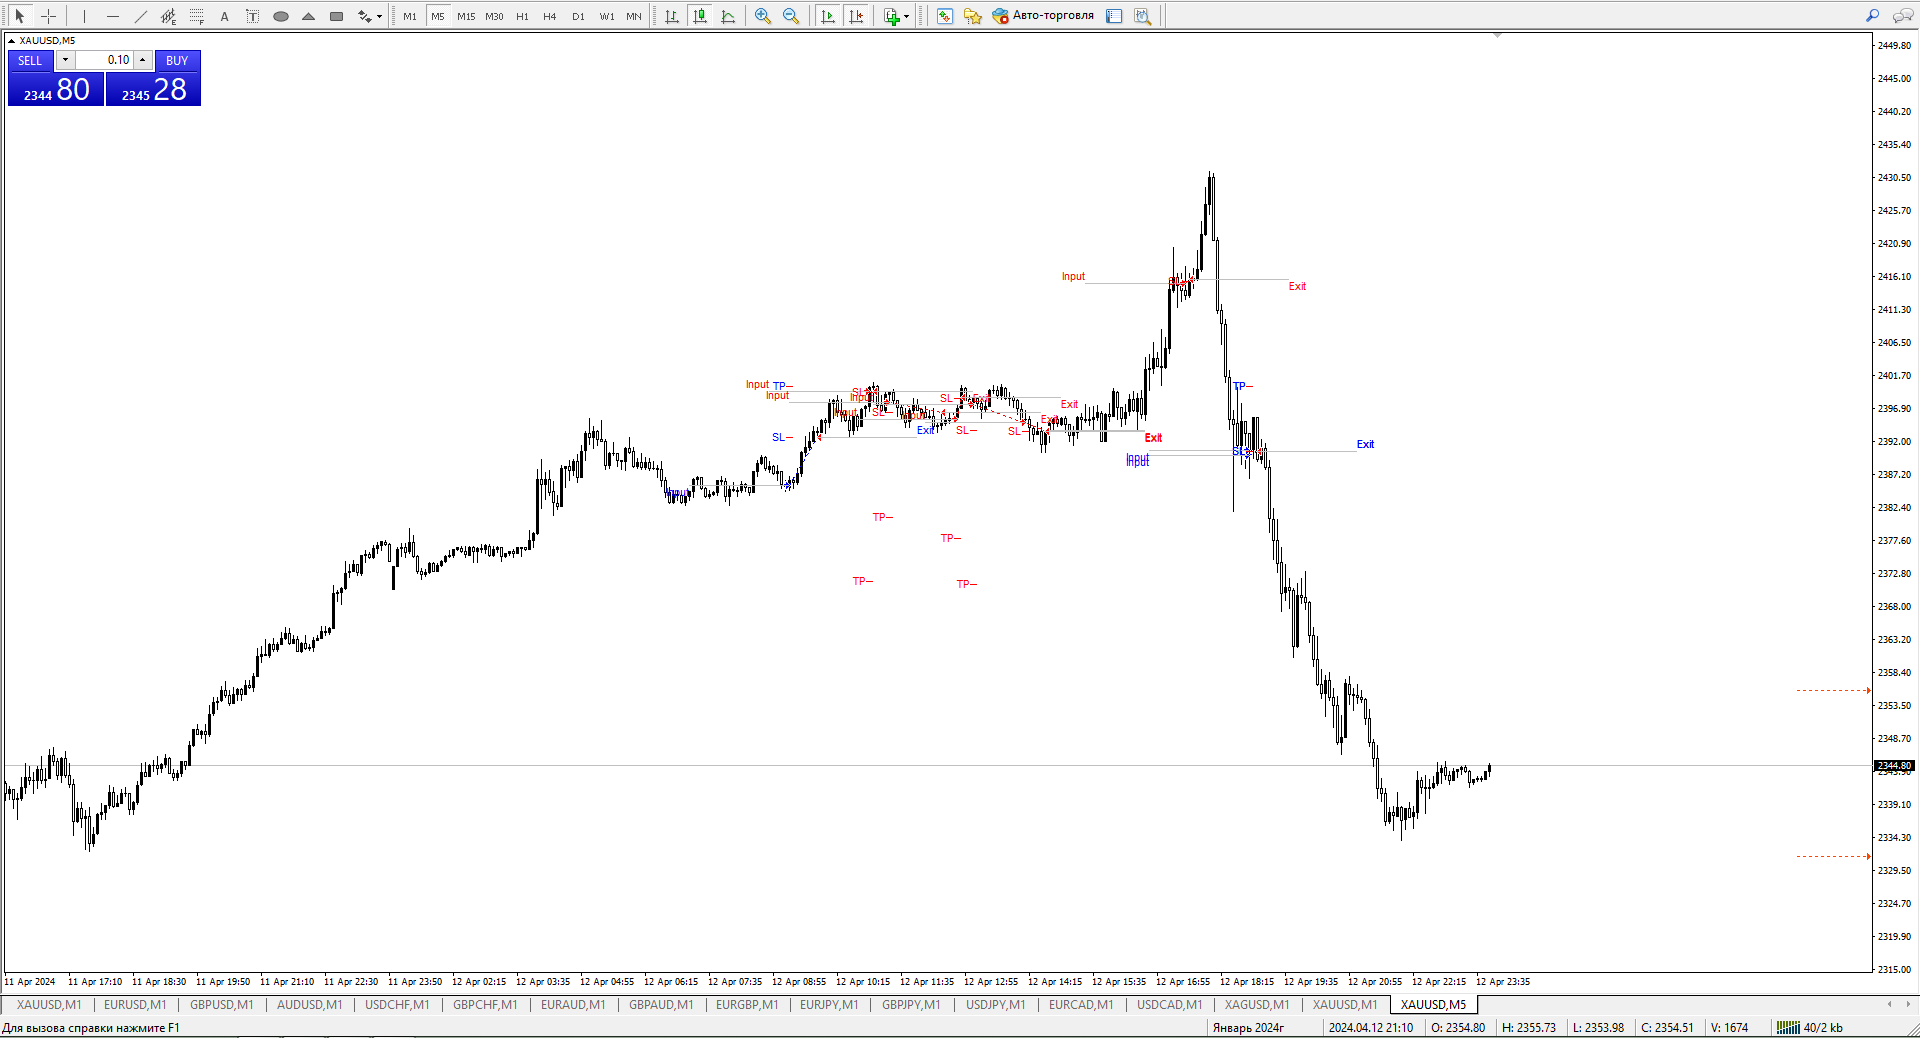
Indicador informativo. Muestra en el gráfico, inmediatamente después de abrir una operación, una flecha en la vela japonesa donde está abierta la posición.
Es decir, donde aparece la línea discontinua de una operación abierta en el terminal.
Además, después de abrir una operación, como de costumbre, el operador pone SL y TP y espera el resultado de su elección de la dirección del movimiento.
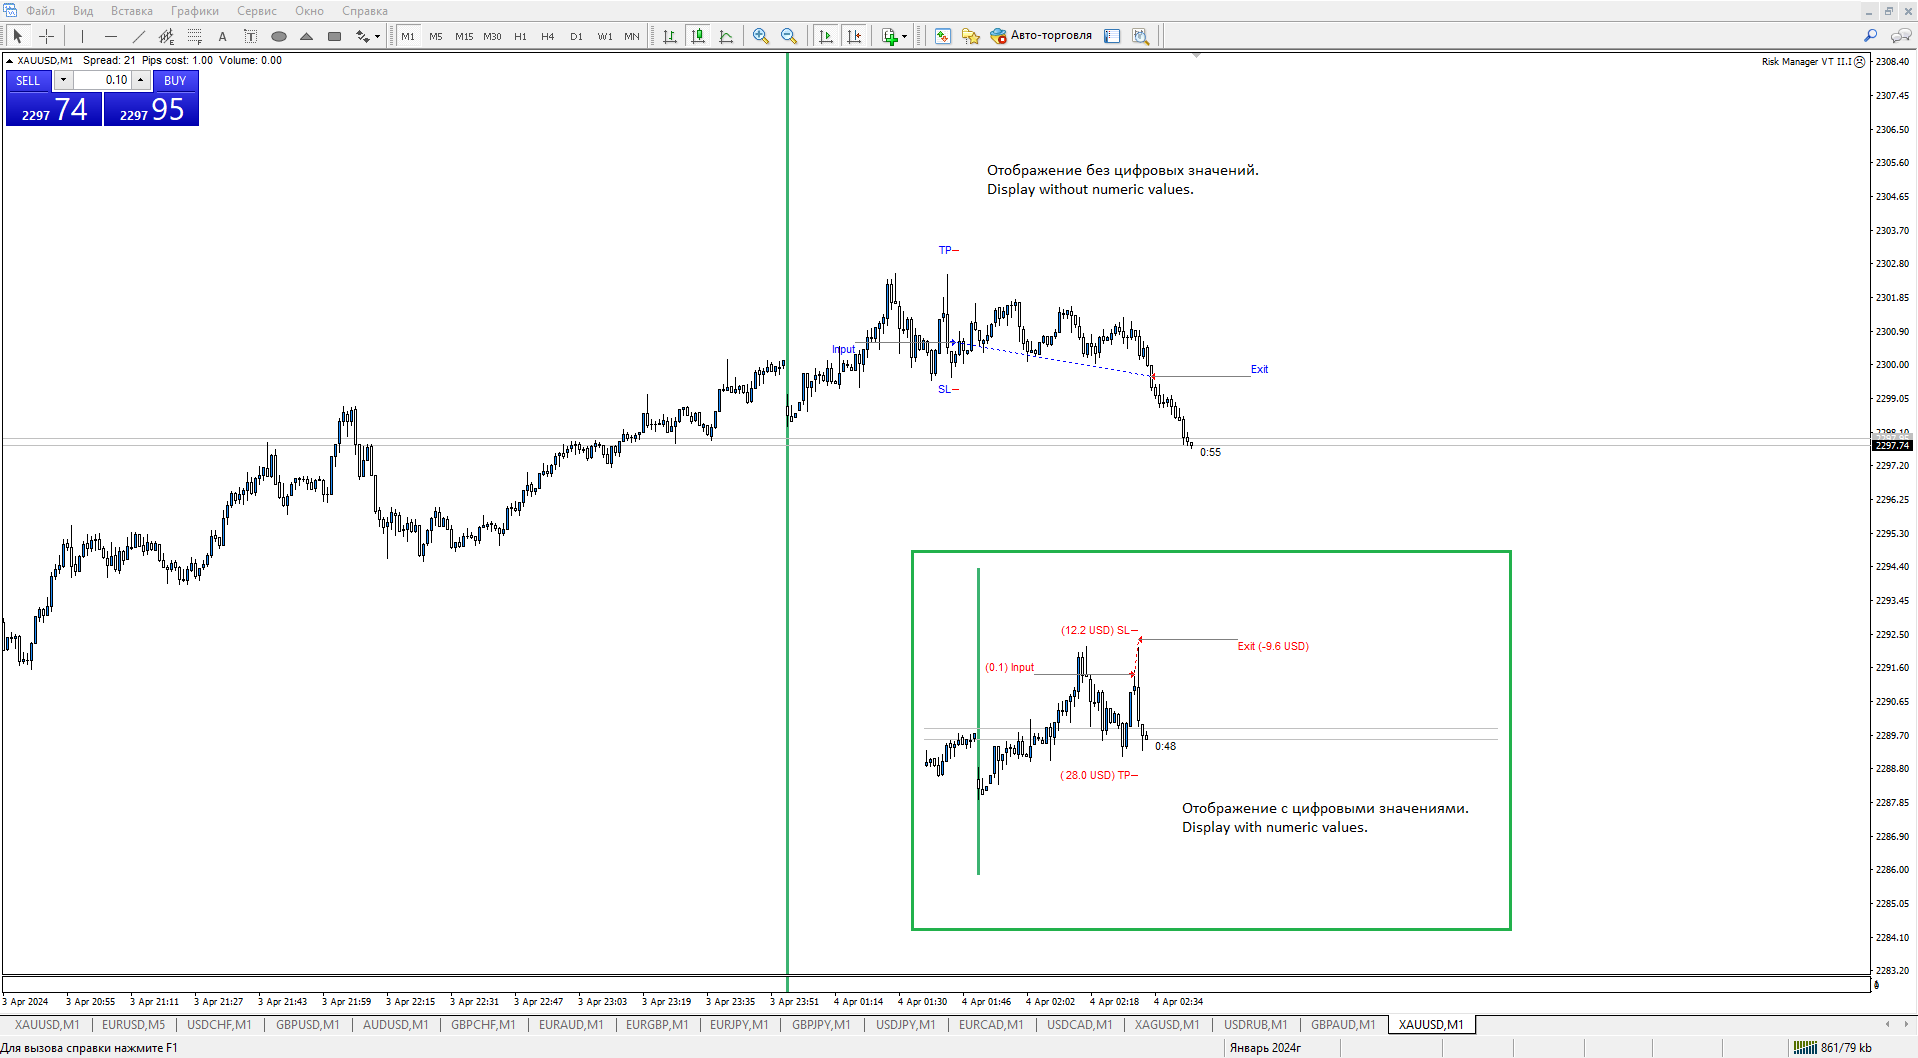
Una vez cerrada la operación, mediante"sl" o"t p" o "manualmente", el indicador muestra los niveles y las notas a pie de página de los parámetros de la operación en el gráfico.
Las notas a pie de página de entrada( Entry) ysalida (Exit) pueden colocarse en ángulo u horizontalmente desde los puntos de entrada y salida.
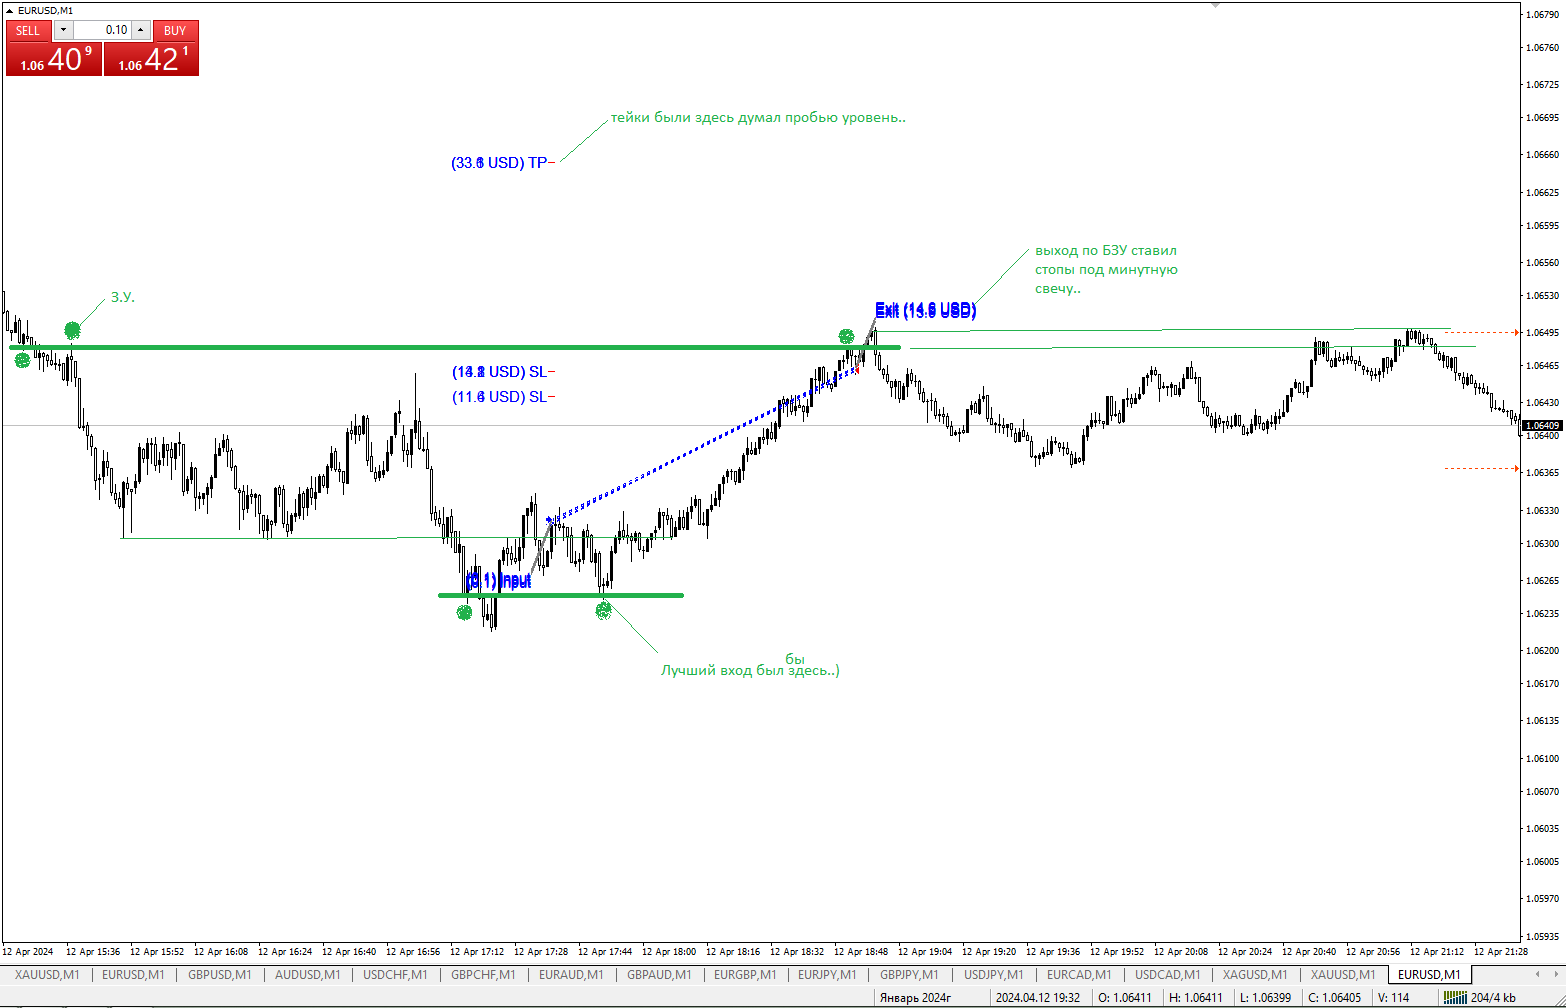
El color del texto de las notas a pie de página puede cambiar en función de la dirección de la operación abierta.
La línea de la operación en sí, como es habitual, si hemos arrastrado la operación desde el historial del terminal al gráfico, aparece punteada. (Rojo para Vender. Azul para Comprar).
Junto al texto de la nota, es posible una visualización numérica del parámetro de la operación:
- donde input(entrada) se muestra el volumen de la operación.
- dondeexit ( salida) se muestra el valor en la moneda de depósito. Lo mismo en
valores de SL y TP. (valores numéricos entre paréntesis). Ver captura de pantalla.
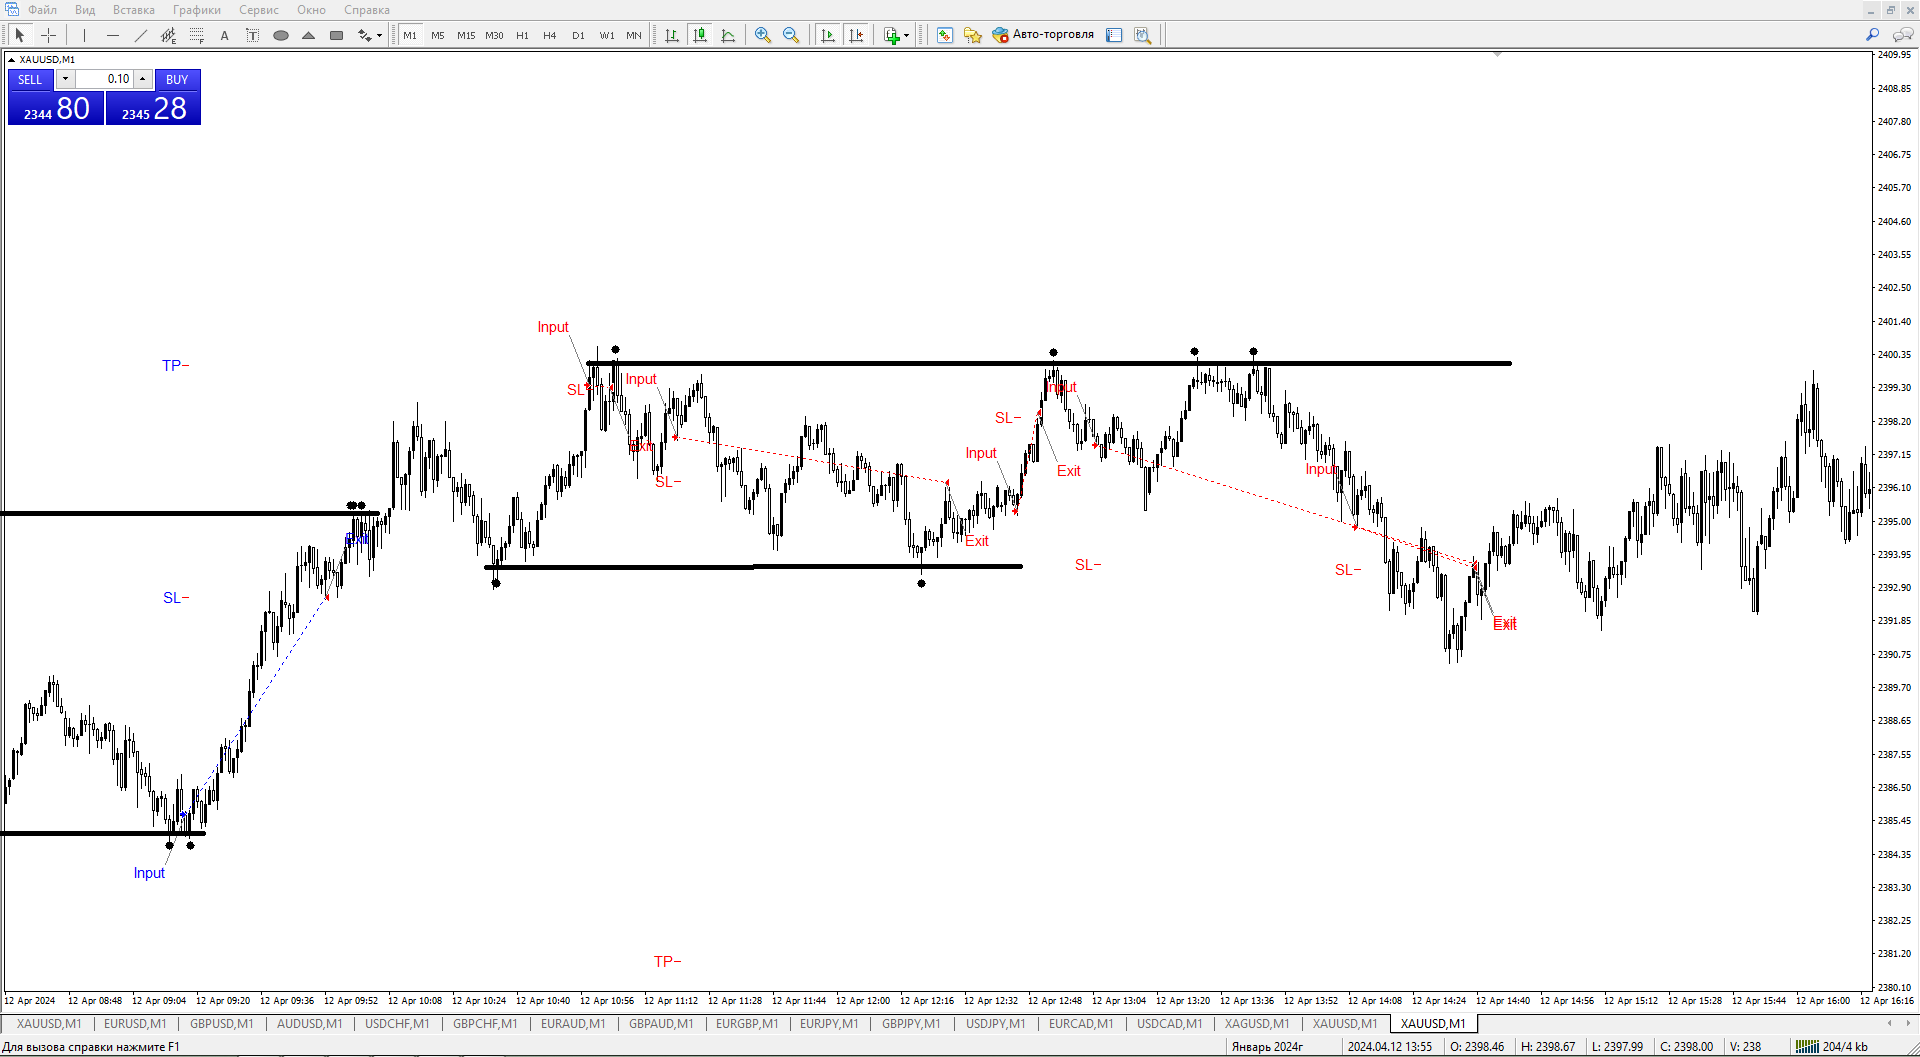
Indicador de trabajo.
El indicador será muy útil para todos los inversores, comerciantes, trabajando en serio y consciente de su trabajo. Al mantener un registro de las operaciones,
añadir a ella capturas de pantalla de entrada en el mercado completado puede ahorrar tiempo dedicado a tirar de una operación cerrada de la historia,
en la ventana del terminal en el gráfico. El propio indicador añade esta información. Tan pronto como se cierra la operación.
Algunos parámetros del indicador:
- Mostrarcomentario en la operación - mostrar comentario del indicador. Si está desactivado, sólo se muestran las líneas y las flechas.
. - Offset comentario en píxeles a lo largo de "Y", "X" - parámetro de pie de líneaen horizontal y vertical.
- El tamaño del texto del comentario - el tamaño del texto de la nota al pie del comentario.
También puede cambiar el texto de las notas al pie en el indicador. Por defecto son:
- TR - nivel de take profit.
-SL - nivel de Stop Loss.
- Input - nivel de la nota a pie de página "Input".
-Exit - nivelde la nota a pie de página "Exit".
- Mostrar"Valor" de su transacción - mostrar o no mostrar el parámetro digital de la transacción (volumen y visualización monetaria en la divisa de depósito).
Recomendación. Después de la apertura de operaciones, takek siempre debe ser muchas veces mayor en tamaño que la parada.
Si es posible, si el precio se fue en su dirección, inmediatamente transferir stop loss a breakeven (BZU).
"No convierta una operación rentable en una operación perdedora. Buena suerte. : ) y ¡Éxito!