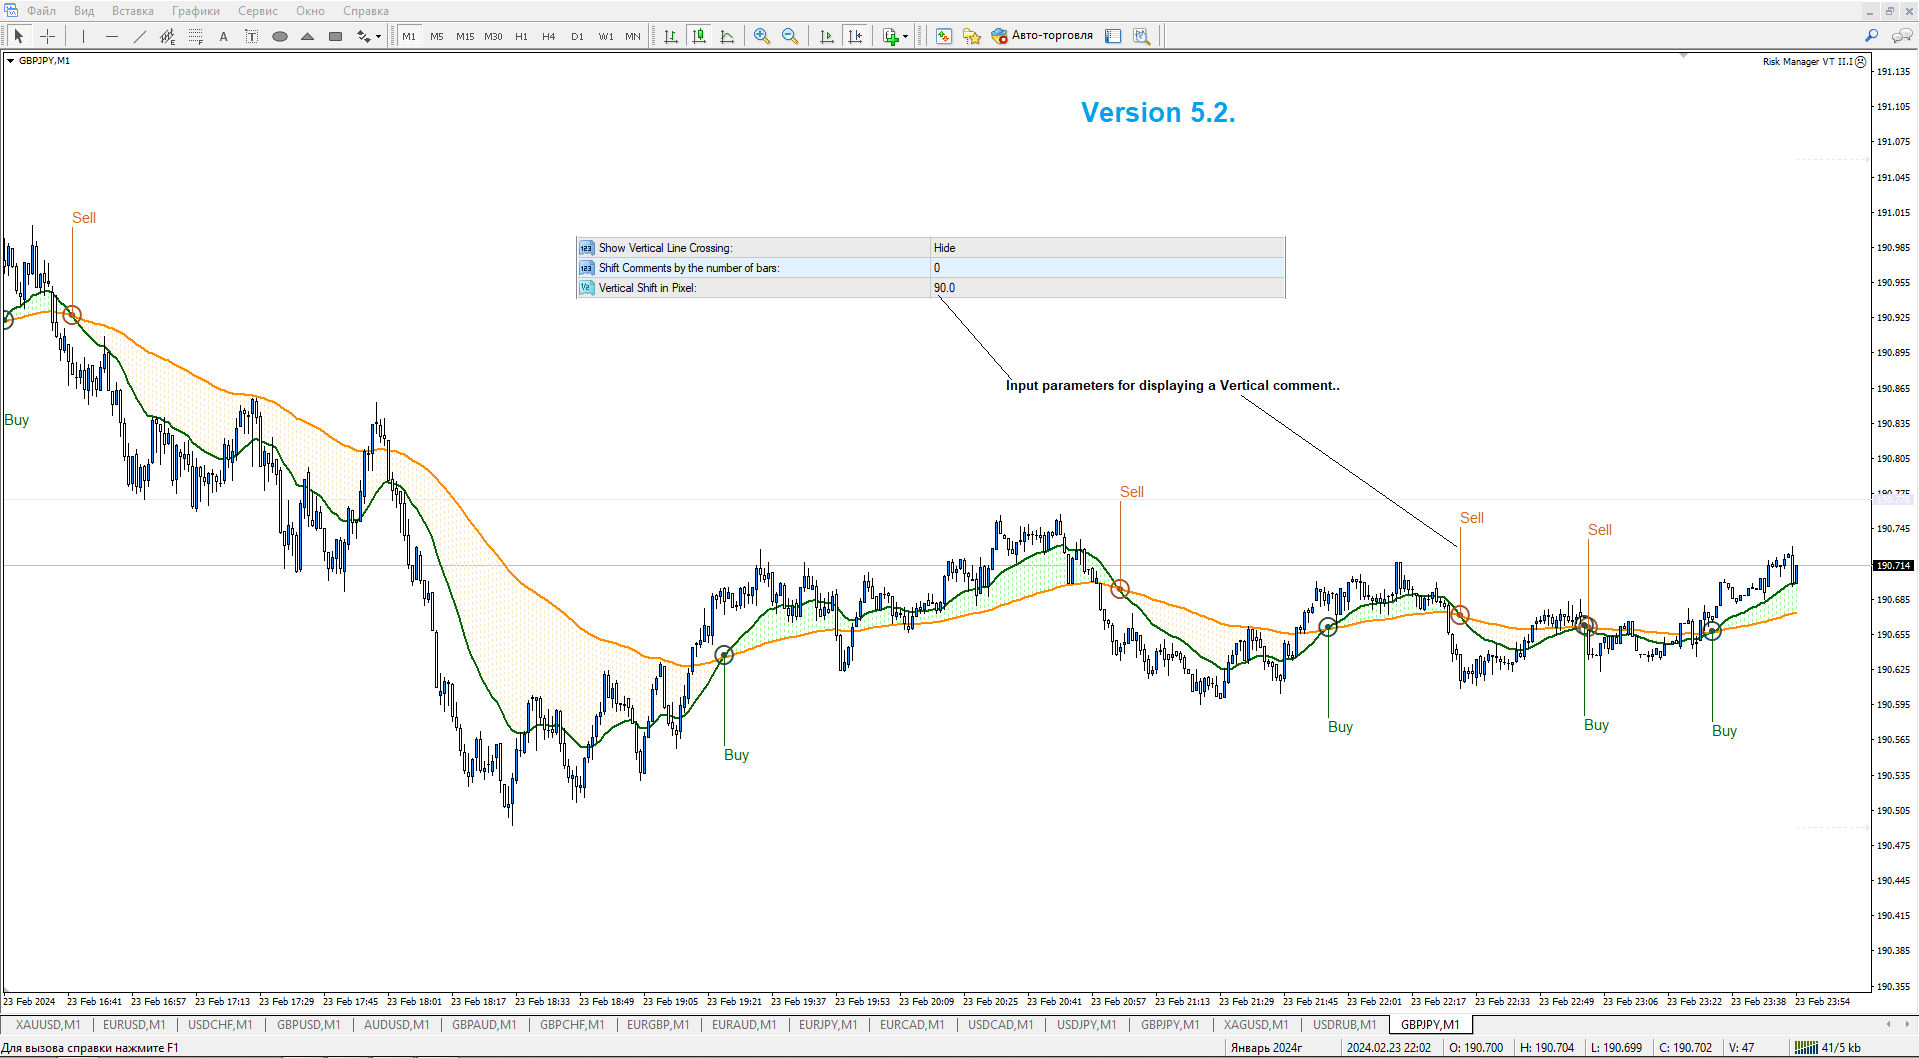
Crossing signal ema
- Indikatoren
- Version: 5.2
- Aktualisiert: 24 Februar 2024
- Aktivierungen: 15

Dieser Indikator visualisiert den Schnittpunkt von zwei gleitenden Durchschnitten. (SМА, EMA, SMMA, LWMA).
Er wurde für die Sichtbarkeit von Signalen und Benachrichtigung über Schnittpunkte von gleitenden Durchschnitten erstellt.
Der gleitende Durchschnitt ist einfach der gemittelte Wert des Preises für den ausgewählten Zeitrahmen (TF).
Daher werden die gleitenden Durchschnitte in einer Vielzahl von Zeitrahmen verwendet, von 1 Minute bis zu einem Jahr und sogar Jahrzehnten.
Mögliche Arten von gleitenden Durchschnitten im Indikator
- SMA (Einfacher gleitender Durchschnitt);
- EMA (Exponentieller gleitender Durchschnitt);
- SMMA (geglätteter gleitender Durchschnitt);
- LWMA (Linearer gewichteter gleitender Durchschnitt);
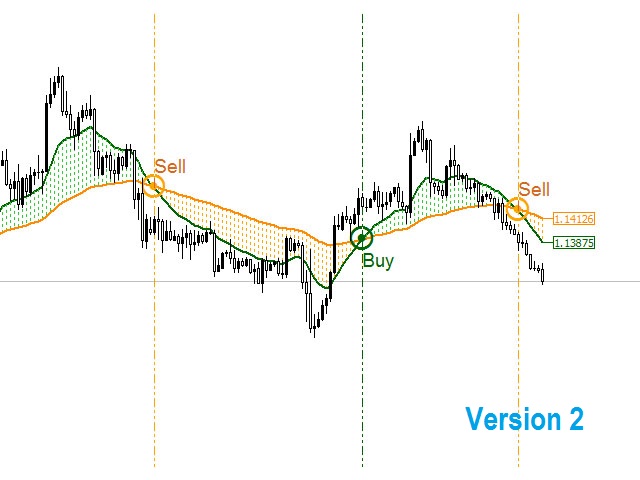
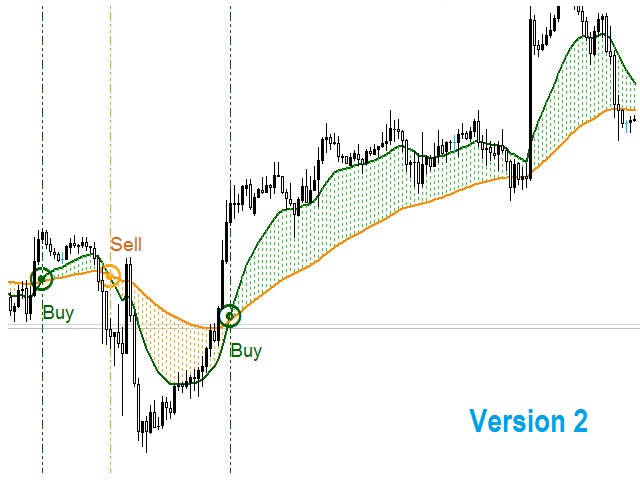
Der Indikator hat die Möglichkeit, Farben und Perioden des gleitenden Durchschnitts zu ändern. Bei richtigem Verständnis zeigt der Indikator visuell die Richtung des Trends für das Währungsinstrument an.
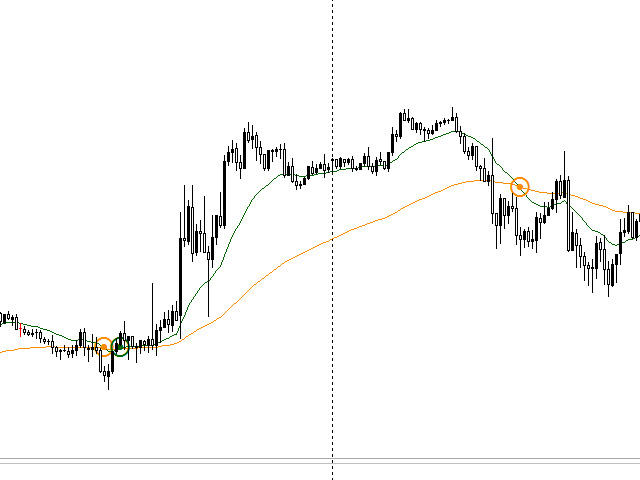
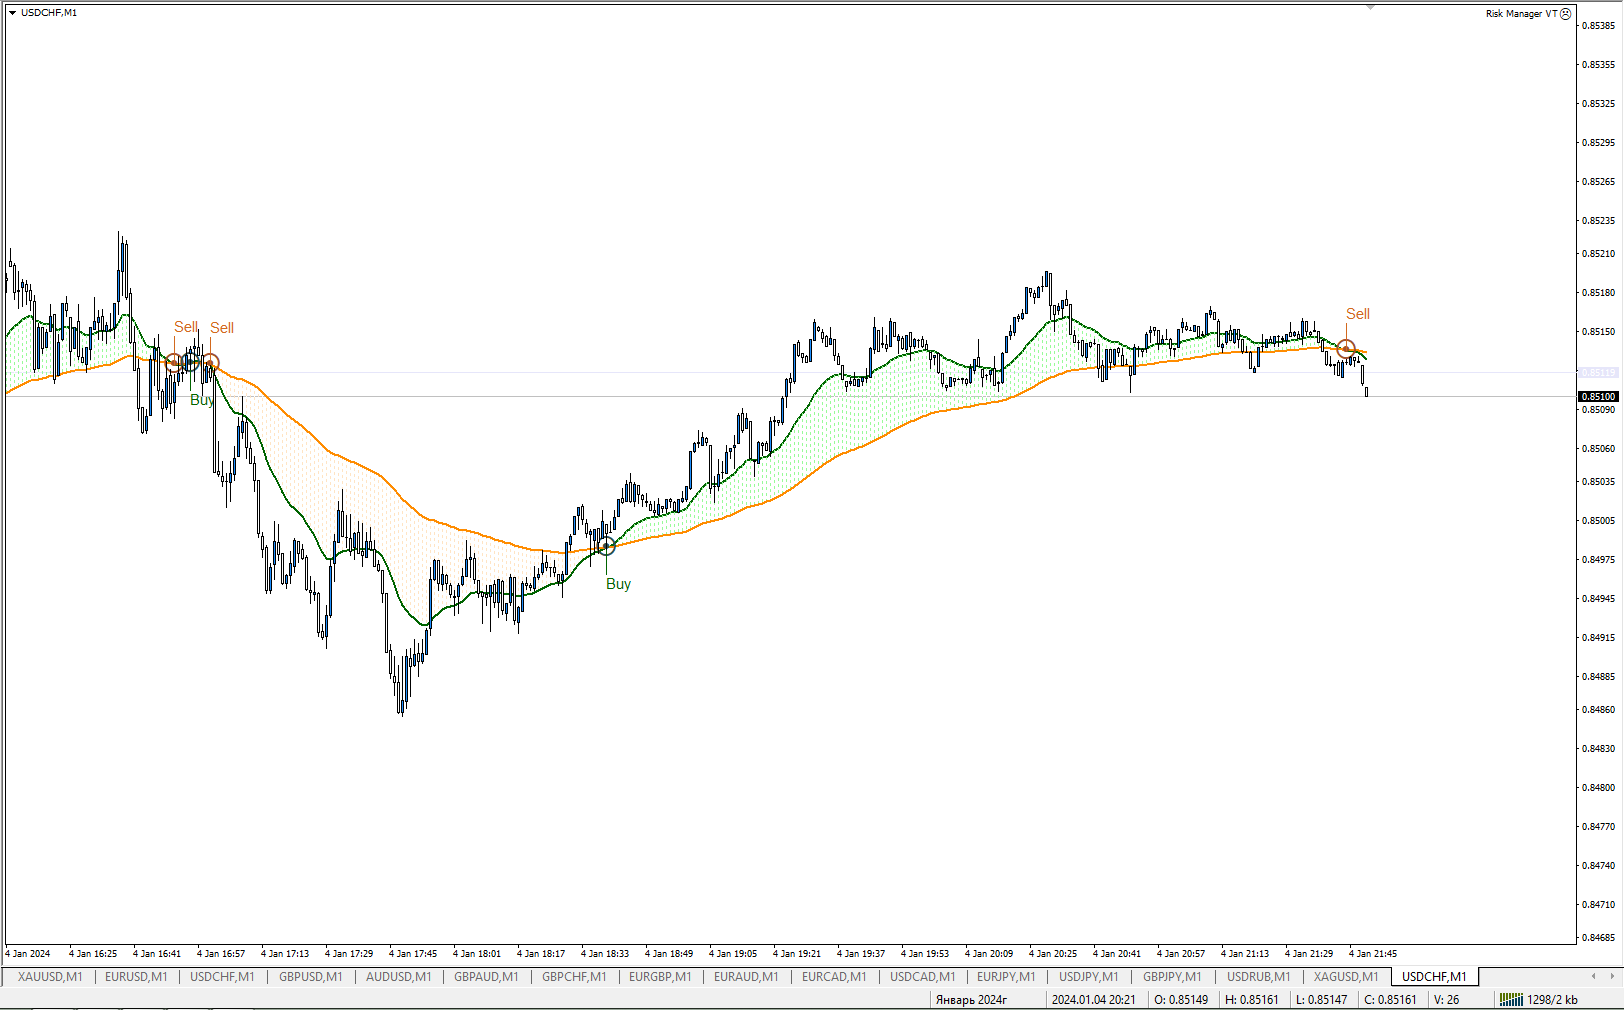
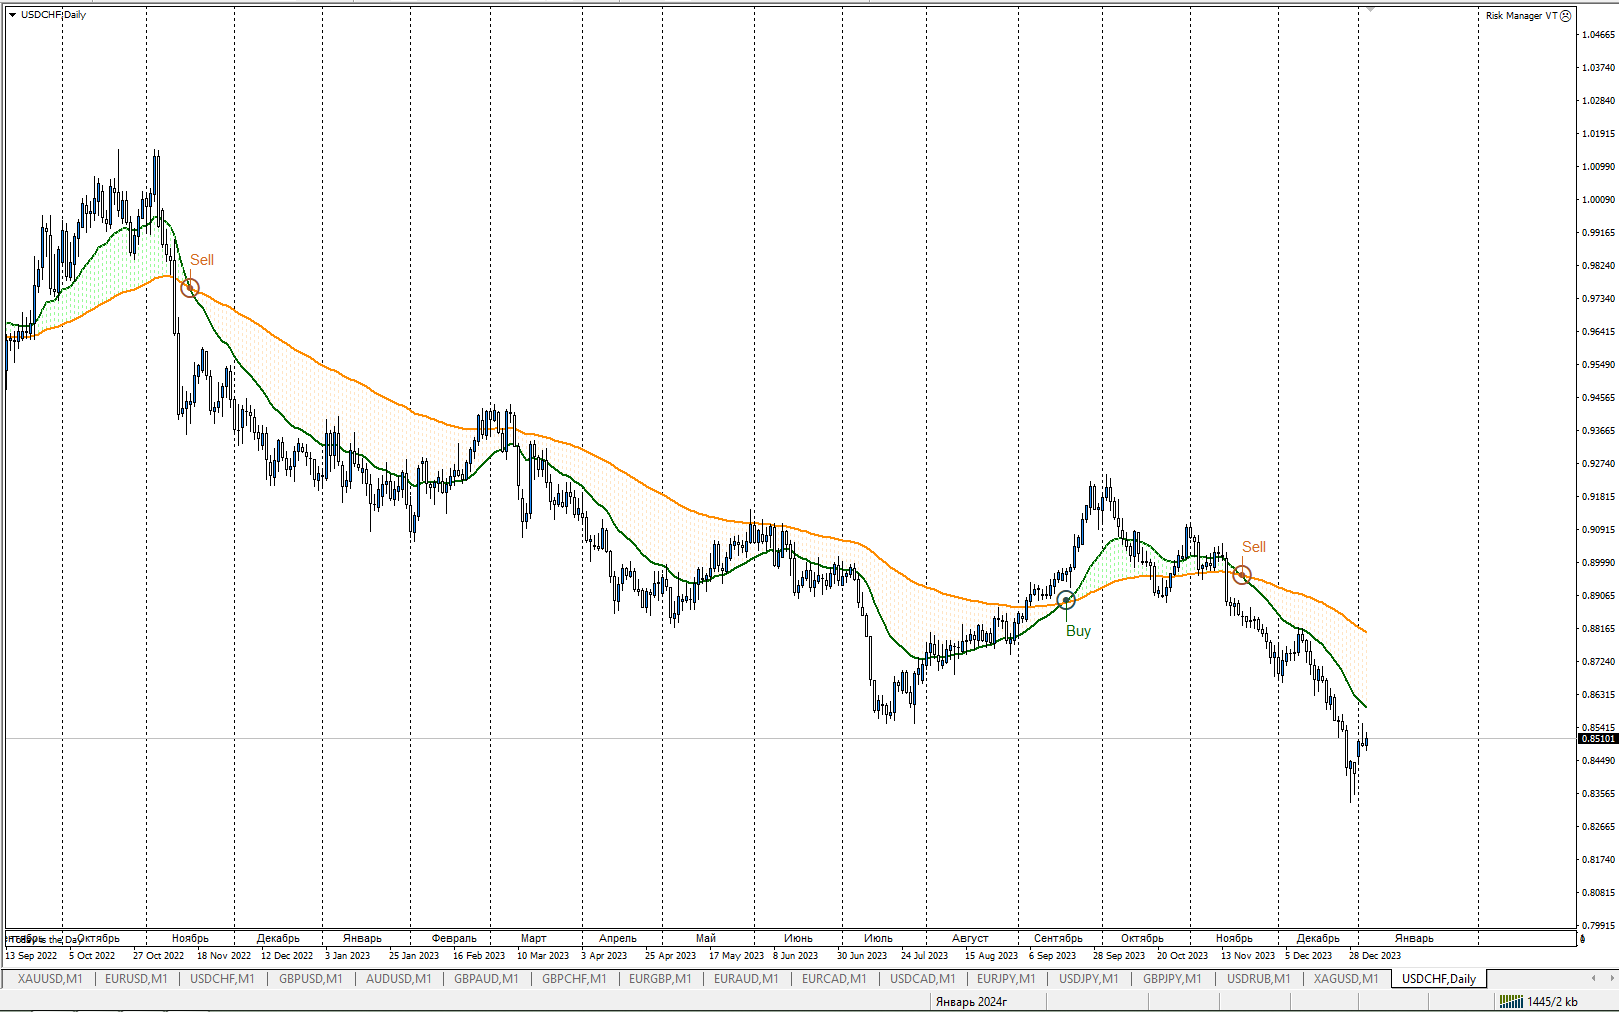
Die Kreuzung von gleitenden Durchschnitten verschiedener Perioden und Typen ist die einfachste und gebräuchlichste Strategie aus der Vielfalt der Forex-Handelsmethoden.
Wenn zum Beispiel ein MA mit einer kleineren Periode (schnell) einen MA mit einer langen Periode (langsam) kreuzt, erscheint ein Signal, das einen Einstieg in die Trendrichtung anzeigt.
Bei einem umgekehrten Schnittpunkt kann sich der Trend ändern, was ein Signal zum Ausstieg aus dem aktuellen Geschäft und zum Einstieg in die andere Richtung erzeugt.
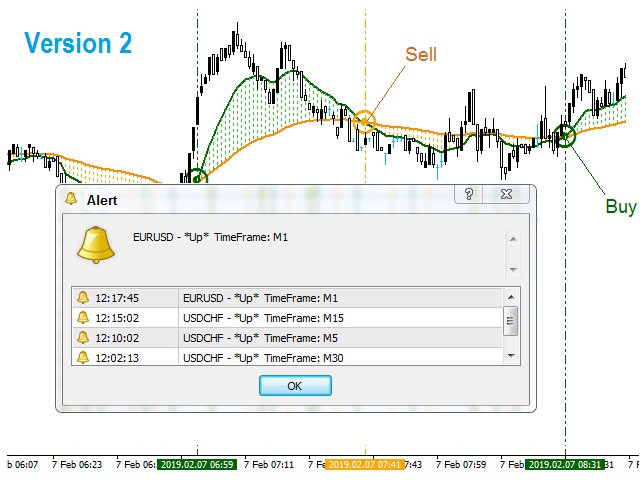
Benachrichtigung beim Schnittpunkt
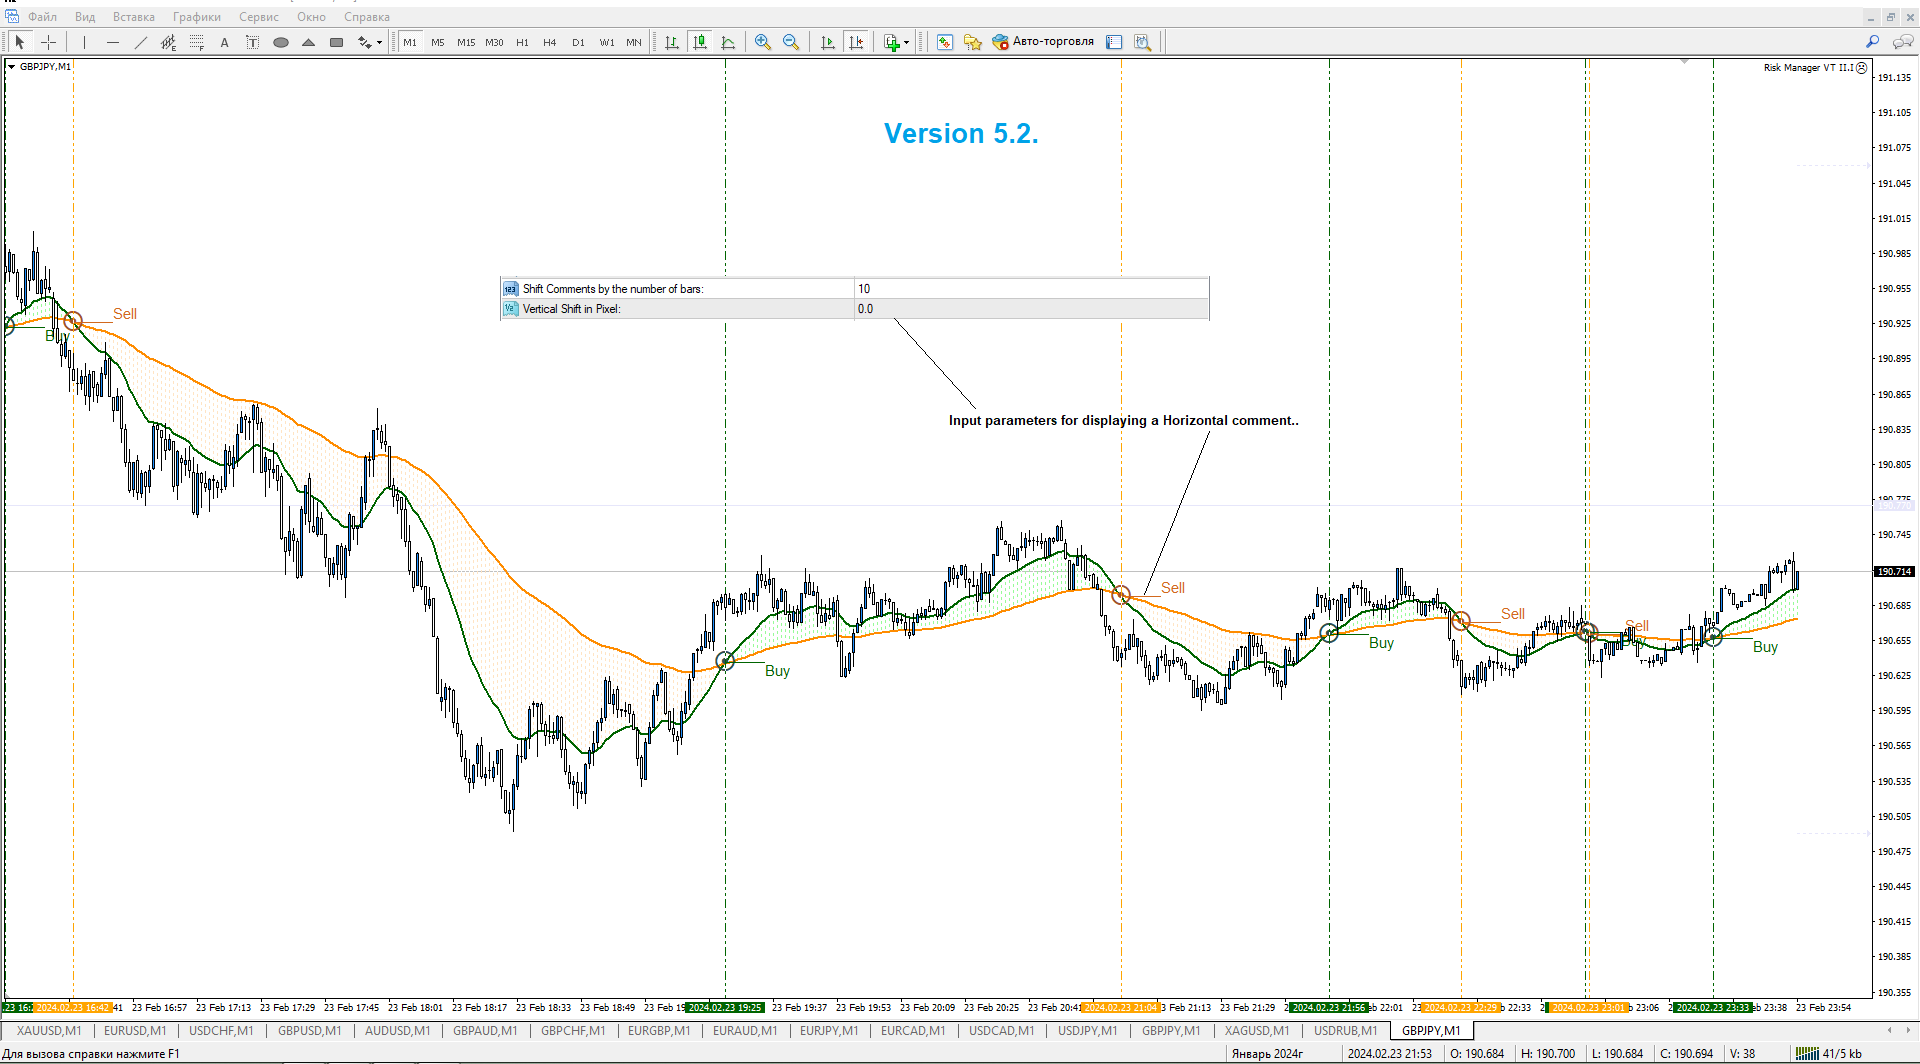
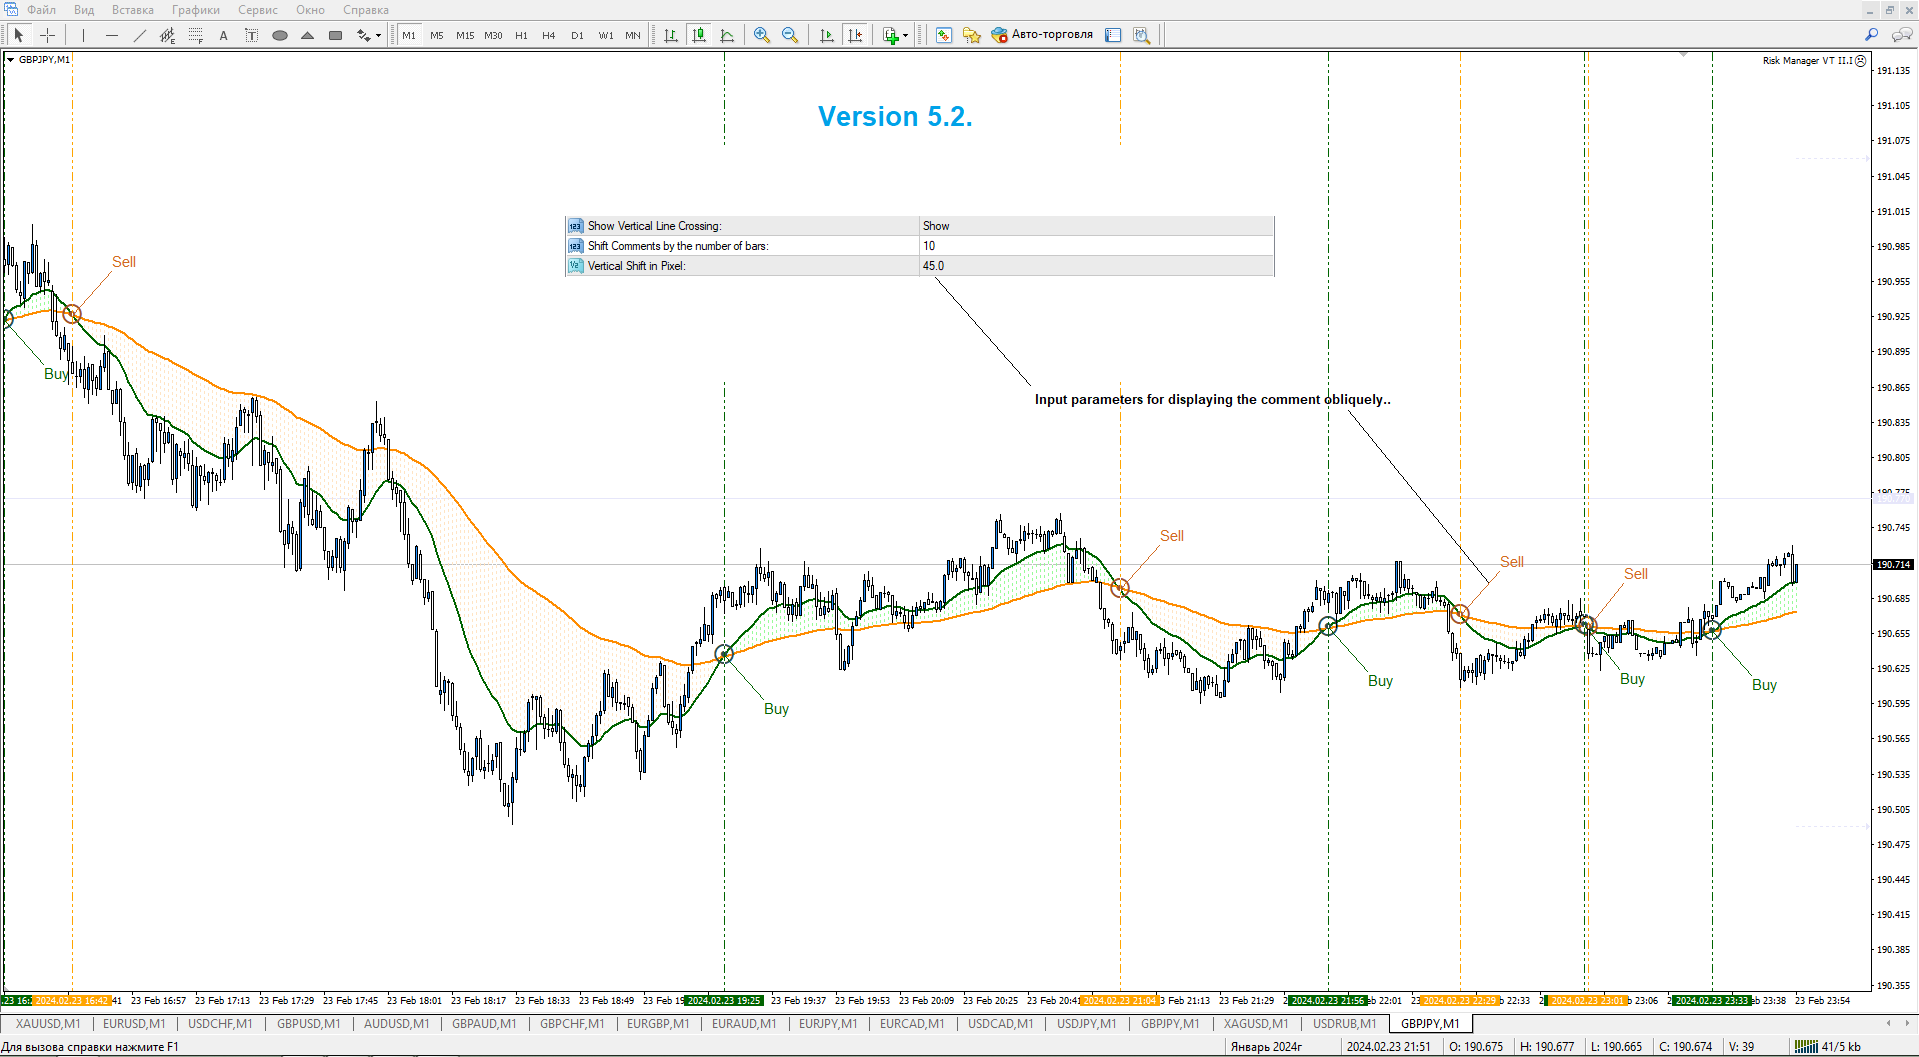
Wenn sich zwei gleitende Durchschnitte kreuzen, wird das Crossing-Signal EMA erzeugt:
- Eine akustische Benachrichtigung.
- Zeichnet ein grafisches Symbol am Kreuzungspunkt.
- Öffnet eine Warnbox, die den Zeitpunkt des Schnittpunkts, den Namen des Währungsinstruments, den Zeitrahmen (TF) und den Namen des Einstiegssignals ("Down" oder "Up") enthält.
Standardeingaben des Indikators
- PeriodMA_1 - Periode des ersten (schnellen) Gleitenden Durchschnitts, Standardwert: 19.
- MA_metod_1 - Berechnungsart des gleitenden Durchschnitts, Voreinstellung: EMA.
- Appied_price_1 - Typ des Preises, der für die Berechnung des MA verwendet wird, Standardwert: Schlusskurs.
- PeriodeMA_2 - Periode des zweiten (langsamen) gleitenden Durchschnitts, Standardwert: 79.
- MA_metod_2 - Berechnungsart des gleitenden Durchschnitts, Standardwert: EMA.
- Appied_price_2 - Typ des Preises, der für die Berechnung des MA verwendet wird, Standardwert: Schlusskurs.
- ShowArrows - Anzeige der Schnittpunkte (Icons), Standardwert: true;
- Arrows_code_up - Zeichencode für das Aufwärtssignal, Standardwert: 164;
- Arrows_code_down - Zeichencode für das Abwärtssignal, Standardwert: 164;
- Width - Breite des Symbols, Standardwert: 3.
- Num_cross - Anzahl der Benachrichtigungen in der Historie der Alertbox, Standardwert: 5.
- ShowHistogram - füllt den Raum zwischen den gleitenden Durchschnitten, Standardwert: true.
Standard-Farboptionen für den Indikator
- 0 - Füllfarbe (Histogramm) für das "Down"-Signal, Voreinstellung: Siena.
- 1 - Farbe des gleitenden Durchschnitts (schnell), Voreinstellung: DunkelGrün.
- 2 - Füllfarbe (Histogramm) für das Signal "Aufwärts", Standardwert: DunkelGrün.
- 3 - Farbe des gleitenden Mittelwerts (langsam), Standardeinstellung: DunkelOrange.
- 4 - Farbe des Symbols für die "Down"-Signale, Standardeinstellung: DunkelOrange.
- 5 - Farbe des Symbols für die "Aufwärts"-Signale, Standardeinstellung: Limone.
Ein paar Tipps zur MA-Schnittpunktstrategie
- Eröffnen Sie keine Geschäfte in die andere Richtung, bis ein Schnittpunkt auftritt.
- Eine Bewegung, die begonnen hat, wird wahrscheinlich zurückkehren.
- Denken Sie daran, dass gleitende Durchschnitte auch dynamische Unterstützungs- und Widerstandsebenen sind.