Spread and Cost pips
- Indicadores
- Versión: 2.1
- Actualizado: 4 enero 2024

Acerca del Spread
Spread es la diferencia entre el precio Ask y el precio Bid de un activo en la bolsa de valores o de divisas.
Vamos a referirnos a los Bancos Centrales y al cambio de divisas en estos bancos, para entender por qué el Spread es tan importante en el comercio de divisas. En los Bancos Centrales, siempre vemos la diferencia entre el precio de compra y el precio de venta de una divisa. Esta diferencia es lo que gana el banco que compra y vende la divisa. Cuando operamos en el mercado Forex a través de un broker, también podemos ver la diferencia, que sin embargo es mucho menor que en los puntos de cambio de divisas.
Por ejemplo, la cotización "EUR 1,2030/1,2032" significa que el broker está dispuesto a comprar Equro frente al dólar estadounidense a 1,2030, y a vender Euro a 1,2032. La diferencia entre el precio de compra y el de venta es de 2 puntos (0,0002).
Calcular el tamaño real del diferencial es difícil. El valor depende de la política del broker.
Hay dos tipos de Spread en el mercado Forex:
Elspread fijo es constante independientemente de los cambios en el mercado.
Elspread flotante es el más utilizado. Fluctúa dentro de un determinado rango en función de las condiciones del mercado. Normalmente, los intermediarios sólo indican el límite inferior de esta horquilla. El valor del diferencial flotante depende de lo siguiente:
- Liquidez de las divisas
- Sentimiento del mercado
- Corredor
Cómo tener en cuenta el diferencial al abrir y cerrar operaciones en el mercado de divisas.
Cuando se abren posiciones largas (de compra), las operaciones se ejecutan al precio de demanda, mientras que cuando se abren posiciones cortas (de venta), las operaciones se ejecutan al precio de oferta. Cuanto menor sea la distancia entre los dos precios, más rápido entrará su operación en una zona de beneficios, siempre que prediga correctamente el movimiento del precio.
También es importante tener en cuenta el spread cuando se trabaja con órdenes pendientes y cuando se fijan Take Profit (TP) y Stop Loss (SL).
Sobre el Lote y el Valor del Punto
Lote es la unidad estándar para medir el volumen de una transacción de divisas en el mercado Forex. Un lote equivale a 100.000 unidades de divisa base.
- Un lote estándar representa 100.000 unidades si la divisa base, y su volumen es igual a 1;
- Un minilote representa 10.000 unidades de la divisa base, y su volumen es igual a 0,1 del lote estándar;
- Unmicrolote representa 1.000 unidades de la divisa base, y su volumen es igual a 0,01 del lote estándar;
La mayoría de los corredores proporcionan calculadoras del valor del lote e información sobre las condiciones del servicio prestado.
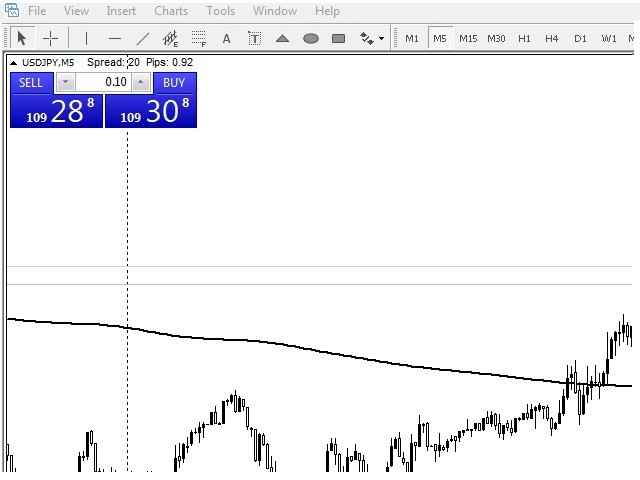
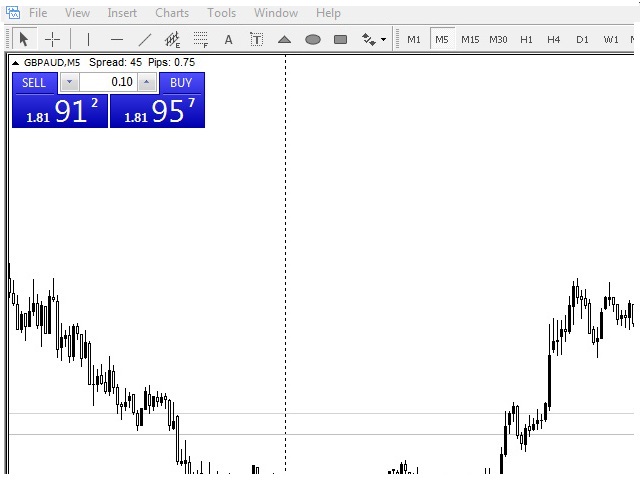
Este indicador muestra esta información directamente en un gráfico de precios. Al iniciar el indicador, éste muestra un texto con el valor actual del spread y el valor de un punto con el volumen de la operación igual al mini lote, es decir, 0,10. Esto simplifica enormemente la comprensión de la información sobre un instrumento de negociación.
Nota: el indicador puede trabajar con cualquier broker, con cualquier color del fondo del gráfico y es muy conveniente para analizar el par de divisas deseado antes de abrir una operación.
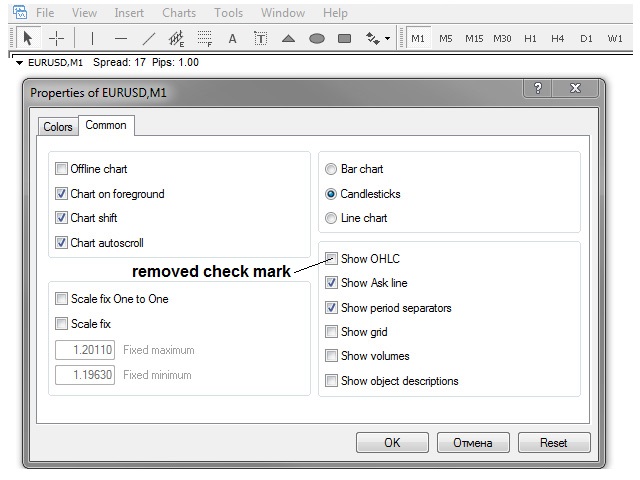
Para evitar la superposición con el texto de MetaTrader 4, antes de lanzar el indicador abra Chart Settings -> Common y deseleccione "Show OHLC". Por defecto, el texto del indicador se encuentra justo encima de los botones Comprar/Vender, donde normalmente se encuentra el texto OHLC. Por lo tanto, el valor exacto del spread y el valor del mini lote siempre se muestran en la pantalla.
OHLC - OPEN, HIGH, LOW y CLOSE - precio de apertura de la barra, el precio más alto de la barra, el precio más bajo de la barra y el precio de cierre de la barra, respectivamente.
Si la opción "Mostrar OHLC" es importante para usted, puede cambiar la ubicación del indicador "Spread y pips de coste".
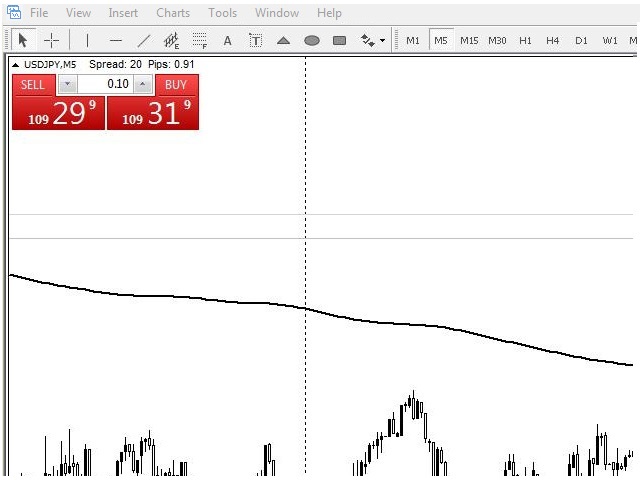
El color, el tamaño y el idioma del texto del indicador se pueden configurar en los parámetros de entrada.
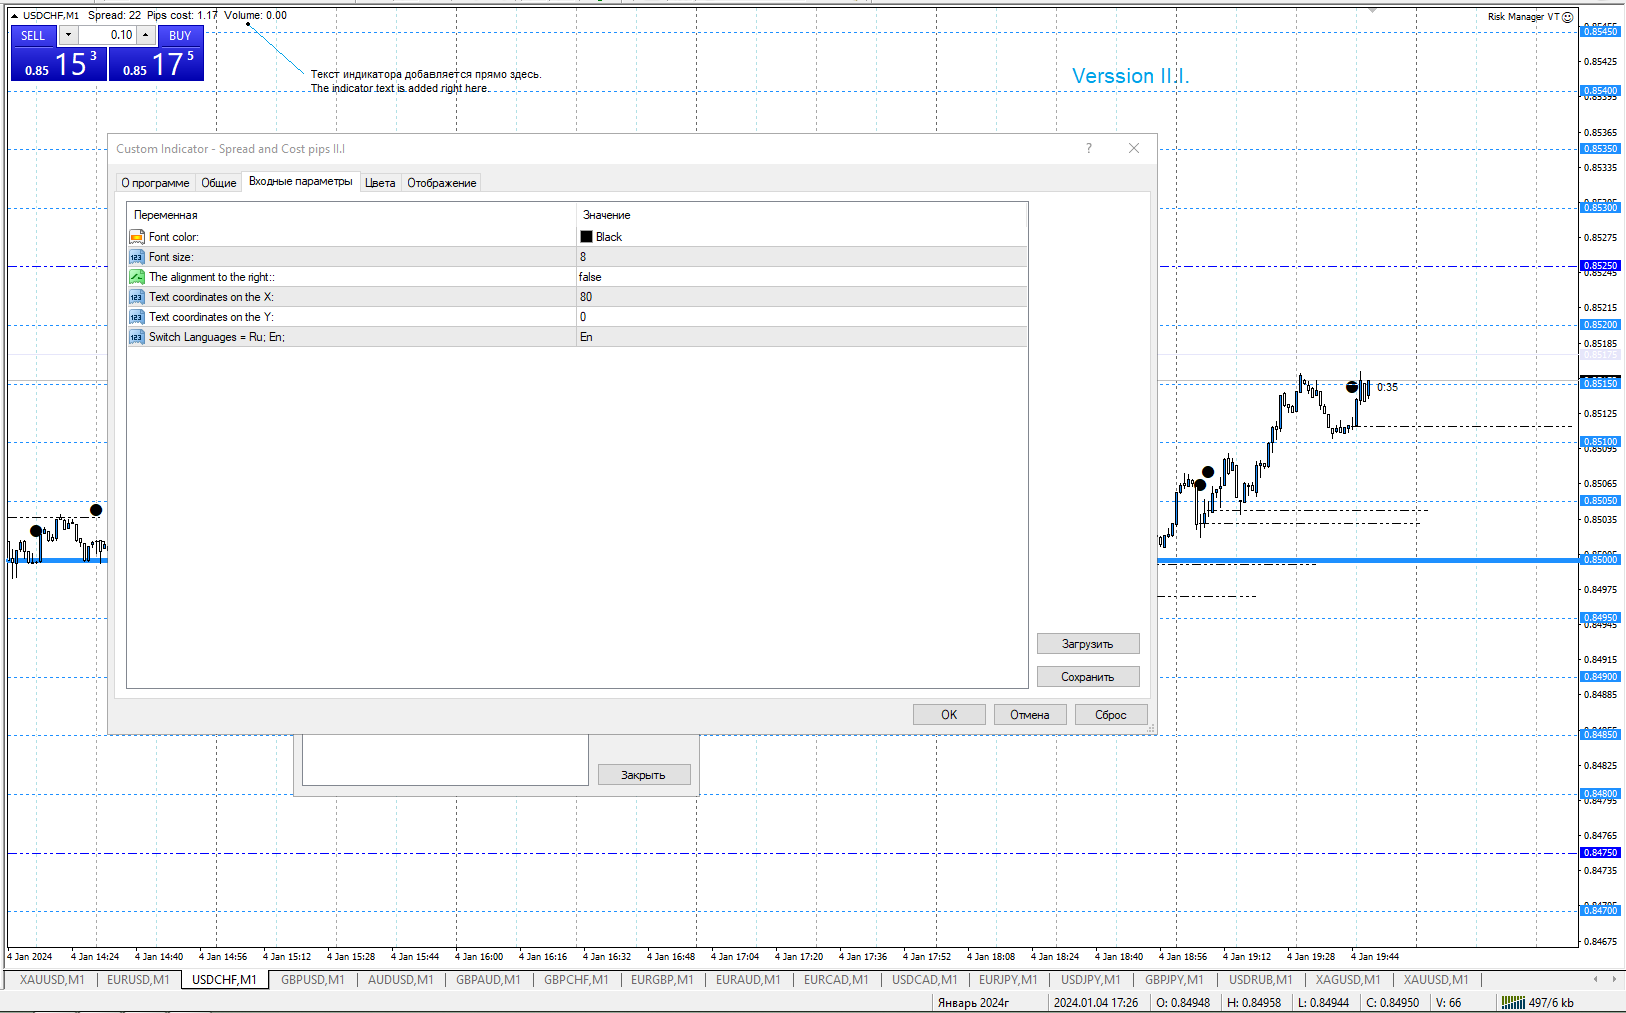
Entradas del indicador
- Color de fuente - por defecto es Negro.
- Tamaño de fuente - por defecto es 8.
- La alineación a la derecha - por defecto es falso.
- Coordenadas del texto en la X- establece la ubicación a lo largo del eje X.
- Coordenadas del texto en la Y - establece la ubicación a lo largo del eje Y.
- Switch Languages = Ru;En; - establece el idioma del texto, por defecto es En.


Хорошо сделано.