Cumulative Delta MT4
- Indicadores
-
Evgeny Shevtsov
 Indicators for volume trading :
Volume profile,
Classic profile,
Clusters chart,
Demand and supply levels,
Demand and supply diagram,
Cumulative delta.
Indicators for probabilistic analysis :
Monte Carlo predictor,
Neural predictor. - Versión: 3.6
- Actualizado: 10 noviembre 2024
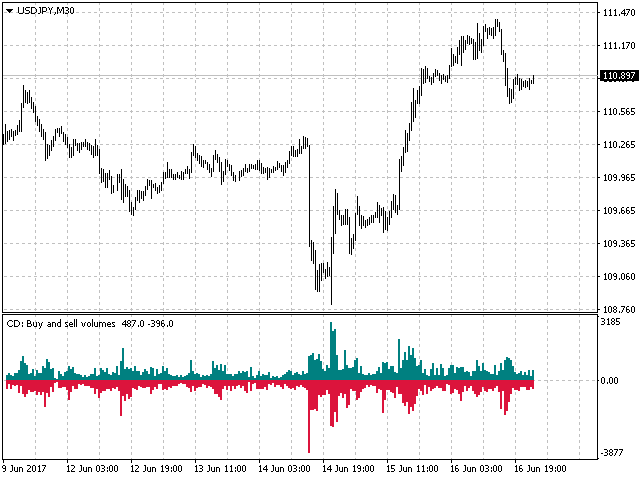
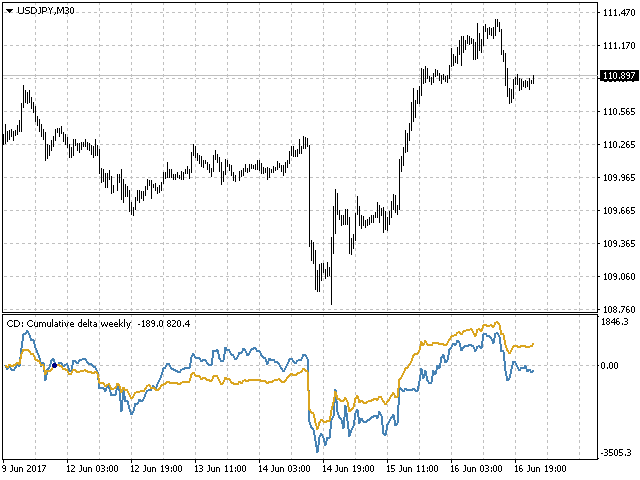
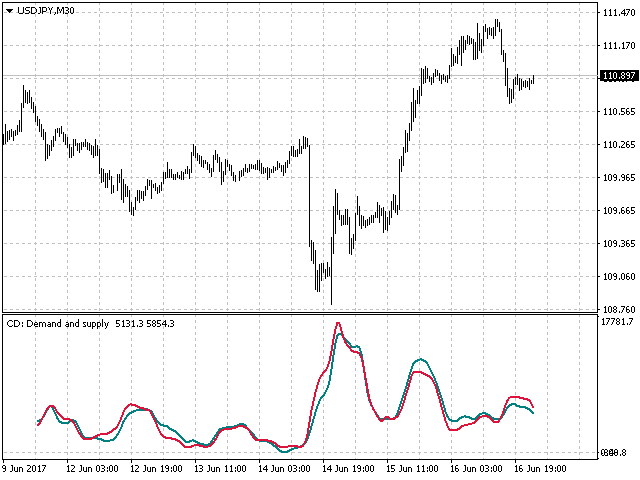
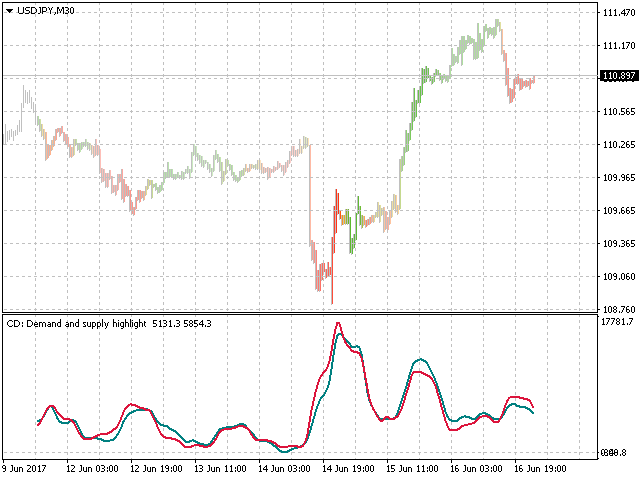
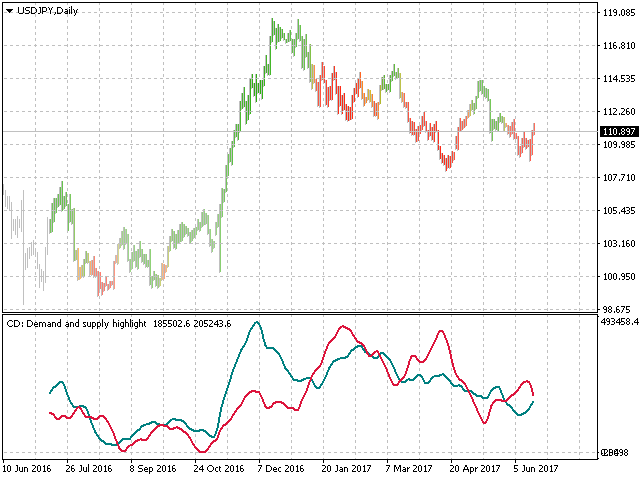
El indicador analiza la escala de volúmenes y la divide en dos componentes: volúmenes vendedores y volúmenes compradores, y también calcula el delta y el delta acumulativo.
El indicador no parpadea ni se redibuja, su cálculo y trazado se realizan con bastante rapidez, al tiempo que utiliza los datos de los períodos más pequeños (en relación con el actual).
Los modos de funcionamiento del indicador se pueden cambiar utilizando la variable de entrada Modo:
- Compra - muestra sólo los volúmenes compradores.
- Vender - mostrar sólo los volúmenes vendedores.
- CompraVenta - muestra sólo los volúmenes comprador y vendedor en dos escalas separadas.
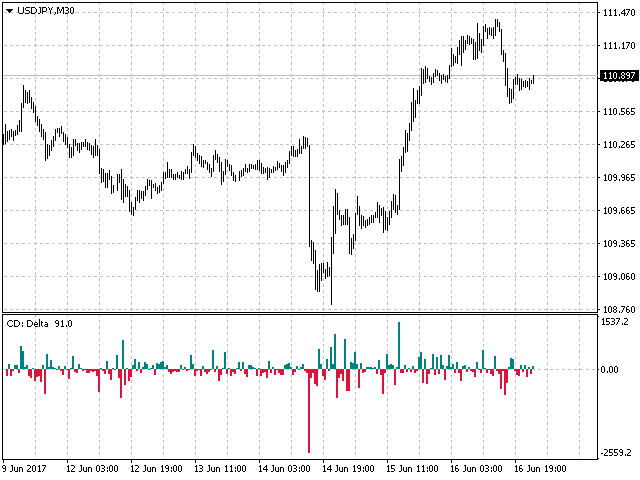
- Delta - el modo de diferencia (delta) entre los volúmenes comprador y vendedor.
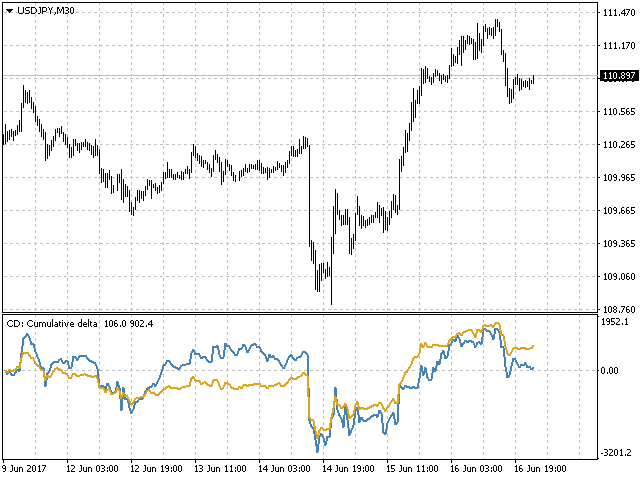
- CumDelta - modo delta acumulativo.
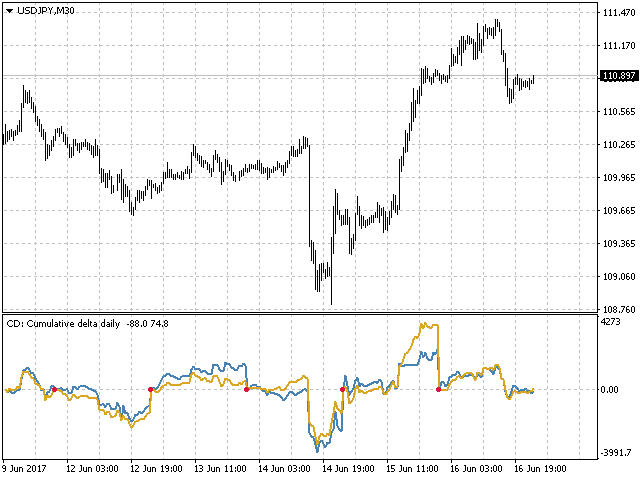
- CumDeltaDaily - modo delta acumulativo con puesta a cero del saldo al principio de cada día.
- CumDeltaWeekly - modo delta acumulativo con puesta a cero del saldo al principio de cada semana.
- DemandAndSupply - muestra el diagrama de oferta y demanda.
El recálculo completo de los datos se realiza una vez por minuto, cuando se abre una nueva vela en el marco temporal M1, o en caso de actividad del usuario, es decir, cuando se desplaza el gráfico más profundamente en el historial, cuando se cambia la escala temporal del gráfico o cuando se cambia el marco temporal actual.
Por defecto, el punto de referencia inicial es la primera vela desde el borde izquierdo de la ventana del gráfico. El punto de referencia puede cambiarse utilizando la variable de entrada BarsLimit.
En caso de que falten los datos de alguno de los periodos requeridos en los cálculos, el indicador genera el mensaje correspondiente.


As you might know, Volume is the "missing link" to understand price action. Having this prepared in the way CD does it is invaluable to make decisions fast - and it helps. The indicator seems to be rock solid; I have 12-16 instances running per profile, in various configurations and with different pairs, changing is quick, adds only about 5 seconds for the entire profile on good ol' MT4. After migrating from an STP to ECN (different account, new install, copied data) the higher TF didn't show up. I've looked around in the forum, didn't find anything and send a message to Evgeny. While I was hoping to get an answer within 1-2 days, he replied within < 4 hours. THX, btw. Also, his reply was clever enough to help me SOLVE the issue right away. The description is basic but complete, and parameter names are self-explanatory and fun to work with. My issue would probably make a good FAQ item: The higher TF simply needed more M1 and M5 history (by scrolling on those TF a couple of months) - and I think I have even seen a note of this somewhere when I bought CD half a year ago. Anyway, highly recommend this - it's one of the good indicators, gets updated and you have full support. Bye | Buy now :))