Demand And Supply Diagram MT5
- Indicadores
-
Evgeny Shevtsov
 Indicators for volume trading :
Volume profile,
Classic profile,
Clusters chart,
Demand and supply levels,
Demand and supply diagram,
Cumulative delta.
Indicators for probabilistic analysis :
Monte Carlo predictor,
Neural predictor. - Versión: 3.8
- Actualizado: 9 noviembre 2024
- Activaciones: 10
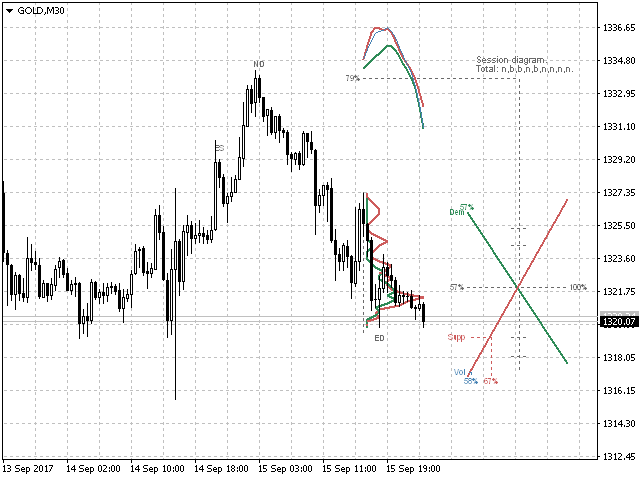
El balance de la oferta y la demanda es un método de análisis de mercado sencillo y eficaz.
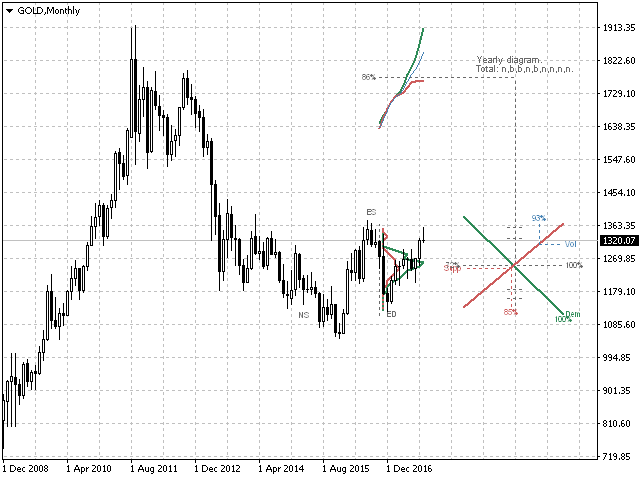
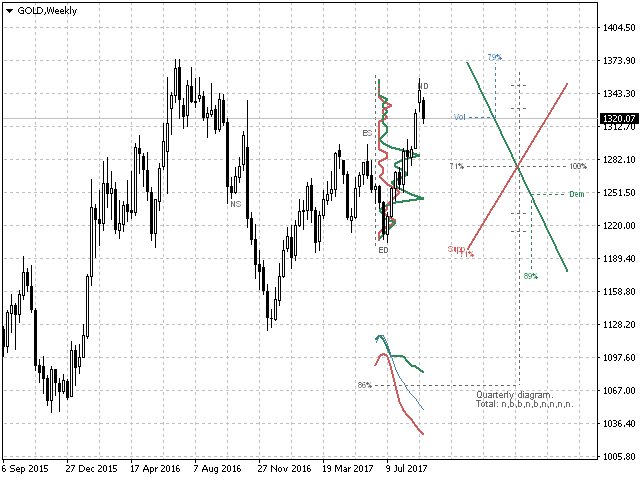
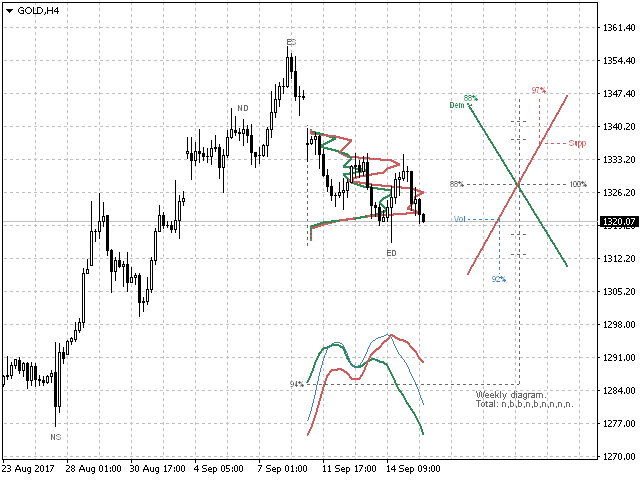
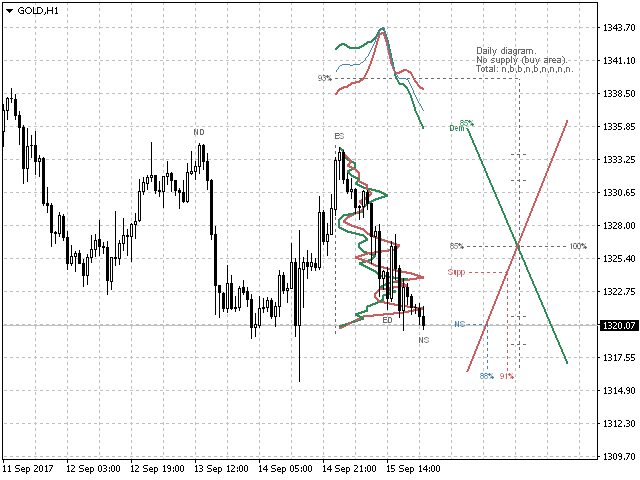
El diagrama de la oferta y la demanda puede mostrarle con antelación, incluso antes de la inversión de la tendencia, dónde termina la oferta y ya está surgiendo la demanda, dónde termina la demanda y está surgiendo la oferta, al tiempo que aumenta sustancialmente la probabilidad de realizar una operación en la dirección correcta y con un alto factor de beneficio.
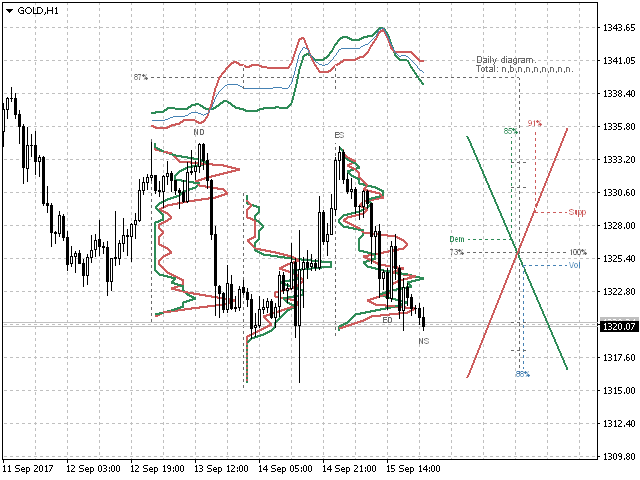
Señales del indicador
El indicador utiliza los valores de precio/volumen para generar señales:
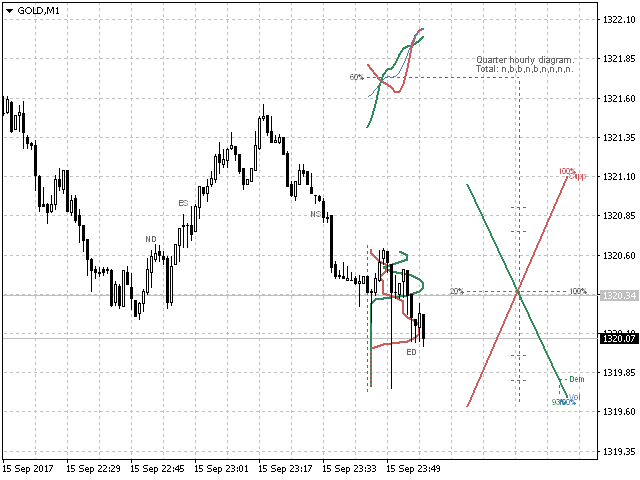
- ED - exceso de demanda.
- ES - exceso de oferta.
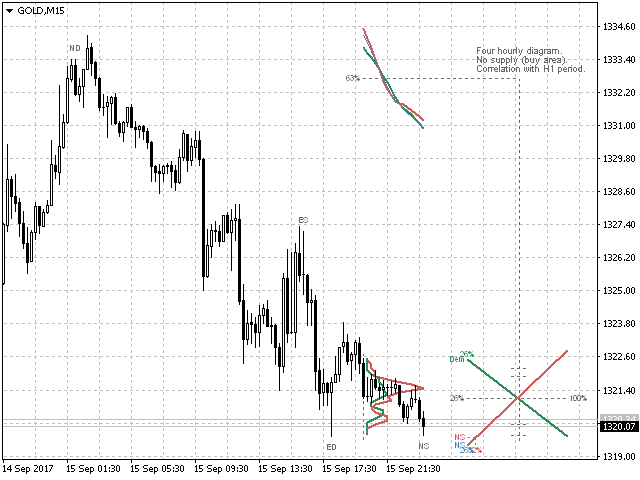
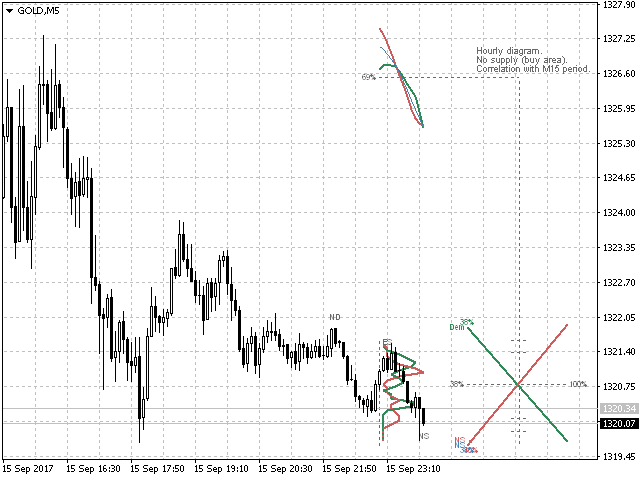
- ND - no hay demanda (acompañado de un mensaje de advertencia "Zona de venta").
- NS - ausencia de oferta (acompañada del mensaje de advertencia "Zona de compra").
También controla la secuencia de estas señales, determina la elasticidad de la demanda/oferta al precio y emite un mensaje de confirmación "Punto de compra" o "Punto de venta".
Variables de entrada
- Alertas - activa/desactiva la visualización adicional de señales en la ventana de alertas, así como mensajes push adicionales.
- Consejos - activa/desactiva los consejos de negociación.
- Etiquetas - activa/desactiva la visualización de etiquetas de señales en el gráfico.
- Visualización - activa/desactiva la visualización completa del diagrama (Alertas y Avisos mantienen su funcionalidad, si están activados).
- Posición - ubicación del diagrama a lo largo de la escala temporal.
- Media - modo de cálculo del punto medio del diagrama, media móvil o media ponderada basada en el volumen.
- Desviación - modo de cálculo de la amplitud del diagrama, el máximo o la desviación estándar.
- Señal - conjunto de datos (oferta y demanda y/o volumen total) a utilizar para la generación de la señal comercial.
- Reverse - activar/desactivar el modo de cálculo del diagrama en términos de órdenes limitadas.
- ExcessValidate - el modo de seguimiento de cadenas posteriores de señales, esta opción funciona como un filtro.
- ElasticityValidate - comprobar la elasticidad de la oferta/demanda al precio, con selección del tipo de apertura de posición; la opción actúa como filtro adicional.
- Profile - modo de cálculo del perfil de volumen: perfil normal, perfil de diferencia y perfil de interés abierto, obtenidos matemáticamente poniendo a cero sucesivamente los volúmenes mutuamente excluyentes.
- Timing - frecuencia de recálculo del diagrama.
- Volúmenes - tipo de volúmenes, tick o reales si los proporciona el broker.
- TfShift - desplazamiento del periodo aplicado.
- Correlación - activar/desactivar el modo de comprobación de la correlación entre las señales comerciales de los marcos temporales actual y superior.
- LowLevelValue - por debajo de este valor el volumen se considera bajo, en porcentaje.
- LowestLevelValue - por debajo de este valor el volumen se considera muy bajo, en porcentaje.
- HighLevelValue - por encima de este valor el volumen se considera alto, en porcentaje.
- HighestLevelValue - por encima de este valor el volumen se considera muy alto, en porcentaje.
- PeriodForXX - un período arbitrario para un marco temporal específico.
- DurationParts - el número de sectores del diagrama a lo largo de la escala temporal.
- StandardDeviations - multiplicador del modo de desviación estándar.
- ProfileMaxLengthPix - límite de la longitud del perfil en píxeles.
- LeftShiftPix - desplazamiento del diagrama hacia la izquierda, en píxeles.
- WidthPix - anchura del diagrama, en píxeles.
- FontSize - tamaño de la fuente.
Las entradas restantes se refieren a los ajustes de color y anchura de las líneas, y su propósito queda claro por sus nombres.
Características de la operación
La presencia de un "punto de compra" / "punto de venta" se expresa mediante un mensaje de texto, y también se acompaña de un parpadeo de la etiqueta de precio correspondiente. Sólo estas dos combinaciones juntas deben percibirse como una presencia válida de la señal.
El recálculo completo del diagrama se realiza según la variable Timing, se comprueba una señal en cada tick.
Una línea con anchura cero no se muestra y no se tiene en cuenta en la formación de señales.
Puede desplazarse por el gráfico y ver su diagrama histórico y las señales.
Las alertas y los consejos de negociación se dan para los periodos que van del actual al superior.
Los volúmenes en el diagrama son acumulativos y normalizados al cálculo porcentual.


Евгений, добрый день! Пофиг на звезды, их явно не хватает. Пользуюсь комплектом из Ваших индикаторов: собственно диаграмма и еще кумулятив дельта. Хочу вам выразить огромную благодарность, ибо это просто пушка - ракета. Творите и создавайте дальше, нам во благо. Спасибо большое!!!