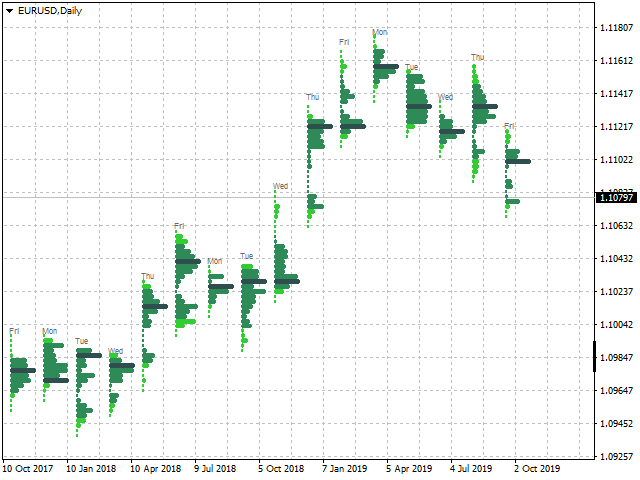
Clusters Chart MT4
- Indicadores
-
Evgeny Shevtsov
 Indicators for volume trading :
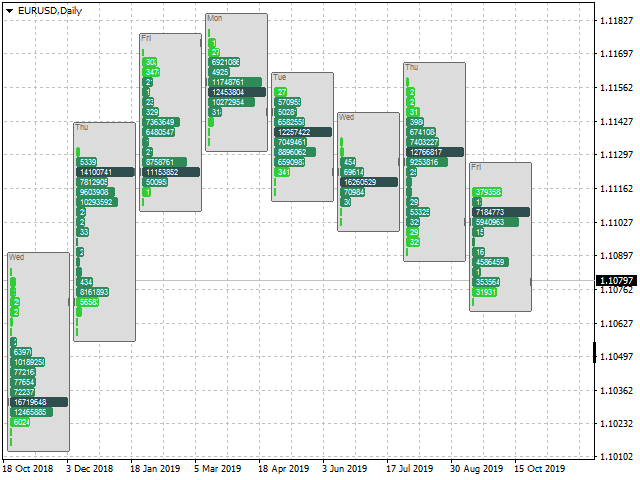
Volume profile,
Classic profile,
Clusters chart,
Demand and supply levels,
Demand and supply diagram,
Cumulative delta.
Indicators for probabilistic analysis :
Monte Carlo predictor,
Neural predictor. - Versión: 3.4
- Actualizado: 30 abril 2026
- Activaciones: 10
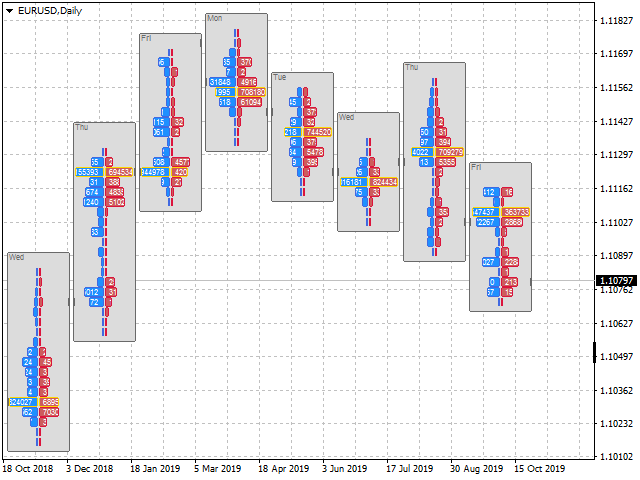
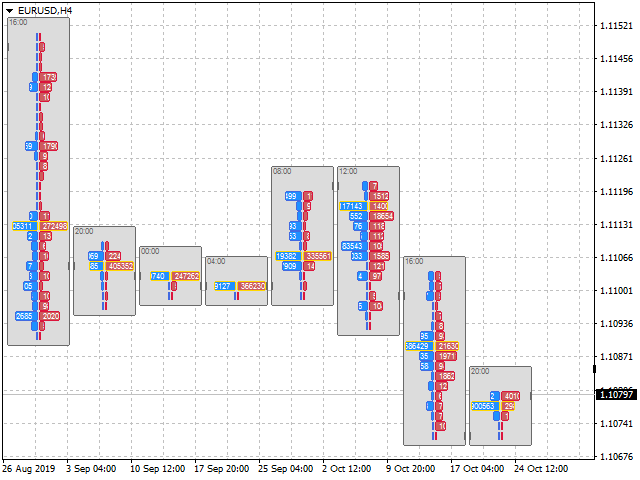
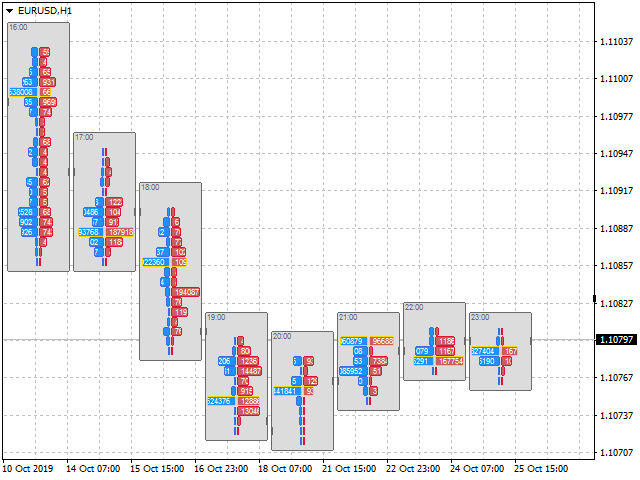
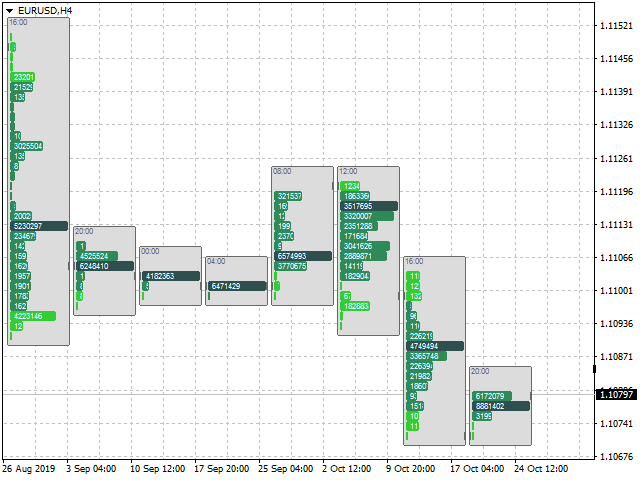
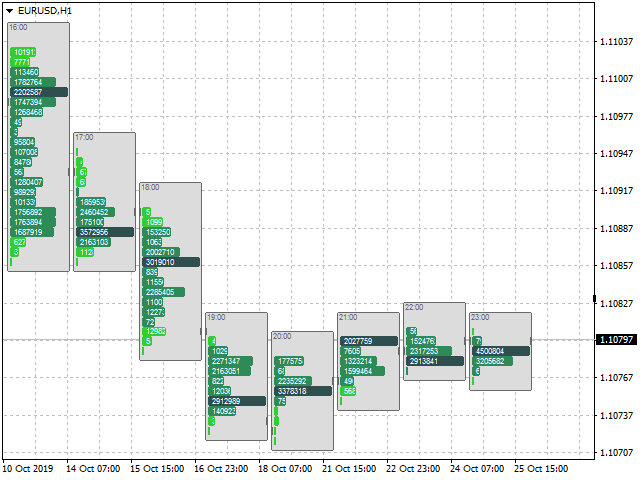
El indicador muestra grupos de volúmenes o perfiles de volúmenes entre los que elegir.
Variables de entrada
StepPoint - paso del cluster en puntos, si el valor es cero, el paso se asigna automáticamente.
AssociatedTimeframe - vinculación del indicador al marco temporal especificado del gráfico, si el valor es igual a Current, el indicador funciona en todos los marcos temporales.
ClustersVolume - volumen en clusters:
- All - todo el volumen.
- Active - volumen activo (que produjo el movimiento del precio).
ClustersAsDelta - diferencia entre el volumen de compradores y vendedores.
ProfilesVolume - volumen en clusters de perfiles:
- All - todo el volumen.
- Active - volumen activo (que produjo el movimiento del precio).
ProfilesAsDelta - diferencia entre el volumen de compradores y vendedores.
ProfilesValueArea - tamaño del área de valor del perfil.
ProfilesValueAreaType - modo de cálculo del área de valor:
- OfPocND - distribución relativa al nivel de POC.
- OfTotalVolume - distribución relativa al volumen negociado en el perfil.
FramesDelta - visualización del delta agregado para cada marco de clusters.
FramesCompare - normaliza la longitud visual de los clusters relativa al cluster de volumen máximo en la ventana del gráfico.
SignReverse - inversión del volumen de los clusters (compradores como vendedores, y vendedores como compradores).
VolumeType - tipo de volúmenes utilizados para los cálculos:
- Tick - volúmenes tick.
- Real - volúmenes reales (si se emite desde un broker).
- Without - modo alternativo, sin los volúmenes.
El resto de las variables están relacionadas con los ajustes de color, y su propósito es claro a partir de su nombre.
Características del indicador
El indicador requiere la carga previa del historial, en particular el historial de M1 y M5.
Durante su funcionamiento, el indicador cambia la escala del gráfico en el eje de precios, y también sustituye la imagen del gráfico, como resultado, el funcionamiento de algunos otros indicadores en la ventana del gráfico puede ser incorrecto.
El indicador no funciona en el marco temporal M1.


Good