Market Marker MT4
- Indicadores
-
Evgeny Shevtsov
 Indicators for volume trading :
Volume profile,
Classic profile,
Clusters chart,
Demand and supply levels,
Demand and supply diagram,
Cumulative delta.
Indicators for probabilistic analysis :
Monte Carlo predictor,
Neural predictor. - Versión: 3.7
- Actualizado: 5 noviembre 2023
- Activaciones: 10
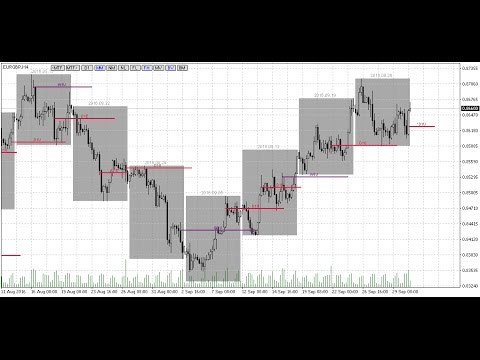
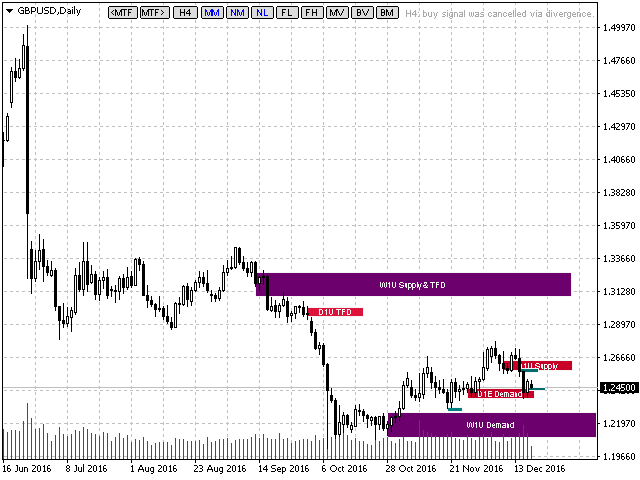
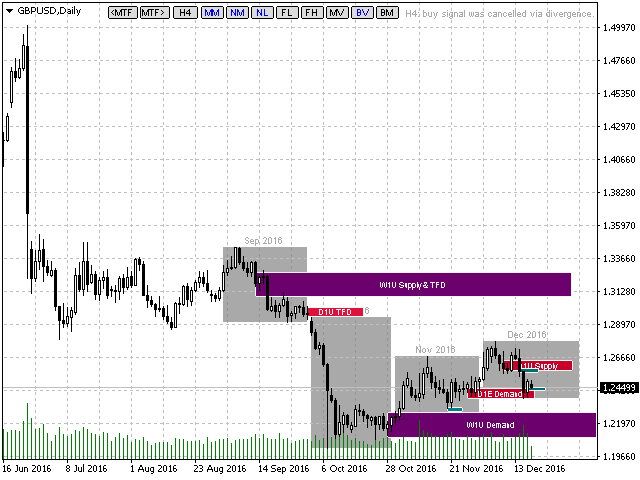
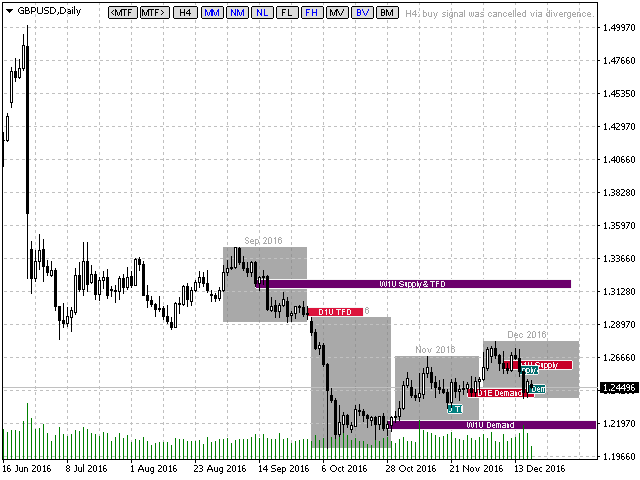
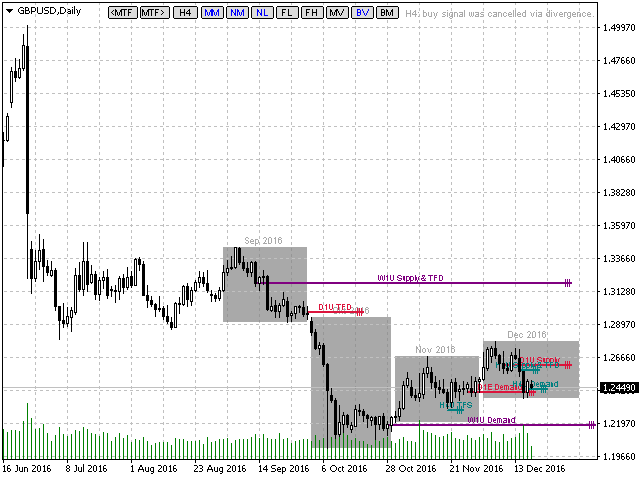
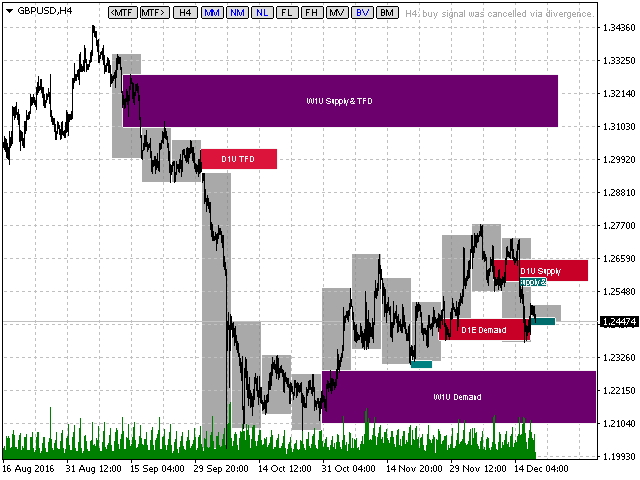
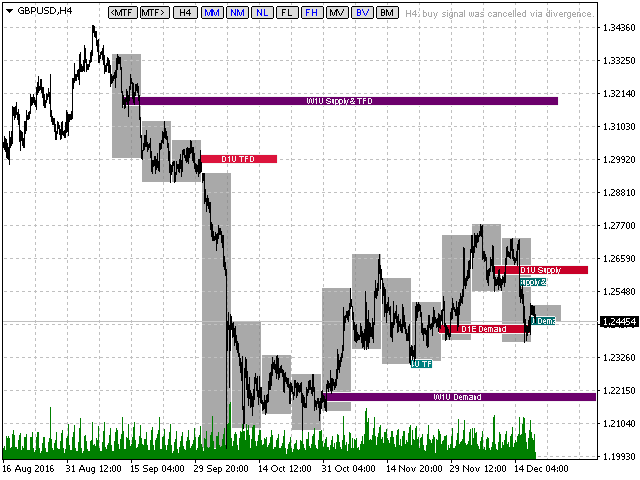
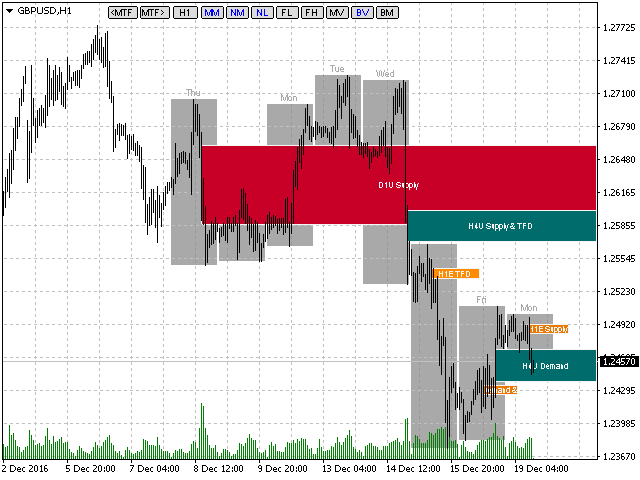
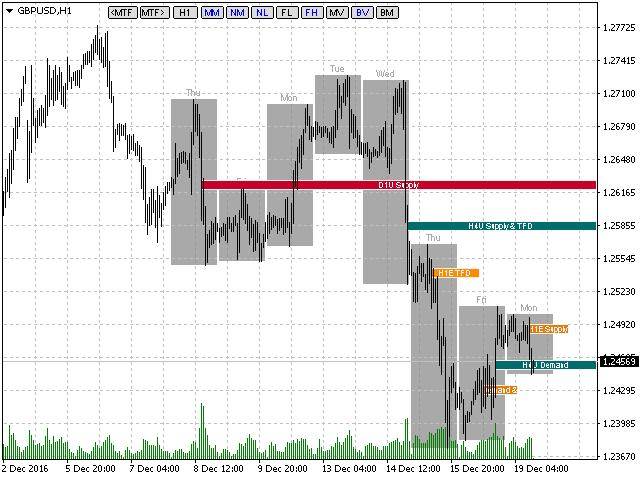
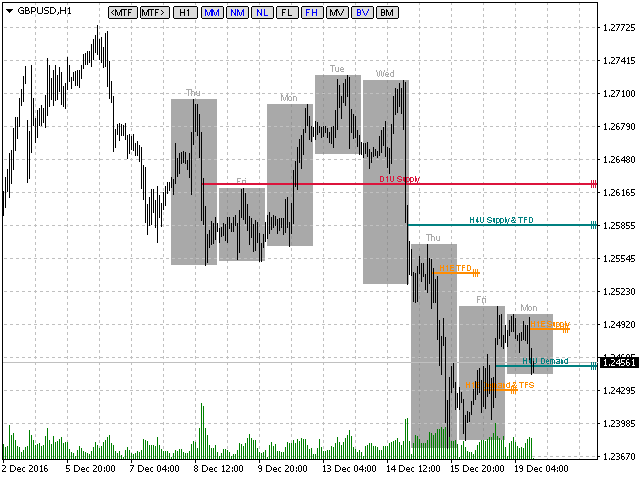
El indicador muestra los niveles máximos de actividad formados por el volumen máximo, sigue la correlación de las velas en todos los marcos temporales (del más alto al más bajo). Cada nivel de volumen es un tipo de actividad comercial clave. La agrupación más importante se encuentra dentro de un mes, semana, día, hora, etc.
Características de funcionamiento del indicador
Un nivel de volumen recibe el estado de Demanda si el nivel de volumen más cercano situado a la izquierda y por encima se ha roto al alza. Un nivel de volumen recibe el estado de Oferta si el nivel de volumen más cercano situado a la izquierda y por debajo se ha roto a la baja.
Además de los niveles de oferta y demanda, el indicador encuentra niveles objetivo - TFD (Target For Demand) y TFS (Target For Supply). Un nivel objetivo para una demanda es el nivel más cercano situado a la izquierda y por encima y que no se ha roto hacia arriba. Un nivel objetivo de oferta es el nivel más cercano situado a la izquierda y por debajo y no roto hacia abajo.
Botones de los indicadores
- MTF (MarkersTimeFrame) - seleccione el periodo a partir del cual se muestran los niveles de volumen.
- MM (MarkersMode) - activar/desactivar el modo de visualización de niveles.
- NM (NearestMarkers) - muestra sólo los niveles más cercanos en el tiempo que están por encima y por debajo del precio de apertura actual. El número de niveles mostrados es establecido por el parámetro de entrada MarkersLastNearest.
- NL (NormalizationLength) - la longitud de los niveles es proporcional a los volúmenes de las velas del marco temporal al que pertenecen. Como resultado, los niveles de los marcos temporales más altos se hacen más largos, permitiéndole verlos más claramente. En el modo normal, la longitud de los niveles es proporcional a los volúmenes de las velas del marco temporal actual.
- FL (FixLength) - utiliza la longitud fija de los niveles establecida en píxeles del monitor (la longitud en sí se establece mediante el parámetro de entrada MarkersFixLength).
- FH (FixHeight) - utiliza la altura fija de los niveles establecidos en píxeles del monitor (la altura se establece mediante el parámetro de entrada MarkersFixHeight).
- MV (MarkersView) - representación de los niveles: líneas gruesas o finas.
- BV (BordersVisible) - activar/desactivar los marcos de periodo.
- BM (BoxMode) - activar/desactivar el modo de coloreado de las barras.
Entradas
- Alertas - activa/desactiva la visualización adicional de consejos de negociación en la ventana de alertas.
- Consejos - activa/desactiva los consejos de negociación.
- VolumeIncreaseCheck - cancela la señal si el volumen aumenta a medida que el precio se acerca al nivel.
- BackwardBalanceCheck - cancela la señal si el balance total del resumen se invierte cuando el precio sale del nivel y vuelve a él.
- ShowPreliminaryMarkers - mostrar/ocultar los niveles preliminares.
- VolumesType - tipo de volúmenes: tick o reales si los proporciona el broker.
- ButtonsPosition - disposición de los botones.
- MarkersArea - ancho de los niveles basados en el marco de tiempo, medido en ATR.
- MarkersLastNearest - número de los niveles más cercanos mostrados en modo NM.
- BoxContrast - parámetro de visualización para el modo BM, por defecto - 1.0, paso fraccionario. Si el gráfico tiene demasiadas barras moradas y rojas, disminuya el valor de la variable por debajo de 1.0. Si el gráfico tiene demasiadas barras grises y amarillas y casi ninguna roja y púrpura, establezca el valor de la variable por encima de 1.0. Este parámetro sólo se establece una vez.
- FutureSymbol - si opera con un par de divisas o con futuros, deje el campo completamente en blanco. Si opera con índices, y su broker proporciona cotizaciones también para los futuros sobre el índice, entonces introduzca el nombre del instrumento que indica esos futuros en este campo, por ejemplo, #S&P500_M6. De este modo, el indicador funcionará sobre el índice, pero los datos sobre el volumen se tomarán de los futuros.
Las entradas restantes se refieren a otros ajustes (color de la línea, tamaño de la fuente de anchura o longitud, etc.), y su propósito es claro a partir de sus nombres.


Хороший индикатор.