AnyProfile MT5
- Indicadores
-
Evgeny Shevtsov
 Indicators for volume trading :
Volume profile,
Classic profile,
Clusters chart,
Demand and supply levels,
Demand and supply diagram,
Cumulative delta.
Indicators for probabilistic analysis :
Monte Carlo predictor,
Neural predictor. - Versión: 4.6
- Actualizado: 30 abril 2026
- Activaciones: 10
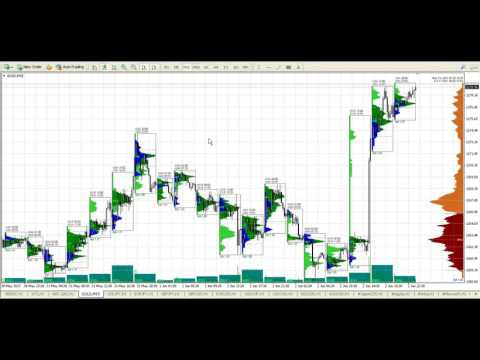
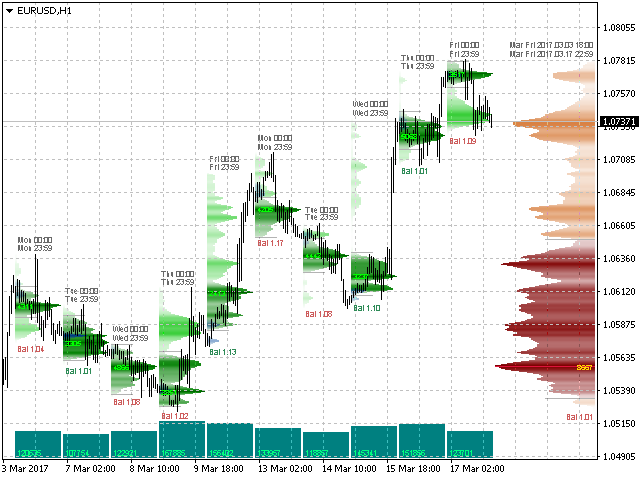
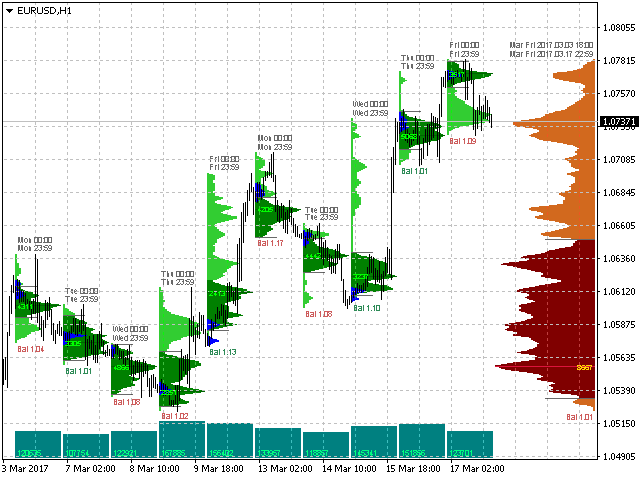
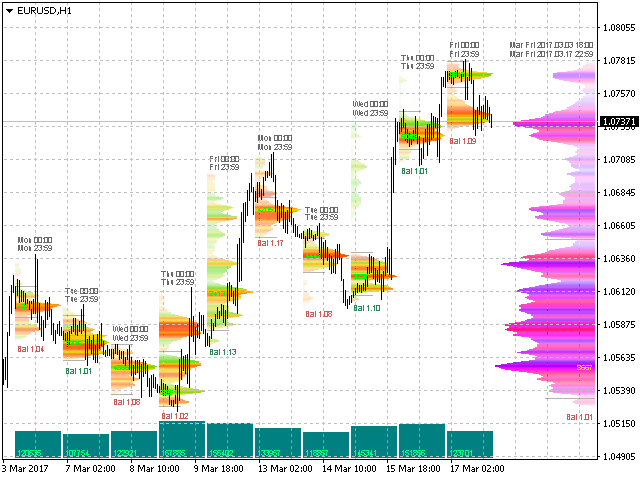
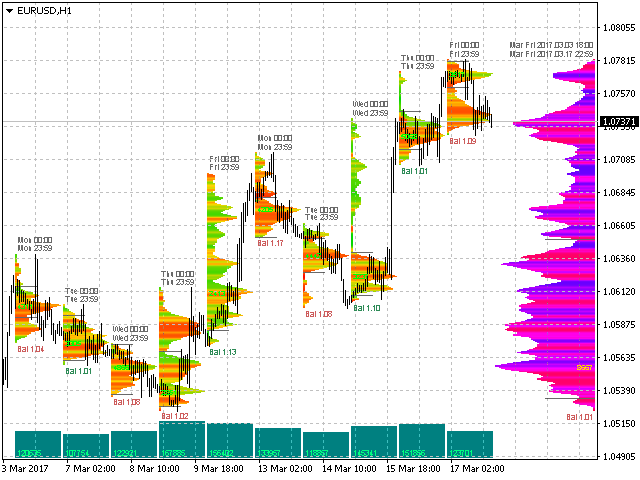
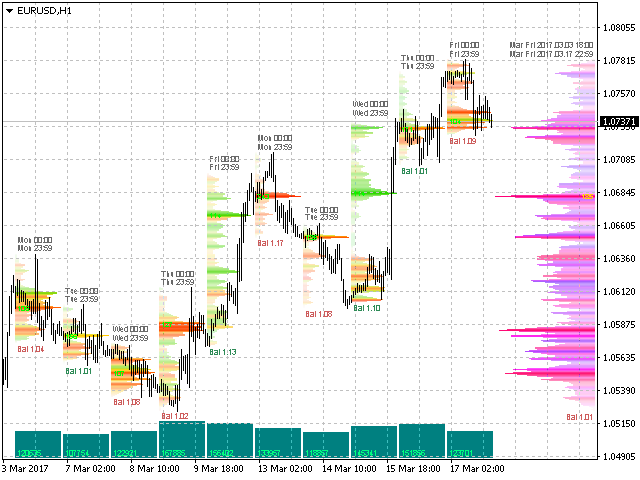
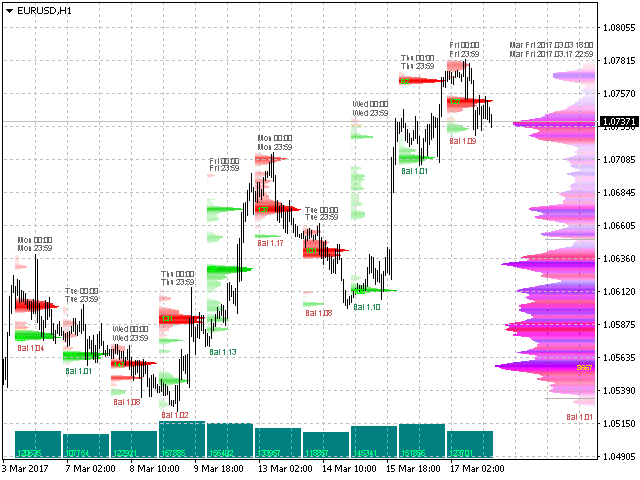
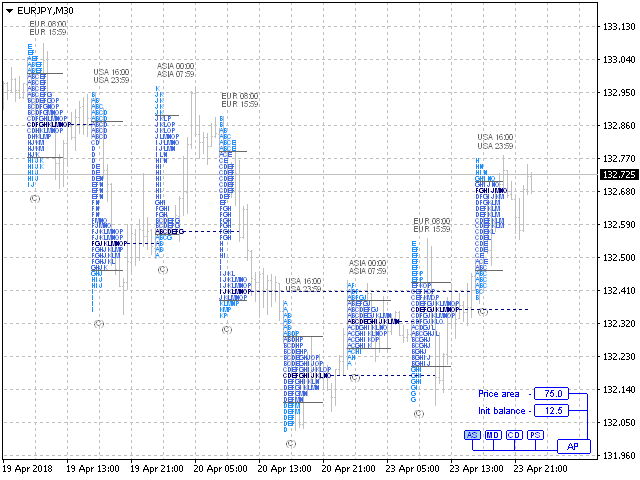
El indicador muestra perfiles de mercado de cualquier duración en cualquier lugar del gráfico.
Basta con crear un rectángulo en el gráfico y éste se rellenará automáticamente con el perfil. Cambie el tamaño del rectángulo o muévalo: el perfil seguirá automáticamente los cambios.
Características de funcionamiento
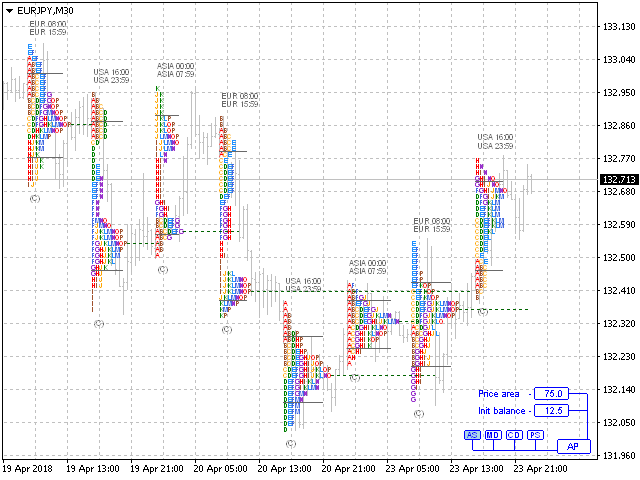
El indicador se controla directamente desde la ventana del gráfico utilizando el panel de botones y campos para introducir parámetros.
En la esquina inferior derecha de la ventana del gráfico hay un botón emergente "AP" del menú principal, que está dividido condicionalmente en dos mitades - al hacer clic en la mitad izquierda se cambian los grupos de botones de control, al hacer clic en la mitad derecha se cambian los grupos de campos para introducir parámetros.
La ventana de propiedades del indicador contiene, básicamente, sólo variables de entrada relacionadas con los ajustes de colores, tamaño de letra, grosor de línea, etc.
El indicador recuerda los ajustes (estado de los botones y valores de los campos numéricos) individualmente para cada marco temporal.
La descripción de los controles del indicador se encuentra en la pestaña "Comentarios" del post 293 del 21/11/2021.


Hello Traders, if you are looking for an indicator that will help you find sniper entries, then look no further. AnyProfile (Volume Profile, and so much more!) will help you follow big institutions as they are not able to hide their footprints. Volume is often overlooked or underused, but it is the only true indication of where big institutions are building their positions. Candle patterns, trendlines, S&R, S&D, inducement, etc. are created by big institutions to take your money (mostly algos, which is why they are often so precise), but they can't manipulate volume and you can bet they will defend their positions. AnyProfile can assist you in trading with the big institutions and not against them. I never place a trade without consulting it first. You will find that this is the only indicator that you will want on your charts. Go get it!