RenkoZigZag
- Indikatoren
-
Sergey Deev
 I'm implementing your ideas in MQL4: https://www.mql5.com/ru/job/new?prefered=work2it
 - Version: 1.4
- Aktualisiert: 6 April 2018
- Aktivierungen: 5
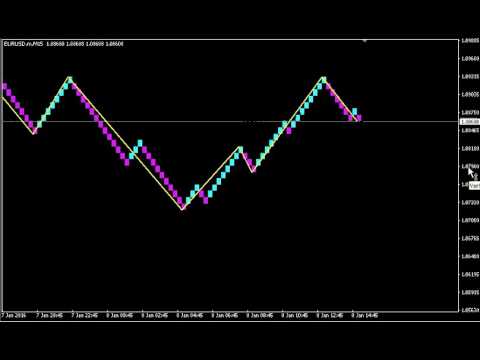
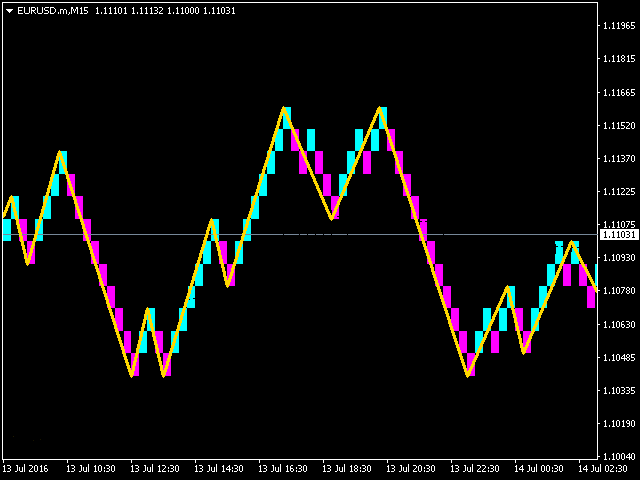
Der Indikator zeigt Renko-Balken auf dem Diagramm an und verwendet sie, um die ZigZag-Trendlinien zu zeichnen, die die lokalen Tiefs und Hochs der Preisbewegung verbinden.
Renko - spezialisierte Darstellung der Kursbewegung, bei der die Grafik nicht bei jedem Balken des Zeitrahmens angezeigt wird, sondern nur unter der Bedingung, dass der Kurs mehr als die angegebene Anzahl von Punkten passiert hat. Renko-Balken sind nicht an einen Zeitrahmen gebunden, so dass der Indikator auf jedem Zeitrahmen mit der gleichen Effizienz arbeiten kann.
Diese Implementierung des ZigZag-Indikators basiert auf zwei Parametern: zzDev (Mindestabweichung in Prozent der vorangegangenen Bewegung) und zzBack (Mindestanzahl der Renko-Balken, die sich in die der vorangegangenen Bewegung entgegengesetzte Richtung bewegen).
Beschreibung der Parameter des Indikators:
- RenkoBar - Größe eines Renko-Balkens in Punkten (wird bei 5-stelligen Kursen automatisch neu berechnet);
- CountBars - Anzahl der Renko-Balken, die auf dem Chart angezeigt werden;
- bearColor - Farbe eines bärischen Renko-Balkens;
- bullColor - Farbe eines bullischen Renko-Balkens;
- hideBars - Flagge zum Ausblenden der üblichen Balken auf dem Diagramm;
- zzDev - Abweichung von der vorherigen Bewegung in Prozent;
- zzBack - Abweichung von der vorherigen Bewegung als Anzahl der Renko-Balken;
- zzColor - Farbe der ZigZag-Linien;
- zzWidth - Breite der ZigZag-Linien.