Pearson Indicator Correlator
- Indicadores
-
Andrei Muzov
 Разработал алгоритм для расчета объема покупок и продаж актива. Volume Decomposition Index (VDI).
 - Versión: 1.0
- Activaciones: 5
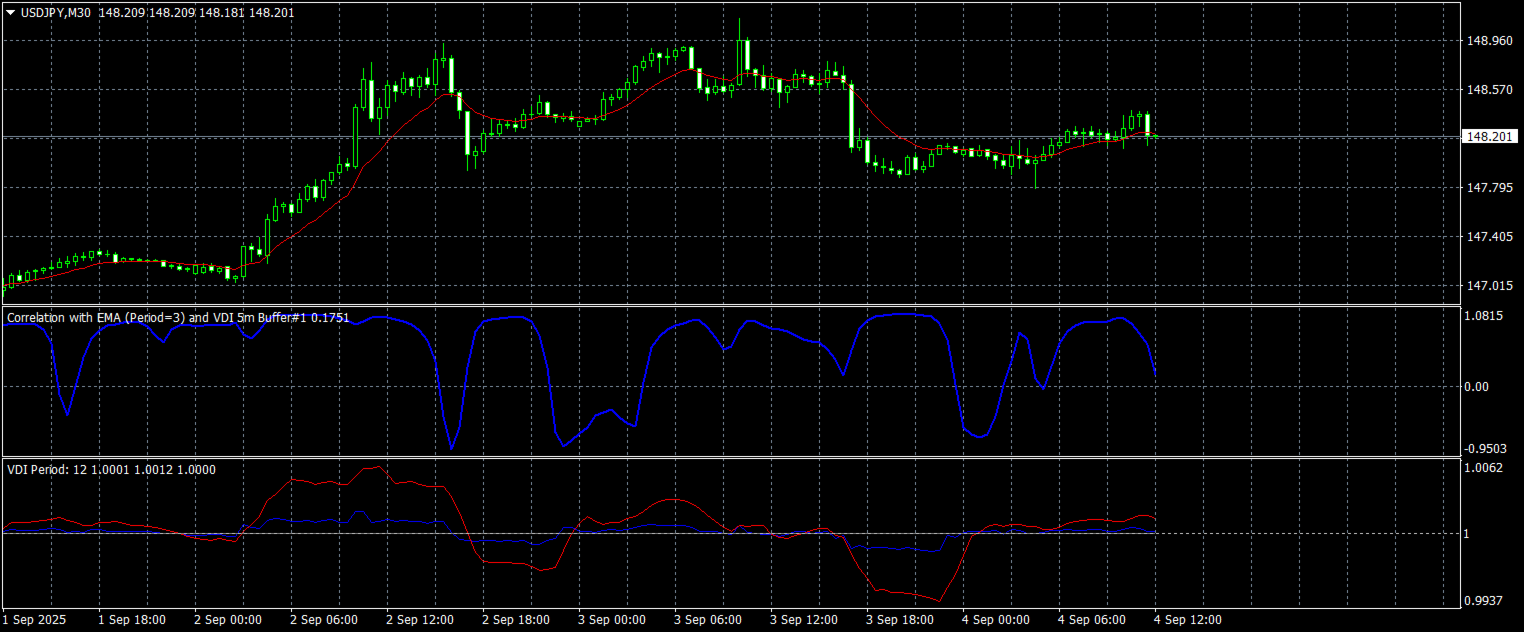
Pearson Indicator Correlator es un indicador estadístico personalizado que calcula el coeficiente de correlación de Pearson entre la media móvil exponencial (EMA) y cualquier otro indicador que usted elija, ya sea estándar o personalizado.
El indicador ayuda a filtrar señales falsas, detectar la coherencia del movimiento, así como divergencias entre la tendencia y las líneas de señal.
Se utiliza para:
-
filtrar señales de otros indicadores,
-
analizar la coherencia de los movimientos,
-
detectar divergencias entre la tendencia y las líneas de señal.
Muestra un valor de -1 a +1, visualizando el grado de sincronización. Puede aplicarse con cualquier indicador personalizado o estándar.
Instrucciones:
-
Ingrese en los parámetros el nombre del indicador con el que se debe calcular el coeficiente de correlación.
-
Es obligatorio especificar el buffer donde se encuentra el valor que necesita para el cálculo. Ejemplo: para la correlación con el histograma del indicador MACD, debe indicar el buffer 0; para las líneas de señal, el 1.
-
Seleccione los parámetros (periodo) del buffer del indicador con el que se calculará la correlación.
-
Seleccione el periodo de la EMA y el periodo para calcular el coeficiente de correlación.
Importante: si se selecciona un buffer incorrecto, el gráfico se mostrará igualmente, pero los valores serán incorrectos y no reflejarán la correlación real.