Pearson Indicator Correlator

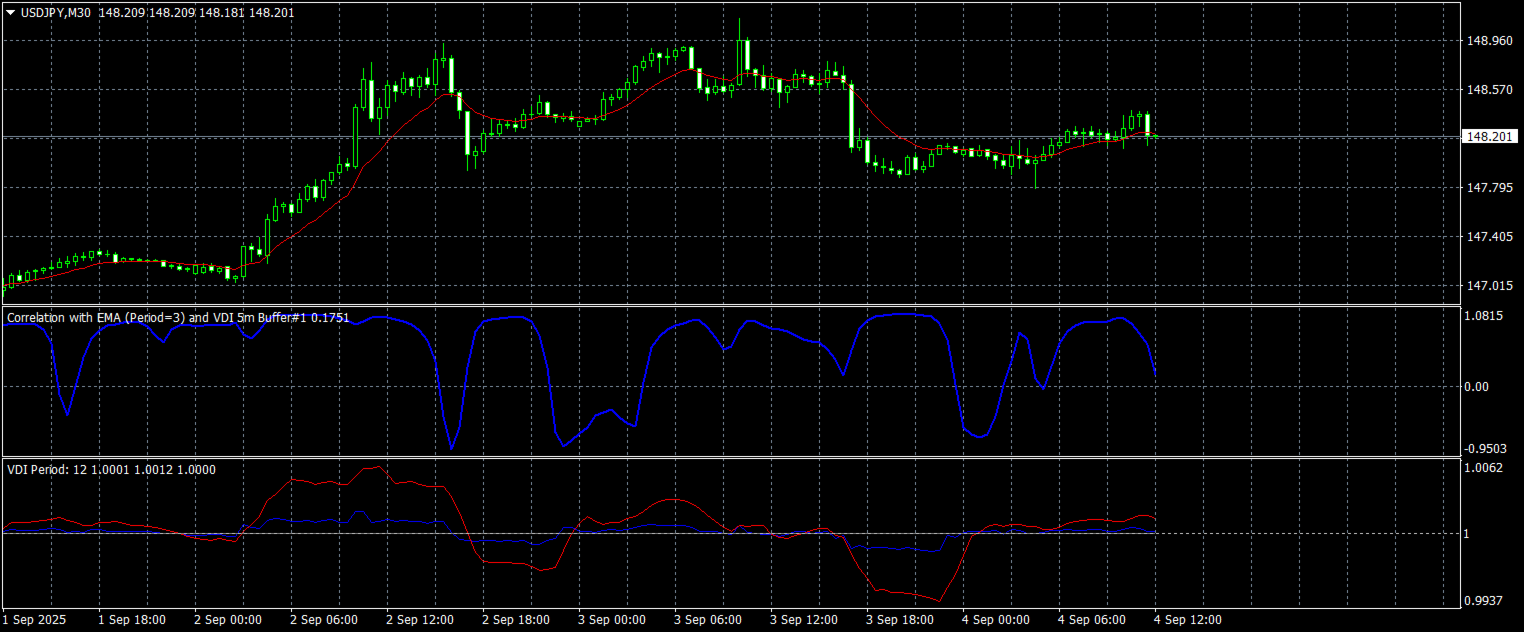
Pearson Indicator Correlator는 지수 이동평균(EMA)과 사용자가 선택한 표준 또는 사용자 지정 지표 간의 피어슨 상관 계수를 계산하는 맞춤형 통계 지표입니다.

이 지표는 잘못된 신호를 필터링하고, 움직임의 일치성을 파악하며, 추세와 신호선 간의 발산을 감지하는 데 도움을 줍니다.

사용 용도:

  • 다른 지표의 신호 필터링,

  • 움직임의 일치성 분석,

  • 추세와 신호선 간의 발산 감지.

-1에서 +1까지의 값을 표시하여 동기화 정도를 시각화합니다. 모든 사용자 지정 또는 표준 지표와 함께 사용할 수 있습니다.

사용법:

  1. 상관 계수를 계산할 지표의 이름을 매개변수에 입력하세요.

  2. 계산에 필요한 값이 포함된 버퍼를 반드시 지정하세요. 예: MACD 지표의 히스토그램과 상관관계를 계산하려면 버퍼 0을, 신호선과는 버퍼 1을 지정해야 합니다.

  3. 상관관계를 계산할 지표 버퍼의 기간(Period)을 선택하세요.

  4. EMA 기간과 상관 계수 계산 기간을 선택하세요.

중요: 잘못된 버퍼를 선택하면 차트는 표시되지만 값이 부정확하여 실제 상관관계를 반영하지 않습니다.


추천 제품
ReSu mt4
Daniel Opoku
The Wamek Support and Resistant (WSR) Indicator is a remarkable tool that stands out in the world of technical analysis. It sets itself apart by cleverly combining price action and leading indicators to delineate support and resistance levels with a high degree of accuracy. Its unique feature is its adaptability; users can fine-tune the indicator by adjusting input parameters, enabling them to create customized support and resistance levels that suit their trading strategies. Notably, one of WSR
Binary Option Signal
Yaroslav Varankin
Indicator for binary options arrow is easy to use and does not require configuration works on all currency pairs, cryptocurrencies buy signal blue up arrow sell signal red down arrow tips do not trade during news and 15-30 minutes before their release, as the market is too volatile and there is a lot of noise it is worth entering trades one or two candles from the current period (recommended for 1 candle) timeframe up to m 15 recommended money management fixed lot or fixed percentage of the depo
Pyro Trend
Oleksii Ferbei
Pyro Trend is a new product that allows you to identify the current market phase (uptrend, downtrend or flat). The indicator is applicable for any data and periods. The middle of the trend wave, as well as the edges, are places of special heat and market behavior; when writing the indicator, an attempt was made to implement precisely finding the middle. Pyro Trend is a trend indicator that uses an original calculation algorithm. This indicator paints arrows in different colors depending on the
Trend Divergence Indicator: Your Essential Tool for Market Analysis The Trend Divergence Indicator is a powerful tool designed to assist traders in identifying market trends and pinpointing entry points with precision. By leveraging price divergence, this indicator enhances your trading strategy, offering reliable insights and filtering unnecessary signals. Key Features and Benefits of the Trend Divergence Indicator Accurate Trend Analysis: The Trend Divergence Indicator uses price divergence t
High Low Predict
Thomas Bradley Butler
This indicator is designed to help you forecast the potential high and low prices for the current trading day, based on the high and low of the previous day. It does this by applying a customizable percentage increase or decrease to those levels. How It Works: The idea is simple: It looks at the previous day's high and low prices and then adjusts them by a percentage you choose. Here's what that means: Predicted High: This is calculated by taking the high price of the previous day and adding a p
A Fibonacci indicator is best used with other indicators like Pivots, Support/Resistance etc. Price tends to use Fibo levels as Support or Resistance lines. So, this indicator is very useful to know when price might reverse or if a level is crossed, price might continue the trend. Also, to find the best Take Profit and StopLoss lines. Don't use Fibo Indicator alone for trading as it might not always be accurate. Use it to make your strategies better as a supporting indicator. Settings: Auto Fib
FREE
안녕하세요, 이것은 빙입니다. ICT 개념을 거래하기 위한 신뢰할 수 있는 지표를 찾고 있다면, ICT Market Structure는 보다 고급 전략을 사용하는 트레이더들을 위한 사용자 매뉴얼을 제공합니다. 이 올인원 지표는 ICT 개념(스마트 머니 개념)에 초점을 맞추고 있습니다. ICT Market Structure는 기관들이 어떻게 거래하는지 이해하려고 하며, 그들의 움직임을 예측하는 데 도움이 됩니다. 이 전략을 이해하고 활용함으로써, 트레이더들은 시장 움직임에 대한 귀중한 통찰력을 얻고 가격 행동에 기반한 더 실용적인 진입 및 청산 포인트를 찾을 수 있습니다. 다음은 일부 기능에 대한 간단한 소개입니다: 비재페인팅, 비리드로잉, 비래깅 지표 오더 블록(상승 및 하락), 볼륨 메트릭스와 얼럿이 있는 오더 블록 실시간 시장 구조와 스윙 구조 고점과 저점(HH, HL, LL, LH)과 얼럿이 있는 구조 붕괴(BOS), 성격 변화(CHoCH)/ 모멘텀 변화(MS) 브레이커 블록
I recommend you to read the   product's blog  (manual) from start to end so that it is clear from the beginning what the indicactor offers. This multi time frame and multi symbol supply and demand zone dashboard indicator sends alerts when the price has reached a supply/demand zone. It is also possible to use it to be alerted about regular double tops/bottoms instead of zones. It can be used with all time frames from M1 to MN. It is possible to use RSI, divergence (MACD, OsMA, RSI or Awesome) a
Indicador de Fibonacci Semanal para MT4 Maximize suas operações no mercado financeiro com o Indicador de Fibonacci Semanal para MetaTrader 4 (MT4) , a ferramenta essencial para traders que buscam identificar pontos estratégicos de suporte e resistência com base na ação do preço da última semana. Principais Recursos: Atualização Automática : O indicador recalcula os níveis de Fibonacci automaticamente a cada novo candle semanal. Níveis Personalizados : Traça apenas os níveis essenciais de Fibonac
Super Arrow Indicator for MetaTrader 4 The Super Arrow indicator is a popular signal tool designed for the MetaTrader 4 platform. It combines multiple technical indicators—such as the RSI , Bollinger Bands , Moving Averages , and a Magic Filter —to identify key market reversal points and pivot highs and lows. On the chart, green arrows highlight pivot lows, while red arrows mark pivot highs. By merging these indicators into one system, Super Arrow provides a strong filtering mechanism capable of
FIBO Trend PRO mt4
Evgenii Aksenov
5 (6)
The indicator allows you to instantly determine the current trend by color and FIBO levels. Higher Timeframe the panel shows the current trend of higher periods, helping to determine the strength of the trend Trade according to the trend when changing the color of candles or trade against the trend when the price hit the extreme levels of the   FIBO Trend PRO  indicator     Advantages of the FIBO Trend PRO Indicator never repaint and does not change their values Very easy to use and intuitive
OBTE = Order Block Type I OBTI Indicator MT4 is the most accurate and customizable indicator on the market. It was developed to facilitate the analysis of operations based on candlestick patterns and supply-demand zones. These zones are possible movement reversal points. For this indicator is generated by the order block of smart money concept. Input parameters: 1. Multiple timeframes : M1 M5 M15 M30 H1 H4 D1 W1 MN1 2. Default input: H1 H4 D1 W1 MN1 3. Notifications / Send Emails / Notification
이 지표는 실제 거래에 완벽한 자동 파동 분석 지표입니다! 사례... 참고:   웨이브 그레이딩에 서양식 이름을 사용하는 데 익숙하지 않습니다. Tang Lun(Tang Zhong Shuo Zen)의 명명 규칙의 영향으로 기본 웨이브를   펜   으로 명명하고 2차 웨이브 밴드를   세그먼트   로 명명했습니다. 동시에, 세그먼트에는 추세 방향이 있습니다.   주요 추세 세그먼트에는   이름이 지정되지만(이 이름 지정 방법은 향후 노트에서 사용됩니다. 먼저 말씀드리겠습니다.) 알고리즘은 굴곡 이론과 거의 관련이 없으므로 그렇게 해서는 안 됩니다. 이는 나의 시장 분석을   통해 요약된 끊임없이 변화하고 복잡한 운영 규칙을   반영합니다. 밴드는 더 이상 사람마다 다르지 않도록 표준화되고 정의되었습니다. 인위적인 간섭의 드로잉 방법은 시장 진입을 엄격하게 분석하는 데 핵심적인 역할을 합니다. 이 지표를 사용하는 것은 거래 인터페이스의 미학을 개선하고 원래의 K-line 거래를
First Dawn
Innovicient Limited
The First Dawn indicator uses a unique mechanism to search and plot signals. This keeps searching for signals, making it a great indicator for scaping and identification of changes in direction, swing trading and trend trading. The  First Dawn   helps you get early signals. The backtest gives the true picture of how the indicator works with real/demo accounts. Although this is a tiny indicator it is packed with advantageous settings that will help you whether you desire to: Snap the Peaks and
This product works by detecting trend opportunities. So as shown in the screenshot when The indicator shows an upward arrow it shows the market is on an uptrend and when the indicator Shows a downward arrow it shows the market is on a downward direction. What makes this indicator Special is that it has additional signals just below the arrow signals. It is up to the trader to be  Creative and combine these signals with the arrow signal to get accurate forecasts.
The new update makes this indicator a complete tool for studying, analyzing and operating probabilistic patterns. It includes: On-chart Multi-asset percentage monitor. Configurable martingales. Twenty-one pre-configured patterns , including Mhi patterns and C3. An advanced pattern editor to store up to 5 custom patterns. Backtest mode to test results with loss reports. Trend filter. Hit operational filter. Martingale Cycles option. Various types of strategies and alerts. Confluence between patte
The Momentum Standard/Hidden Divergence indicator will plot the momentum, and will also identify and plot standard (regular) divergences between the indicator and the price action, OR it can be set to identify and plot hidden (reverse) divergences between the indicator and the price action. The divergences themselves are implemented as lines (default green for bullish divergence and red for bearish divergence) drawn in the indicator pane. If activated via the Inputs dialog, alerts will be genera
Chart Analyzer
Innovicient Limited
The Chart Analyzer is an MT4 indicator that provides visual arrow signals without redrawing them. In addition, we have included trendlines to validate your entries. This indicator has been fine-tuned to work with all timeframes and instruments.  The Chart Analyzer has a number of advantages Does not fade or remove arrows when drawn Sends both email and phone alerts. It is light on computer resources Easy to install. Default setting works just fine.  If price opens above the trendline, open bu
This is  a dashboard indicator that displays the Average Level of each selected currency pairs that filters and gives us a signal for overbought (>=90%) or if price at extreme peak above 90, and/or oversold (<=10%) or if price at extreme peak below 10. The calculation is using Relative Strength Index default periods (2 & 9) applied to three different higher time frames H4,D1,&W1. This won't change or altered even if you change symbol or switch to lower time frames or even in monthly and year
PZ Mean Reversion MT4
PZ TRADING SLU
3 (4)
평균 회귀 거래에 대한 전문적이고 정량적인 접근 방식을 구현하는 고유한 지표입니다. 이는 가격이 예측 가능하고 측정 가능한 방식으로 평균으로 전환되고 반환된다는 사실을 이용하여 비정량적 거래 전략을 훨씬 능가하는 명확한 진입 및 퇴장 규칙을 허용합니다. [ Installation Guide | Update Guide | Troubleshooting | FAQ | All Products ] 명확한 거래 신호 놀랍도록 쉬운 거래 사용자 정의 가능한 색상 및 크기 성능 통계 구현 대부분의 거래 전략을 능가합니다. 적절한 SL 및 TP 레벨을 표시합니다. 이메일/음향/시각 알림을 구현합니다. 작동 원리 이 지표는 더 높은 기간에서 완전히 사용자 정의 가능한 이동 평균 주변의 표준 편차를 측정하고 추세 추종 접근 방식을 사용하여 정확하게 거래를 찾습니다. 거래는 현재 차트의 가격 동작을 살펴보고 선택한 더 높은 기간에서 계산된 평균 가격대로 가격이 돌아오면 닫힙니다. 코딩 방식 때문에 지
Evolution Marvel EURCHF Expert Advisor uses independent strategies, including trading on short-term and long-term trends! Trades on the eurchf m5 currency pair by default! Rent for a month is a little. The system sometimes stands still in terms of profitability and if you conduct a test, you can see it. At the time of loading Evolution Marvel EURCHF to the market, the EA was updated and will now make more transactions than initially on the signal! The EA opens a maximum of 3 positions in one d
MT4용 Crypto_Forex 지표 "동적 과매수/과매수 구간을 포함하는 CCI" (재도색 불필요) - 상품 채널 지수(CCI)는 추세 방향으로의 모멘텀 트레이딩에 매우 유용합니다. - 동적인 과매수 구간에서 매도 진입을, 동적인 과매도 구간에서 매수 진입을 주요 추세 방향으로 유도하는 데 매우 유용합니다. - 이 지표는 가격 움직임 진입과도 결합하면 매우 유용합니다. - 동적인 과매수 구간 - 노란색 선 위. - 동적인 과매도 구간 - 파란색 선 아래. - CCI 오실레이터는 현재 가격과 과거 평균 가격의 차이를 측정합니다. - PC 및 모바일 알림 기능 제공. // 훌륭한 트레이딩 로봇과 지표는 다음 링크에서 확인하실 수 있습니다:   https://www.mql5.com/en/users/def1380/seller MQL5 웹사이트에서만 제공되는 오리지널 상품입니다.
WhaleFinder MT4
Kazuya Yamaoka
Considering the main theories of Forex (Dow Theory, support lines, chart patterns, and Fibonacci retracements), It tells you the price range where whales (large investors) are likely to appear. You can trade at the price points that professionals also aim for. You no longer have to warry about where to aim next. We are live-streaming the actual operation of the system. Please check for yourself if it is usable. Please check it out for yourself. https://www.youtube.com/@ganesha_forex We do not
The ABC Indicator analyzes the market through waves, impulses, and trends, helping identify key reversal and trend-change points. It automatically detects waves A, B, and C, along with stop-loss and take-profit levels. A reliable tool to enhance the accuracy and efficiency of your trading. This product is also available for MetaTrader 5 =>  https://www.mql5.com/en/market/product/128178 Key Features of the Indicator: 1. Wave and Trend Identification:    - Automatic detection of waves based on mov
TRENDIEST TREND LINE   ️️️️️ Do you want to become a constantly profitable 5-star forex trader? ️️️️️ Trendiest Trend Line is a one of a kind trend line indicator, Trend lines work until the market reverses or consolidates. Easily stay out of the chop and stay in the long trends! Key Features of Trendiest Trend Line Stay in strong trends longer with confidence Clearly shows you when the market is ranging to save you money Entry signals help you get in at a good price 100% reliable re
TripleFusion
Rami Fatmi Fernandez
It is a technical indicator that combines three of the most popular oscillators in technical analysis: MACD, RSI, and Stochastic. The integrated advanced formula combines their signals to provide a single, clear and effective line, eliminating noise and helping you make quick, visual decisions. What makes this indicator unique? Integrates the difference between the MACD, RSI, and Stochastic into a single combined formula. It displays the result in a separate window, like the ATR, making i
MT4용 Crypto_Forex 지표 "프랙탈 채널" - 이 지표는 프랙탈의 고점/저점을 기반으로 실제 로컬 추세선을 보여줍니다. - 그래픽 분석을 사용하는 트레이더에게 유용합니다. - 저항선 로컬 추세선 - 빨간색 - 지지선 로컬 추세선 - 파란색 - 프랙탈 개수, 추세선 색상 및 너비를 결정하는 몇 가지 매개변수가 있습니다. - 이 지표는 현재 시장 상황을 파악하는 데 유용합니다. - 강세장 - 두 선 모두 상승할 때 - 약세장 - 두 선 모두 하락할 때 - 횡보장 - 두 선 모두 반대 방향으로 움직일 때 ............................................................................................. 여기를 클릭하여 고품질 트레이딩 로봇과 지표를 확인하세요! 이 제품은 MQL5 웹사이트에서만 제공되는 오리지널 상품입니다.
Cupid Signal Fx
Damrongwit Kongtong
The principle of this indicator is very simple: detecting the return point with Stochastic Oscillator, then monitoring the trend by using the Moving Average and finally predicting BUY and SELL signal with arrows, alerts and notifications. The parameters are fixed and automatically calculated on each timeframe. Example: If you install indicator on EURUSD, the indicator will detect the return point when the Stochastic Oscillator show "cross up" of the main line/signal line at the below position of
Trend dashboard
Jan Flodin
1 (1)
이 다중 시간 프레임 및 다중 기호 추세 표시기는 강한 추세 또는 추세 반전이 식별되면 경고를 보냅니다. 이동 평균(싱글 또는 더블(MA 크로스오버)), RSI, 볼린저 밴드, ADX, 종합 지수, 포물선 SAR, Awesome(AO), MACD(신호 라인),       스토캐스틱 크로스오버 또는 헐 이동 평균   . M5에서 MN까지 모든 시간 프레임에서 사용할 수 있습니다. 대시보드의 색상은 강세를 나타내는 녹색, 약세를 나타내는 빨간색, 중립을 나타내는 파란색입니다(지표 값이 범위에 없음). 고유한 규칙 및 기술과 결합하여 이 표시기를 사용하면 강력한 시스템을 생성(또는 강화)할 수 있습니다. 특징 표시기는 자동 거래를 위해 Expert Advisor가 사용할 수 있는 글로벌 변수에 신호를 쓸 수 있습니다. 예를 들어   이 제품   . 사용할 시간대를 선택할 수 있습니다. 대시보드 내에서 추세 강도 순위 정렬을 지속적으로 수행합니다. 특정 기호를 더 쉽게 찾을 수 있도록 이
Supply and Demand Indicator + FREE Currency Strength Meter ADD-ON Looking for a powerful tool that can help you identify the most reactive zones in the forex market? Our supply and demand indicator for MetaTrader 4 and 5 is exactly what you need. With its advanced algorithms and real-time analysis, this indicator helps traders of all experience levels make informed trading decisions. The supply and demand indicator is a cutting-edge tool that helps traders identify areas where buyers and seller
이 제품의 구매자들이 또한 구매함
Volatility Trend System - a trading system that gives signals for entries. The volatility system gives linear and point signals in the direction of the trend, as well as signals to exit it, without redrawing and delays. The trend indicator monitors the direction of the medium-term trend, shows the direction and its change. The signal indicator is based on changes in volatility and shows market entries. The indicator is equipped with several types of alerts. Can be applied to various trading ins
Smc Blast Signal
Mohit Dhariwal
5 (3)
Full Fledged EA and Alert plus for alerts will also be provided in this offer along with the purchase of Indicator. Limited copies only at this price and Ea too. Grab your copy soon Alert plus for indicator with set file is kept in comment section with the image  SMC Blast Signal with FVG, BOS and trend Breakout The SMC Blast Signal is a Precise trading system for Meta Trader 4 that uses Smart Money Concepts (SMC), including Fair Value Gaps (FVG) and Break of Structure (BOS), to identify high-pr
Scalper Inside PRO
Alexey Minkov
4.74 (69)
An exclusive indicator that utilizes an innovative algorithm to swiftly and accurately determine the market trend. The indicator automatically calculates opening, closing, and profit levels, providing detailed trading statistics. With these features, you can choose the most appropriate trading instrument for the current market conditions. Additionally, you can easily integrate your own arrow indicators into Scalper Inside Pro to quickly evaluate their statistics and profitability. Scalper Inside
Gold Signal Pro
Mohamed Hassan
First 25 copies at $80, after that price becomes $149 (3 copies left) Gold Signal Pro is a powerful MT4 indicator designed to help traders spot strong price reactions in the market. It focuses on clear wick rejections , showing when price strongly rejects a level and often continues in the same direction. Gold Signal Pro is mainly built for scalping gold (XAUUSD) and works best on lower timeframes like M5 and M15 , where timing matters most. That said, it can also be used on any forex pair, a
Trend Screener
STE S.S.COMPANY
4.79 (95)
트렌드 표시기, 트렌드 트레이딩 및 필터링을 위한 획기적인 고유 솔루션, 하나의 도구 안에 내장된 모든 중요한 트렌드 기능! Forex, 상품, 암호 화폐, 지수 및 주식과 같은 모든 기호/도구에 사용할 수 있는 100% 다시 칠하지 않는 다중 시간 프레임 및 다중 통화 표시기입니다. 기간 한정 특가: 지원 및 저항 스크리너 지표는 단 100달러에 평생 제공됩니다. (원래 가격 50 달러) (제안 연장) Trend Screener는 차트에 점이 있는 화살표 추세 신호를 제공하는 효율적인 지표 추세 추종 지표입니다. 추세 분석기 표시기에서 사용할 수 있는 기능: 1. 트렌드 스캐너. 2. 최대 이익 분석이 있는 추세선. 3. 추세 통화 강도 측정기. 4. 경고가 있는 추세 반전 점. 5. 경고가 있는 강력한 추세 점. 6. 추세 화살표 Trend Screener Indicator가 있는 일일 분석 예, 일일 신호 성능...등은 여기에서 찾을 수 있습니다.   여기를 클릭하십시오. L
Basic Harmonic Patterns Dashboard
Mehran Sepah Mansoor
5 (3)
이 대시보드는 선택한 심볼에 대해 사용 가능한 최신 고조파 패턴을 표시하므로 시간을 절약하고 더 효율적으로 사용할 수 있습니다 / MT5 버전 . 무료 인디케이터: Basic Harmonic Pattern 인디케이터 열 Symbol : 선택한 심볼이 나타납니다 Trend : 강세 또는 약세 Pattern : 패턴 유형(가틀리, 나비, 박쥐, 게, 상어, 사이퍼 또는 ABCD) Entry : 진입 가격 SL: 스톱로스 가격 TP1: 1차 테이크프로핏 가격 TP2: 2차 테이크프로핏 가격 TP3: 3차 테이크프로핏 가격 Current price: 현재 가격 Age (in bars): 마지막으로 그려진 패턴의 나이 주요 입력 Symbols : "28개 주요 통화쌍" 또는 "선택한 심볼" 중에서 선택합니다. Selected Symbols : 쉼표로 구분하여 모니터링하려는 원하는 심볼("EURUSD,GBPUSD,XAUUSD")을 선택합니다. 브로커에 쌍에 접미사 또는 접두사가 있는
RFI levels PRO
Roman Podpora
5 (1)
사전 지표       시장 반전 수준과 영역을 파악하여   가격이 해당 수준으로 되돌아올 때까지 기다렸다가 새로운 추세의 시작점에서 진입할 수 있도록 해줍니다. 즉, 추세의 끝에서 진입하는 것이 아닙니다. 그는 보여준다       반전 수준       시장이 방향 전환을 확인하고 추가적인 움직임을 형성하는 지점입니다. 이 지표는 차트를 다시 그릴 필요 없이 작동하며, 모든 금융 상품에 최적화되어 있고, 특정 금융 상품과 함께 사용할 때 최대의 잠재력을 발휘합니다.       트렌드 라인즈 프로       지시자. 모든 계측기에 적용 가능한 가역 구조 스캐너 모든 거래 상품을 자동으로 추적하고 모든 R-반전 패턴을 즉시 식별하여 LOGIC AI 신호가 이미 존재하는 위치와 기타 유용한 정보를 표시합니다. 로직 AI – 진입점을 표시해주는 도우미 시장 진입에 가장 적합한 시점을 판단하는 지능형 신호입니다. TPSproSYSTEM 알고리즘을 사용하여 가격 변동, 추세 및 주요 시장 참
Dynamic Forex28 Navigator
Bernhard Schweigert
4.43 (7)
Dynamic Forex28 Navigator - 차세대 외환 거래 도구. 현재 49% 할인. Dynamic Forex28 Navigator는 오랫동안 인기 있는 지표의 진화형으로, 세 가지의 힘을 하나로 결합했습니다. 고급 통화 Strength28 지표(695개 리뷰) + 고급 통화 IMPULSE with ALERT(520개 리뷰) + CS28 콤보 신호(보너스). 지표에 대한 자세한 정보 https://www.mql5.com/en/blogs/post/758844 차세대 Strength 지표는 무엇을 제공합니까?  원래 지표에서 좋아했던 모든 것이 새로운 기능과 더 높은 정확도로 강화되었습니다. 주요 기능: 독점적인 통화 Strength 공식.  모든 시간대에 걸쳐 부드럽고 정확한 강도선. 추세와 정확한 진입을 식별하는 데 이상적입니다. 역동적인 시장 피보나치 수준(시장 피보나치).  이 지표에만 있는 고유한 기능. 가격 차트가 아닌 통화 강도에 피보나치가 적용됩니다.
TPSpro RFI Levels
Roman Podpora
4.85 (27)
러시아어 설명서  /  영어   설명서  /  MT5 버전 주요 기능: 판매자와 구매자의 활동 영역을 표시합니다! 이 지표는 매수 및 매도에 대한 모든 올바른 첫 번째 임펄스 레벨/존을 표시합니다. 진입점 검색이 시작되는 이러한 레벨/존이 활성화되면 레벨의 색상이 바뀌고 특정 색상으로 채워집니다. 상황을 더욱 직관적으로 파악할 수 있도록 화살표도 표시됩니다. LOGIC AI - 템플릿 활성화 시 진입점 검색을 위한 영역(원) 표시 시각적 명확성을 개선하기 위해 인공지능을 사용하여 진입점을 검색한 영역을 표시하는 기능이 추가되었습니다. 더 높은 시간대의 레벨/존 표시(MTF 모드) 더 높은 시간 간격을 사용하여 레벨/존을 표시하는 기능이 추가되었습니다. 또한, 이 지표는 자동 추세 감지 기능(   TPSproTREND PRO   )을 구현했습니다. 거래를 위한 별도의 전문적인 단계별 알고리즘 이 알고리즘은 추세 방향과 반대 방향으로의 당일 거래 모두에 적합하도록 설계되었습니다. 각
이 지표를 구매하면 제 프로페셔널 트레이드 매니저를 무료로 드립니다. 우선 이 거래 시스템이 리페인팅, 리드로잉 및 레이그 인디케이터가 아니라는 점을 강조하는 것이 중요합니다. 이는 수동 및 로봇 거래 모두에 이상적인 것으로 만듭니다. 온라인 강좌, 설명서 및 프리셋 다운로드. "스마트 트렌드 트레이딩 시스템 MT5"은 새로운 및 경험이 풍부한 트레이더를 위해 맞춤형으로 제작된 종합적인 거래 솔루션입니다. 10개 이상의 프리미엄 인디케이터를 결합하고 7개 이상의 견고한 거래 전략을 특징으로 하여 다양한 시장 조건에 대한 다목적 선택이 가능합니다. 트렌드 추종 전략: 효과적인 트렌드 추이를 타기 위한 정확한 진입 및 손절 관리를 제공합니다. 반전 전략: 잠재적인 트렌드 반전을 식별하여 트레이더가 범위 시장을 활용할 수 있게 합니다. 스캘핑 전략: 빠르고 정확한 데이 트레이딩 및 단기 거래를 위해 설계되었습니다. 안정성: 모든 인디케이터가 리페인팅, 리드로잉 및 레이그가 아니므로 신뢰
System Trend Pro
Aleksandr Makarov
5 (2)
System Trend Pro - This is the best trend trading indicator!!! The indicator no repaint!!!  The indicator has   MTF   mode, which adds confidence to trading on the trend (   no repaint   ). How to trade? Everything is very simple, we wait for the first signal (big arrow), then wait for the second signal (small arrow) and enter the market in the direction of the arrow. (See screens 1 and 2.) Exit on the opposite signal or take 20-30 pips, close half of it, and keep the rest until the opposite
현재 40% 할인 ! 초보자 또는 전문가 트레이더를 위한 최고의 솔루션! 이 대시보드 소프트웨어는 28개의 통화 쌍에서 작동합니다. 2가지 주요 지표(Advanced Currency Strength 28 및 Advanced Currency Impulse)를 기반으로 합니다. 전체 Forex 시장에 대한 훌륭한 개요를 제공합니다. 고급 통화 강도 값, 통화 이동 속도 및 모든(9) 시간대의 28 Forex 쌍에 대한 신호를 보여줍니다. 추세 및/또는 스캘핑 기회를 정확히 파악하기 위해 차트의 단일 지표를 사용하여 전체 시장을 볼 수 있을 때 거래가 어떻게 개선될지 상상해 보십시오! 잠재적인 거래를 식별하고 확인하면서 강력한 통화와 약한 통화를 더욱 쉽게 식별할 수 있도록 이 지표에 기능을 내장했습니다. 이 표시기는 통화의 강세 또는 약세가 증가 또는 감소하는지 여부와 모든 시간대에서 수행되는 방식을 그래픽으로 보여줍니다. 추가된 새로운 기능은 현재 시장 조건 변화에 적응하는
Advanced Currency IMPULSE with ALERT
Bernhard Schweigert
4.91 (489)
현재 40% 할인!! 초보자 또는 전문가 트레이더를 위한 최고의 솔루션! 이 지표는 우리가 독점 기능과 비밀 공식을 통합했기 때문에 독특하고 고품질이며 저렴한 거래 도구입니다. 단 하나의 차트로 28개 통화 쌍 모두에 대한 경고를 제공합니다. 새로운 추세 또는 스캘핑 기회의 정확한 트리거 포인트를 정확히 찾아낼 수 있기 때문에 거래가 어떻게 개선될지 상상해 보십시오! 새로운 기본 알고리즘을 기반으로 구축되어 잠재적인 거래를 훨씬 더 쉽게 식별하고 확인할 수 있습니다. 이는 통화의 강세 또는 약세가 가속되는지 여부를 그래픽으로 표시하고 가속 속도를 측정하기 때문입니다. 자동차의 속도계처럼 생각하면 됩니다. 가속화할 때 Forex 시장에서 동일한 일이 분명히 더 빠르게 발생합니다. 즉, 반대 방향으로 가속화되는 통화를 페어링하면 잠재적으로 수익성 있는 거래를 식별한 것입니다. 통화 모멘텀의 수직선과 화살표가 거래를 안내합니다! 역동적인 Market Fibonacci 23 레벨은
Pulse Scalping Line - an indicator for identifying potential pivot points. Based on this indicator, you can build an effective Martingale system. According to our statistics, the indicator gives a maximum of 4 erroneous pivot points in a series. On average, these are 2 pivot points. That is, the indicator shows a reversal, it is erroneous. This means that the second signal of the indicator will be highly accurate. Based on this information, you can build a trading system based on the Martingale
MetaForecast M4
Vahidreza Heidar Gholami
5 (2)
MetaForecast는 가격 데이터의 조화를 기반으로 모든 시장의 미래를 예측하고 시각화합니다. 시장이 항상 예측 가능한 것은 아니지만 가격에 패턴이 있다면 MetaForecast는 가능한 정확하게 미래를 예측할 수 있습니다. 다른 유사한 제품과 비교했을 때, MetaForecast는 시장 동향을 분석하여 더 정확한 결과를 생성할 수 있습니다. 입력 매개변수 Past size (과거 크기) MetaForecast가 미래 예측을 생성하기 위한 모델을 만드는 데 사용하는 막대의 수를 지정합니다. 모델은 선택한 막대 위에 그려진 노란색 선으로 표시됩니다. Future size (미래 크기) 예측해야 할 미래 막대의 수를 지정합니다. 예측된 미래는 핑크색 선으로 표시되며 그 위에 파란색 회귀선이 그려집니다. Degree (차수) 이 입력은 MetaForecast가 시장에서 수행할 분석 수준을 결정합니다. Degree 설명  0 차수 0의 경우, "Past size" 입력에 모든 봉우리와
FX Power MT4 NG
Daniel Stein
4.95 (21)
FX Power: 통화 강세 분석으로 더 스마트한 거래 결정을 개요 FX Power 는 어떤 시장 상황에서도 주요 통화와 금의 실제 강세를 이해하기 위한 필수 도구입니다. 강한 통화를 매수하고 약한 통화를 매도함으로써 FX Power 는 거래 결정을 단순화하고 높은 확률의 기회를 발견합니다. 트렌드를 따르거나 극단적인 델타 값을 사용해 반전을 예측하고자 한다면, 이 도구는 귀하의 거래 스타일에 완벽히 적응합니다. 단순히 거래하지 말고, FX Power 로 더 스마트하게 거래하세요. 1. FX Power가 거래자에게 매우 유용한 이유 통화와 금의 실시간 강세 분석 • FX Power 는 주요 통화와 금의 상대적 강세를 계산하고 표시하여 시장 역학에 대한 명확한 통찰력을 제공합니다. • 어떤 자산이 앞서고 있고 어떤 자산이 뒤처지는지 모니터링하여 보다 현명한 거래 결정을 내릴 수 있습니다. 포괄적인 멀티 타임프레임 뷰 • 단기, 중기 및 장기 타임프레임에서 통화와 금의 강세를
Shogun Trade
Yuki Miyake
5 (2)
SHOGUN Trade - The Shocking Truth of 16 Years Unoptimized. Shogun Trading February Special Sale – Only $99 (Regular Price $199)! This special offer is available until February 28th . As we are dedicated to further product development and optimization , we are offering this discount in exchange for your valuable feedback. Your insights will directly influence our next round of updates and feature enhancements. Price: $99 (Special discount from $199) Requirement: Please leave a review and share
Advanced Currency Strength28 Indicator
Bernhard Schweigert
4.91 (657)
현재 40% 할인 초보자 또는 전문가 트레이더를 위한 최고의 솔루션! 이 지표는 우리가 독점 기능과 새로운 공식을 통합했기 때문에 독특하고 고품질이며 저렴한 거래 도구입니다. 단 하나의 차트로 28 Forex 쌍의 통화 강도를 읽을 수 있습니다! 새로운 추세 또는 스캘핑 기회의 정확한 트리거 포인트를 정확히 찾아낼 수 있기 때문에 거래가 어떻게 개선될지 상상해 보십시오. 사용 설명서: 여기를 클릭  https://www.mql5.com/en/blogs/post/697384 그것이 첫 번째, 원본입니다! 쓸모없는 지망생 클론을 사지 마십시오. 더 스페셜  강력한 통화 모멘텀을 보여주는 하위 창의 화살표 GAP가 거래를 안내합니다! 기본 또는 호가 통화가 과매도/과매도 영역(외부 시장 피보나치 수준)에 있을 때 개별 차트의 기본 창에 경고 표시가 나타납니다. 통화 강도가 외부 범위에서 떨어질 때 풀백/반전 경고. 교차 패턴의 특별 경고 추세를 빠르게 볼 수 있는 다중 시간
Trend Arrow Super
Aleksandr Makarov
5 (2)
Trend Arrow Super The indicator not repaint or change its data. A professional, yet very easy to use Forex system. The indicator gives accurate BUY\SELL signals. Trend Arrow Super is very easy to use, you just need to attach it to the chart and follow simple trading recommendations. Buy signal: Arrow + Histogram in green color, enter immediately on the market to buy. Sell signal: Arrow + Histogram of red color, enter immediately on the market to sell.
Cyclic Impulse
Vitalyi Belyh
차트를 구조화하고 주기적인 가격 변동을 식별하는 기술 지표입니다. 모든 차트에서 작업할 수 있습니다. 다양한 유형의 알림. 그래프 자체에도 추가 화살표가 있습니다. 역사를 재구성하지 않고, 촛불을 닫는 작업에 임한다. M5 이상에서 권장되는 TF입니다. 사용 및 구성이 쉬운 매개변수입니다. 매개변수가 다른 2개의 지표를 사용하는 경우, 다른 지표 없이 해당 지표만 사용할 수 있습니다. 2개의 입력 매개변수가 있습니다 주기성과 신호 지속 시간 이 2개의 매개변수는 차트 구조의 처리와 관련이 있습니다. Cyclicity - 역전 주기가 얼마나 자주 바뀌는지 조절하고 주기를 매끄럽게 합니다. Signal duration - 최소 숫자에서는 가격 움직임의 충격을 감지하고, 최대 숫자에서는 장기적 추세 움직임을 감지합니다.. --------------------------------
Binary FX Ideal
Yaroslav Varankin
5 (1)
great tool for any trader for both Forex and binary options suitable for any trader no need to configure anything, everything has been perfected by time and experience The tool combines 5 indicators and 3 proprietary strategies works great during flats and trends It indicates a trend reversal at its very beginning, it works well with the trend Trading Recommendations The signal is formulated on the current candle You should enter the trade at the next Possible recount (rare)
Wave Anatomy
Trade The Volume Waves Single Member P.C.
5 (1)
Wave Anatomy Visit:   http://www.tradethevolumewaves.com   for more information Construct your own 5 Waves and analyze the price movements stages: Easy Movement Hard time to move Fast move This indicator is based on Wyckoff’s, David’s Weis and my Speed Index Theory. This indicator will you help analyze what is happening in 5 Price Waves that you can construct yourself. This tool is designed for scalpers and swing traders and will help them to analyze any wave on any timeframe at the same time.
True SnD
Indra Lukmana
5 (1)
This Supply & Demand indicator uses a unique price action detection to calculate and measures the supply & demand area. The indicator will ensure the area are fresh and have a significant low risk zone. Our Supply Demand indicator delivers functionality previously unavailable on any trading platform. Trading idea You may set pending orders along the supply & demand area. You may enter a trade directly upon price hit the specific area (after a rejection confirmed). Input parameters Signal - Set
Meravith
Ivan Stefanov
5 (1)
이 인디케이터는 각 지점에서 볼륨을 분석하고 해당 볼륨에 대한 시장의 피로 레벨을 계산합니다. 이 인디케이터는 세 개의 라인으로 구성됩니다: 강세 볼륨 피로 라인 약세 볼륨 피로 라인 시장 추세를 나타내는 라인. 이 라인은 시장이 강세인지 약세인지에 따라 색이 변합니다. 원하는 시작 지점에서 시장을 분석할 수 있습니다. 볼륨 피로 라인에 도달하면 다음 분석을 시작할 새 지점을 식별하세요. 트렌드와 수정 모두 분석할 수 있습니다. 좋은 접근 방법은 트렌드 라인에 도달하거나 고점 또는 저점에 도달할 때마다 인디케이터를 이동시키는 것입니다. 트렌드 라인과 볼륨 피로 라인 간의 거리가 클수록 해당 방향의 볼륨이 더 큽니다. 트렌드 라인은 주문을 열기 위한 장소로 사용할 수 있으며, 피로 라인은 수익을 얻는 데 사용됩니다. 이 시스템은 정말 독특하지만 매우 직관적입니다. 시장에는 비슷한 제품이 없습니다. 사용에 제한이 없습니다. 모든 시장과 모든 시간 프레임에서 적용할 수 있습니다. 중요:
Volatility Master
INTRAQUOTES
5 (5)
Volatility Master for MetaTrader is a real-time dashboard tool that scans up to 56 symbols using up to 2 flexible dashboards on different charts to identify high-volatility, trending markets instantly. With clear bullish/bearish signals, customizable alerts, and a user-friendly interface, it helps you avoid range-bound conditions and focus on high-probability trades. Clarity leads to confidence. Trade confidently and protect your capital effectively with this powerful dashboard. Setup & Guide: 
Beast Super Signal
Dustin Vlok
4.73 (89)
수익성 있는 거래 기회를 쉽게 식별하는 데 도움이 되는 강력한 외환 거래 지표를 찾고 계십니까? Beast Super Signal보다 더 이상 보지 마십시오. 사용하기 쉬운 이 추세 기반 지표는 시장 상황을 지속적으로 모니터링하여 새로운 개발 추세를 찾거나 기존 추세에 뛰어들 수 있습니다. Beast Super Signal은 모든 내부 전략이 정렬되고 서로 100% 합류할 때 매수 또는 매도 신호를 제공하므로 추가 확인이 필요하지 않습니다. 신호 화살표 알림을 받으면 구매 또는 판매하기만 하면 됩니다. 구매 후 비공개 VIP 그룹에 추가되도록 저에게 메시지를 보내주세요! (전체 제품 구매만 해당). 최신 최적화된 세트 파일을 구입한 후 저에게 메시지를 보내주세요. MT5 버전은   여기에서 사용할 수 있습니다. 여기에서   Beast Super Signal EA를 받으세요. 최신 결과를 보려면 댓글 섹션을 확인하세요! Beast Super Signal은 1:1, 1:2
Atomic Analyst
Issam Kassas
5 (3)
우선적으로 언급할 점은이 거래 지표가 다시 그리지 않고 지연되지 않으며 이를 통해 수동 및 로봇 거래 모두에 이상적이라는 점입니다. 사용자 매뉴얼: 설정, 입력 및 전략. Atomic Analyst는 가격의 강도와 모멘텀을 활용하여 시장에서 더 나은 이점을 찾는 PA Price Action Indicator입니다. 고급 필터를 장착하여 잡음과 거짓 신호를 제거하고 거래 잠재력을 높이는 데 도움이 됩니다. 복잡한 지표의 다중 레이어를 사용하여 Atomic Analyst는 차트를 스캔하고 복잡한 수학적 계산을 간단한 신호와 색상으로 변환하여 초보 트레이더가 이해하고 일관된 거래 결정을 내릴 수 있도록합니다. "Atomic Analyst"는 새로운 및 경험이 풍부한 트레이더를위한 종합적인 거래 솔루션입니다. 프리미엄 지표와 최고 수준의 기능을 하나의 거래 전략에 결합하여 모든 종류의 트레이더에 대한 다재다능한 선택지가되었습니다. 인트라데이 거래 및 스캘핑 전략 : 빠르고 정확한 일일
GOLD Impulse with Alert
Bernhard Schweigert
4.64 (11)
이 지표는 Advanced Currency IMPULSE with ALERT  +   Currency Strength Exotics  의 2가지 제품의 슈퍼 조합입니다. 그것은 모든 시간 프레임에 대해 작동하며 8개의 주요 통화와 하나의 기호에 대한 강약의 충동을 그래픽으로 보여줍니다! 이 표시기는 금, 이국적인 쌍, 상품, 지수 또는 선물과 같은 기호에 대한 통화 강도 가속을 표시하는 데 특화되어 있습니다. 금, 은, 오일, DAX, US30, MXN, TRY, CNH 등의 진정한 통화 강도 가속(충동 또는 속도)을 표시하기 위해 9번째 줄에 모든 기호를 추가할 수 있습니다. 새로운 기본 알고리즘을 기반으로 구축되어 잠재적인 거래를 훨씬 더 쉽게 식별하고 확인할 수 있습니다. 이는 통화의 강세 또는 약세가 가속되는지 여부를 그래픽으로 표시하고 가속 속도를 측정하기 때문입니다. 자동차의 속도계처럼 생각하면 됩니다. 가속화할 때 Forex 시장에서 동일한 일이 분명히 더 빠르
Quantum Entry PRO
Aleksandr Makarov
Quantum Entry is a powerful price action trading system built on one of the most popular and widely known strategies among traders: the Breakout Strategy! This indicator produces crystal clear buy and sell signals based on breakouts of key support and resistance zones. Unlike typical breakout indicators, it uses advanced calculations to accurately confirm the breakout! When a breakout occurs, you receive instant alerts. No lag and no repaint :  All signals are delivered in real-time, with no lag
Katana Scalper Pro
Yuki Miyake
4 (4)
KATANA Scalper for MT4 Product Overview Click here for the simple version: https://www.mql5.com/en/market/product/161751 KATANA Scalper for MT4 is an advanced technical analysis indicator optimized for the MetaTrader 4 platform. It is designed to solve the two biggest challenges in short-term trading (scalping and day trading): "price noise" and "reaction lag." Using a unique signal processing algorithm, it eliminates superficial market fluctuations and extracts the "core momentum" with high
제작자의 제품 더 보기
거래량 분해 지수 (VDI) VDI 는 거래량을 매수와 매도로 분해하여 가격 움직임의 강도와 방향을 식별하기 위해 개발된 독자적인 거래량 분석 지표입니다. 이 지표는 캔들스틱의 가격 데이터를 거래량에 투영하여 매수와 매도의 비율을 시각화합니다. 이를 통해 트레이더는 시장 활동에 대해 더 포괄적으로 이해할 수 있으며, 매수와 매도에 의한 거래량이 각각 얼마인지 파악할 수 있습니다. 계산은 거래소에서 제공하는 모든 가능한 데이터를 기반으로 수행되어, 분석적 완성도가 높고 시장 추세를 깊이 있게 평가할 수 있습니다. 거래량에 대한 지식은 시장 가격 움직임을 이해하는 데 있어 핵심 요소입니다. 이 지표는 바로 그 정보를 제공합니다. 주요 특징 조정 가능한 단일 매개변수 — period (기본값 = 18), 몇 개의 봉을 기준으로 매수 및 매도 거래량을 계산할지 설정합니다. 주요 계산 공식: 매수 거래량 / 매도 거래량 선택한 구간 내에서 매수와 매도 중 어느 쪽이 우세한지 평가할 수 있
FREE
Vdi Algo
Andrei Muzov
VDI Algo — Volume Decomposition Index (VDI) 지표 기반의 지능형 트레이딩 로봇 VDI Algo는 거래량 분석을 기반으로 한 트레이딩 로봇입니다. 코드 내에는 고유한 지표인 Volume Decomposition Index (VDI)가 내장되어 있으며, 매수자와 매도자의 거래량 비율을 계산하여 가격의 강도와 움직임을 판단합니다. 정확도를 높이기 위해 이 지표의 신호는 지수이동평균(EMA)을 통해 필터링되며, 이를 통해 잘못된 신호를 제거하고 안정적인 추세 방향으로 거래할 수 있습니다. VDI Algo는 사용자의 선호도에 맞게 유연하고 신뢰성 높은 트레이딩 전략을 설정할 수 있도록 해줍니다. 이 로봇은 “내일 백만장자”를 약속하지 않으며, 월 5%에서 15%의 안정적이고 현실적인 수익 을 목표로 하는 몇 안 되는 로봇 중 하나입니다. 이 전략의 핵심은 자산 가격의 움직임을 예측하려는 것이 아니라, 매수자와 매도자의 힘을 관찰하는 데 있습니다. 한쪽이 우
필터:
리뷰 없음
리뷰 답변