MOM Standard and Hidden Divergences
- Indicadores
- Versión: 1.2
- Actualizado: 27 noviembre 2018
- Activaciones: 5

El indicador Momentum Standard/Hidden Divergence trazará el momentum, y también identificará y trazará divergencias estándar (regulares) entre el indicador y la acción del precio, O puede configurarse para identificar y trazar divergencias ocultas (inversas) entre el indicador y la acción del precio. Las divergencias mismas se implementan como líneas (verde por defecto para divergencia alcista y roja para divergencia bajista) dibujadas en el panel del indicador. Si se activa a través del cuadro de diálogo Entradas, se generarán alertas cada vez que se identifique una nueva divergencia o cuando se amplíe una divergencia existente.
También se ofrece una opción para resaltar las divergencias en el panel de precios. Cuando se selecciona esta opción, se dibujarán formas sobre los máximos de las barras que identifican el punto de inicio/final de una divergencia superior (bajista), y viceversa para las divergencias inferiores (alcistas). Puede seleccionar resaltar todas las divergencias, o sólo la divergencia más reciente.
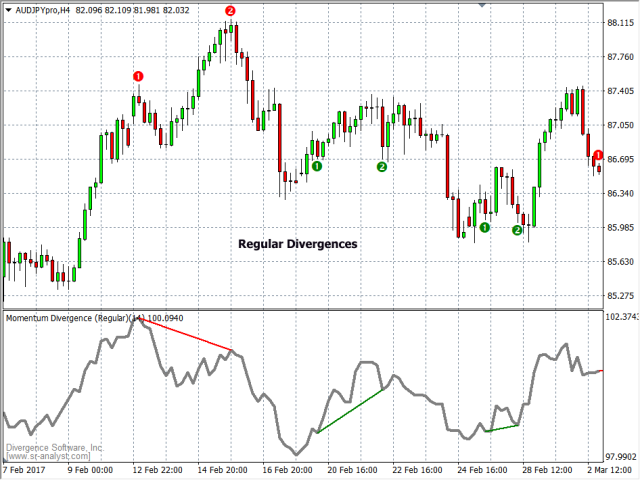
Una divergencia suele ser precursora de un cambio de tendencia. En una divergencia alcista (regular), el precio hará mínimos más bajos mientras que el indicador que se está siguiendo hará mínimos más altos, lo que normalmente indica una reducción (o inversión) del impulso. Lo contrario es cierto para una divergencia bajista (regular).
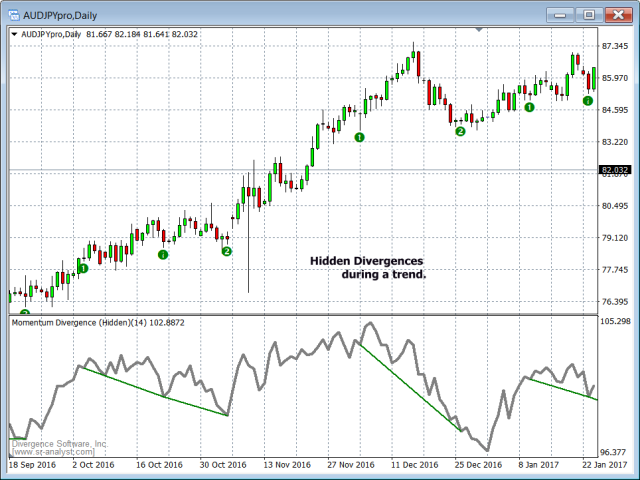
Cuando un valor se encuentra en una tendencia fuerte, la divergencia regular tenderá a generar una serie de señales falsas. En esta situación, las divergencias ocultas pueden utilizarse para identificar puntos de entrada/reentrada. Una divergencia alcista (oculta) se produce cuando el precio hace un mínimo más alto mientras que el indicador hace un mínimo más bajo. Lo contrario ocurre con una divergencia bajista (oculta).
Aunque las divergencias pueden utilizarse para generar señales de entrada, la mayoría de los operadores las utilizan para confirmar alguna otra señal de negociación. Y como se ha mencionado anteriormente, si el valor está en tendencia, usted buscará divergencias ocultas, mientras que en el resto de los momentos se centrará en las divergencias regulares.
Casi cualquier oscilador puede utilizarse para detectar divergencias, pero hay ciertos indicadores que son más eficaces en esta tarea, como el CCI, el RSI, el Momentum, el Estocástico y el MACD. Ofrecemos versiones de todos ellos para la comprobación de divergencias.
El menú Entradas proporciona un control total sobre los parámetros del indicador subyacente, así como todas las propiedades y cosméticos específicos de la divergencia.
| Menú Opción | Descripción |
|---|---|
| Periodo del Momento | Establece el periodo para el cálculo del Momentum. Por defecto es 14. |
| Fuente | Seleccione la fuente de entrada del precio. Por defecto es Cerrar |
| Pivote Lookback | Establece el número de pivotes sobre los que se escanearán las divergencias. Por defecto es 5, rango 1-50. |
| Longitud Mínima | Establece la longitud mínima, en barras, para una divergencia válida. Por defecto es 6. |
| Tipo de Divergencia | Seleccione entre Divergencia Regular y Divergencia Oculta. |
| Color Divergencia Alcista | Definir el color de las líneas de divergencia alcista. |
| Color divergencia bajista | Defina el color de las líneas de divergencia bajista. |
| --Grosor de línea | Establece el grosor de las líneas de divergencia. El rango es de 1 a 6. El valor por defecto es 2. |
| --Estilo de Línea | Establece el estilo de línea para las líneas de divergencia. Por defecto es Sólido. |
| ¿Resaltar Divergencia en el Gráfico? | Verdadero o Falso. Si es Verdadero, los puntos de inicio/final de las divergencias se resaltarán en el panel de precios. |
| -¿Sólo las más recientes? | Verdadero o Falso. Si es Verdadero, sólo se resaltará la divergencia más reciente en el panel de precios. |
| --Tamaño de la forma | Establece el tamaño de la forma que se utilizará para resaltar las divergencias. |
| --Color de la Forma | Establece el color que se utilizará para resaltar las divergencias alcistas. |
| --Color de la forma bajista | Establecer el color que se utilizará para resaltar las divergencias bajistas. |
| ¿Alerta en Divergencia Alcista? | Verdadero o Falso. Si es Verdadero, se generarán alertas para las divergencias alcistas. |
| ¿Alerta de Divergencia Bajista? | Verdadero o Falso. Si es Verdadero, se generarán alertas para las divergencias bajistas. |
| --¿Enviar Alertas por Email? | Verdadero o Falso. Si es Verdadero, se generarán alertas por correo electrónico junto con la alerta de audio estándar. |
| --Sonido de Alerta Bajista | Establece el archivo WAV que se utilizará para las alertas alcistas. |
| --Sonido de alerta bajista | Establece el archivo WAV que se utilizará para las alertas bajistas. |