Pearson Indicator Correlator
- Indikatoren
-
Andrei Muzov
 Разработал алгоритм для расчета объема покупок и продаж актива. Volume Decomposition Index (VDI).
 - Version: 1.0
- Aktivierungen: 5
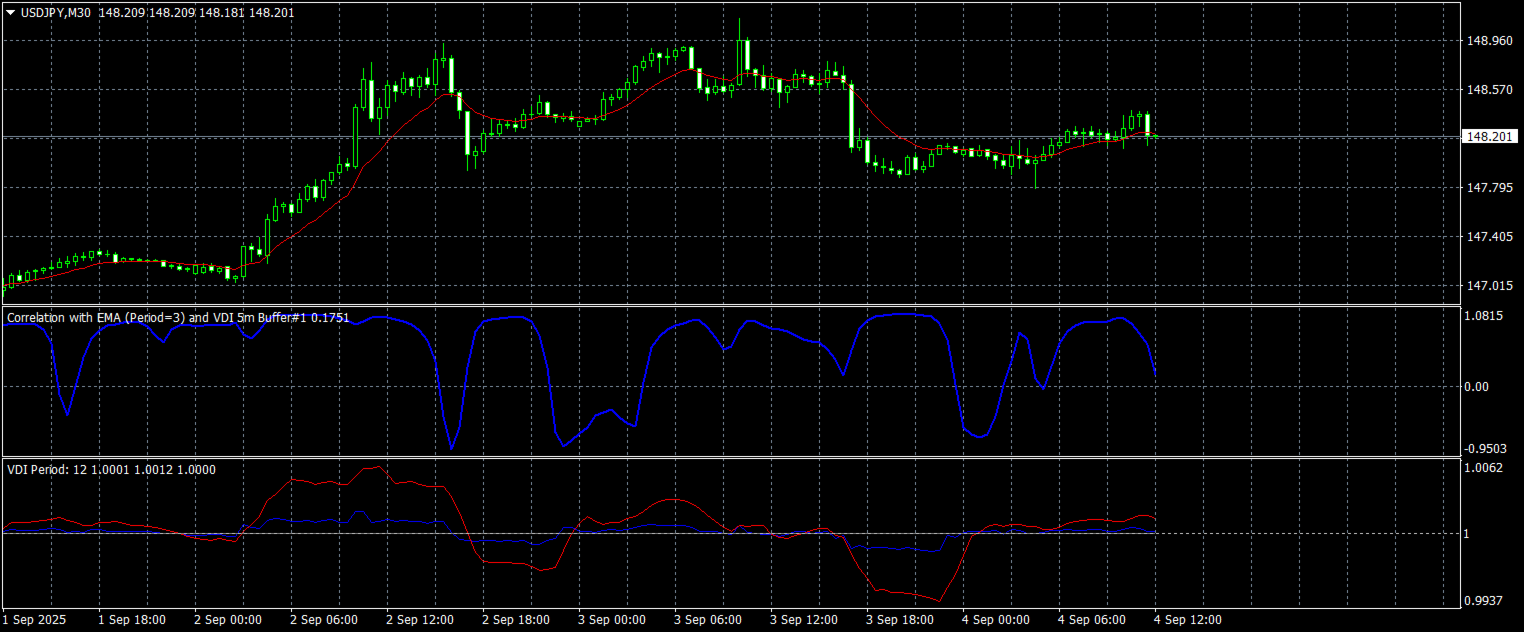
Pearson Indicator Correlator ist ein benutzerdefinierter statistischer Indikator, der den Pearson-Korrelationskoeffizienten zwischen dem exponentiellen gleitenden Durchschnitt (EMA) und einem von Ihnen ausgewählten Indikator – standardmäßig oder benutzerdefiniert – berechnet.
Der Indikator hilft, falsche Signale zu filtern, die Übereinstimmung der Bewegung zu erkennen sowie Divergenzen zwischen dem Trend und den Signallinien aufzudecken.
Verwendung für:
-
Filtern von Signalen anderer Indikatoren,
-
Analyse der Übereinstimmung von Bewegungen,
-
Erkennen von Divergenzen zwischen Trend und Signallinien.
Er zeigt einen Wert von -1 bis +1 an und visualisiert den Synchronisationsgrad. Kann mit beliebigen benutzerdefinierten oder Standardindikatoren verwendet werden.
Anleitung:
-
Geben Sie im Parameterfeld den Namen des Indikators ein, mit dem der Korrelationskoeffizient berechnet werden soll.
-
Geben Sie unbedingt den Puffer an, in dem sich der für die Berechnung benötigte Wert befindet. Beispiel: Für die Korrelation mit dem Histogramm des MACD-Indikators muss Puffer 0 angegeben werden, für die Signallinien Puffer 1.
-
Wählen Sie die Parameter (Periode) des Indikator-Puffers, mit dem die Korrelation berechnet werden soll.
-
Wählen Sie die Periode der EMA und die Periode für die Berechnung des Korrelationskoeffizienten aus.
Wichtig: Wird ein falscher Puffer ausgewählt, wird das Diagramm zwar angezeigt, die Werte sind jedoch inkorrekt und spiegeln die tatsächliche Korrelation nicht wider.