Average Directional Index MT5 TF by your choice
- Indicadores
- Versión: 3.9
- Actualizado: 18 noviembre 2021
- Activaciones: 5

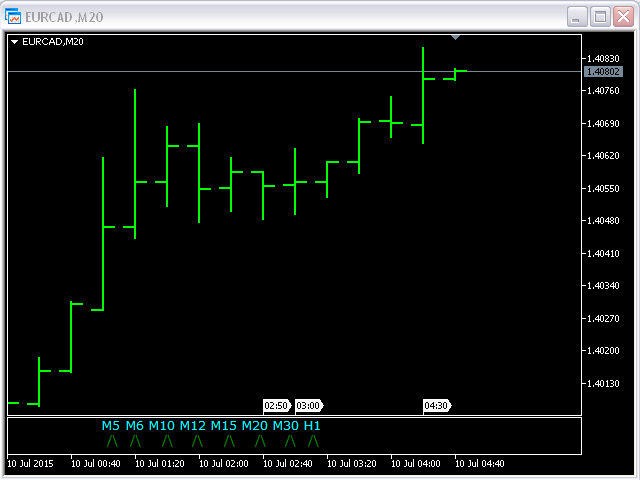
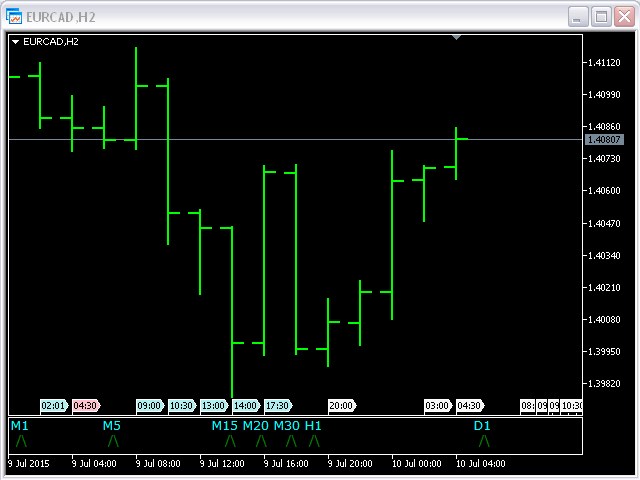
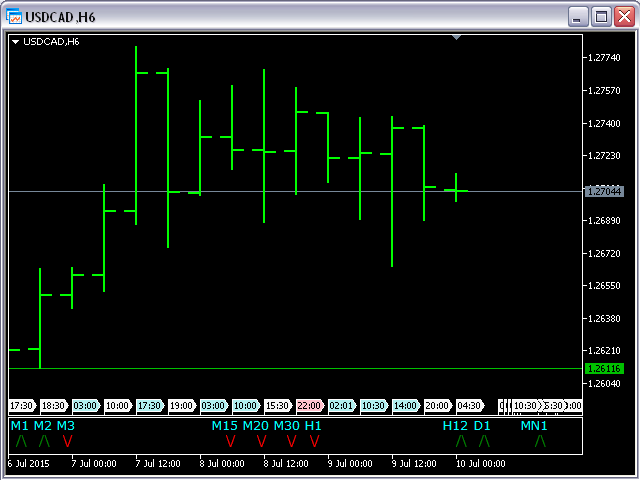
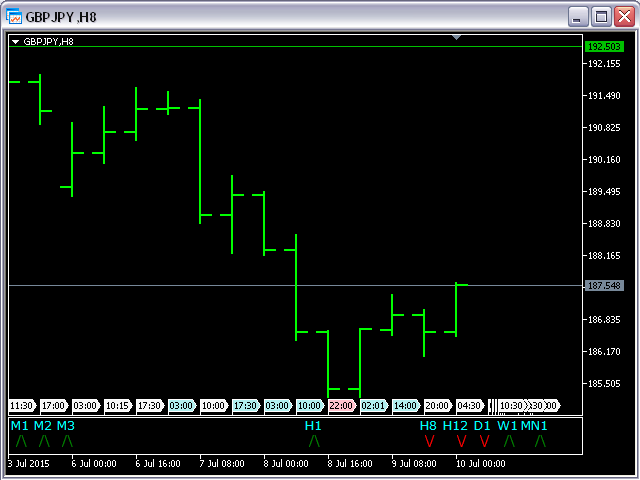
Este indicador se basa en el clásico indicador Average Directional Index (ADX) y será útil para aquellos que aman y saben cómo utilizar no una representación visual, sino digital del indicador. El indicador ADX MT5 muestra los valores de cada marco de tiempo:
- M1, M2, M3, M4, M5, M6, M10, M12, M15, M20, M30, H1, H2, H3, H4, H6, H8, H12, D1, W1, Y MN1.
Podrá cambiar los principales parámetros de entrada de cada ADX para cada TF y podrá elegir qué TF desea ver.
Ejemplo para M1
- TF_M1 = true;
- adxPeriod1 = 14;
Parámetro de entrada:
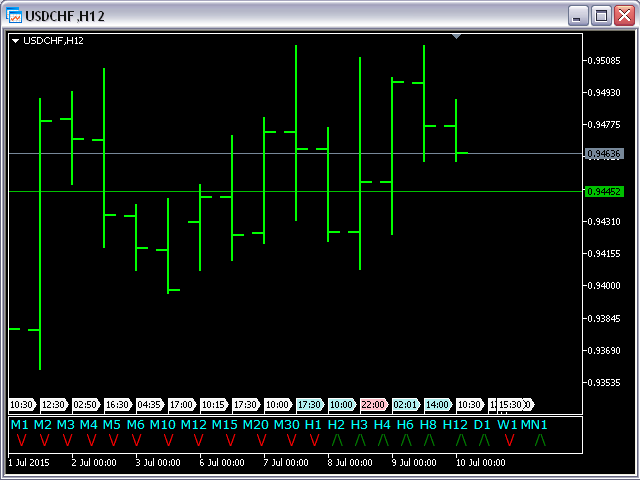
- aColor = clrAqua; - Color para las etiquetas de los TFs;
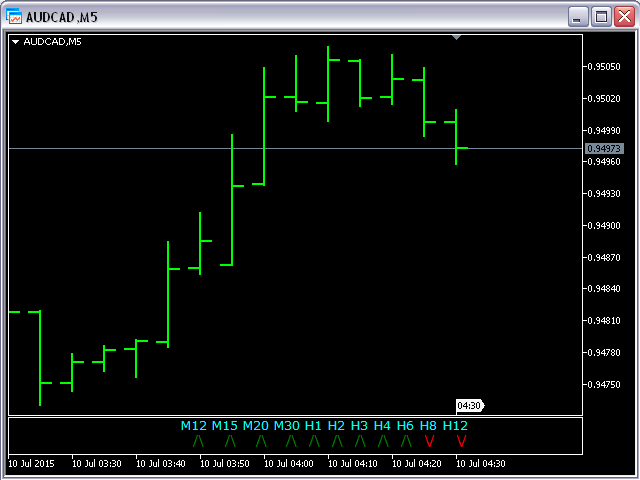
- gColor = clrGreen; - Color para "/\";
- rColor = clrRed; - Color para "\/";
- wColor = clrWhite; - Color para "=" ( cuando Indicador DireccionalMás (+DI) = Indicador Direccional Menos (-DI) ).
Nota
- Cuando se cambia el par de divisas para el gráfico abierto hay que esperar un par de segundos (Next Tick) para el recálculo.
- Antes de usar este indicador tiene que abrir todos los gráficos (todos los TFs) para los pares de divisas actuales.