HighsAndLowsPro
- Indicadores
- Versión: 1.0
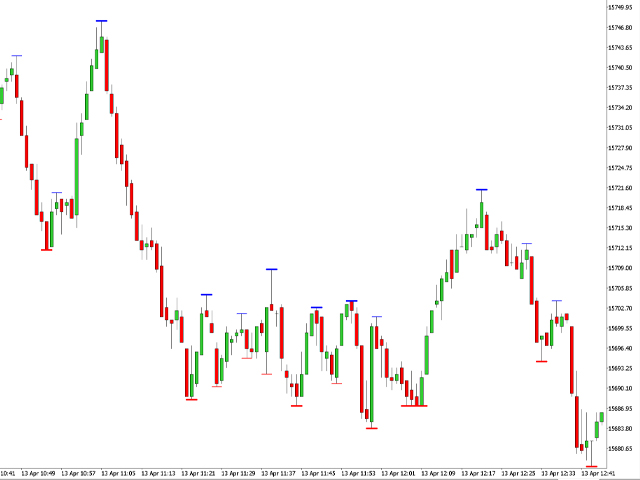
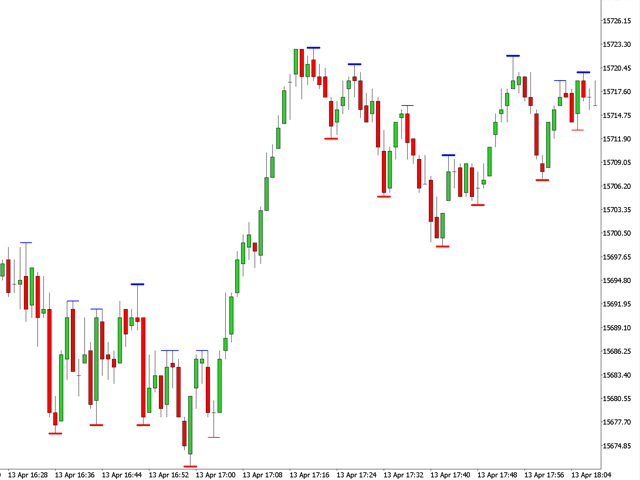
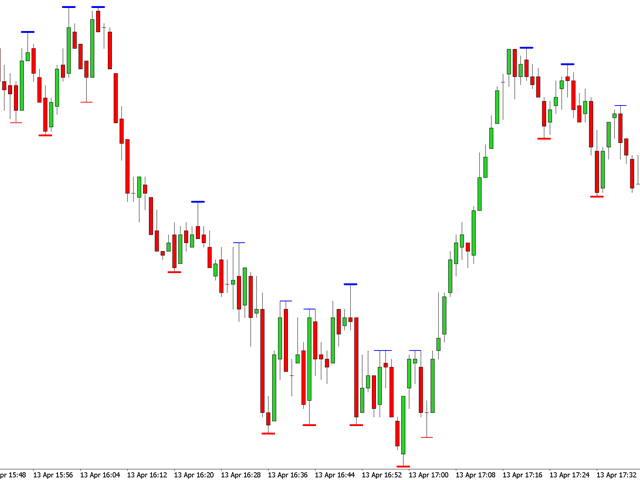
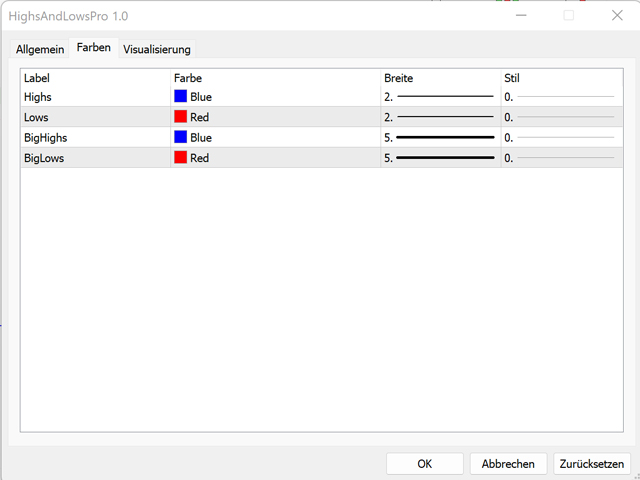
El indicador HighsAndLowsPro para MetaTrader 5 marca máximos y mínimos locales en el gráfico. Distingue entre máximos y mínimos débiles y fuertes. El grosor de las líneas y los colores se pueden ajustar individualmente. Por defecto, los máximos y mínimos débiles se muestran más finos y los fuertes más gruesos. Los máximos y mínimos débiles tienen 3 velas delante y detrás, cuyos máximos son más bajos y cuyos mínimos son más altos. Los máximos y mínimos fuertes tienen 5 velas cada uno.