Смотри обучающее видео по маркету на YouTube
Как купить торгового робота или индикатор
Запусти робота на
виртуальном хостинге
виртуальном хостинге
Протестируй индикатор/робота перед покупкой
Хочешь зарабатывать в Маркете?
Как подать продукт, чтобы его покупали
Технические индикаторы для MetaTrader 4 - 28

+ 2 бонусные стратегии! + Алерты! Рекомендую посмотреть моего советника - Night Zen EA Индикатор объединил в себе наиболее популярные стратегии по скользящим средним: Простое пересечение скользящих средних. Пересечении скользящих средних относительно положения более медленной скользящей средней. 2 бонусные стратегии: Пересечение быстрой скользящей средней с расчетом цен открытия медленной скользящей средней с расчетом цен закрытия с учетом более медленной скользящей средней. (Настройки данной
FREE

Индикатор Канал Кельтнера представляет собой канал идущий вдоль скользящей средней , ширина которого задается путем вычисления среднего истинного диапазона на периоде скользящей средней. Этот индикатор можно применять для получения сигналов, а также в качестве замены индикатору Конверт скользящей средней , перед которым имеет преимущество в качестве авто подбора ширины канала, который можно подкорректировать параметром Size of channel in percent .
Параметры индикатора Period of indicator - Пери
FREE
** All Symbols x All Time frames scan just by pressing scanner button ** *** Contact me to send you instructions and add you in "Triple MA scanner group" for sharing or seeing experiences with other users. Introduction: The triple moving average strategy involves planning three different moving averages to generate buy and sell signals. The third moving average is used in combination with the other two moving averages to confirm or deny the signals they generate. This reduces the probability t
FREE

Индикатор уровней на основе индикатора Zig-Zag - это высокоточный инструмент для торговли на Forex, который поможет вам улучшить вашу стратегию и принимать более точные решения. Он использует алгоритм Zig-Zag для определения различных уровней поддержки и сопротивления на рынке, исходя из чего можно определить, когда лучше всего войти или выйти из сделки. Этот индикатор обладает высокой производительностью и точностью в расчете уровней, что позволяет трейдерам получать максимальную прибыль при ми
FREE

Macd Predictor Macd's main chart indicator If you like this indicator , Dinapoli Levels Expansion and Retracement Demo is a helpful tool: https://www.mql5.com/en/market/product/35884
1. You can determine the price at which the MACD will change from buy to sell, and vice versa. It is the cousin of the oscillator predictor. If you know a position at the time, then the exact price, current and next (future) columns will need to reach the MACD crossover. You can also see how far the market has to
FREE

This indicator helps you to scan symbols which are in the Market Watch window and filter out a trend according to RSI.
The relative strength index (RSI) is a technical indicator used in the analysis of financial markets. It is intended to chart the current and historical strength or weakness of a stock or market based on the closing prices of a recent trading period. The indicator should not be confused with relative strength. The RSI is classified as a momentum oscillator, measuring the veloci
FREE
Is Zero Lag profitable? Not always, different system is for different pairs. You can play around with this indicator from Mladen, I have modified it with Bollinger Bands over T3.
You can change the period and how it calculate. MT5 version is available too.... Please leave a review , it helps us and we will share more indicators. .... Thank you and happy trading
FREE

The Sentiment Ratio indicator gauges current Market Sentiment between -100% and 100%, where lower than -40% is considered Bearish and higher than 40% is Bullish. The channel between the two is considered Neutral. The indicator has been a very useful filter tool for signals within a trading system.
Example call function: int SentimentIndicator(double triggerLevel)//Return sentiment if trigger level is activated { double sentimentRatio=iCustom(NULL,0,"Sentiment Ratio",0,0,0); if(sentimentRat
FREE
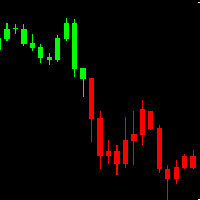
AH Candles MT4 AH Candles MT4 is a new product that allows identifying the current market phase (uptrend and downtrend ).
This indicator paints bars in different colors depending on the current state of the market trend ( Green and Red )
AH Candles MT4 is use for trading currencies
Advantages Suitable for intraday and swing trading. The indicator base on EMA method to calculate Period Parameters It can be used as a standalone tool or together with other indicators.
How to use the prod
FREE

Indicator ini berdasarkan Gain ADX - Follow Trend - Disertai Pivot, Support & Resistant Daily
Dengan indicator ini semoga menjadikan indicator yang porofit able, selama mengikuti signal yang tampil, apabila berwarna Hijau siap2 untuk Buy, dan berwarna Merah siap2 untuk Sell.
Akan tampil signal Sell/Buy di saat gain mencukupi, baik TF Kecil maupun TF Besar TF Besar / High TF adalah Trend Kuat TF Kecil / Low TF adalah Trend Lemah
Open Posisi pada High TF, signal akan menunjukkan Sell/Buy.
FREE

STRUCTURAL TREND LINES - MT4 Indicator
Simple indicator that automatically draws trend lines based on market structure.
Features:
- 3 degrees of structure detection (short, medium, long term)
- Configurable swing strength for each degree
- Single color per degree for clean visualization
- Adjustable number of lines per degree
- Customizable colors and line widths
How it works:
The indicator identifies swing highs and lows based on the strength parameter,
then connects these points to create t
FREE
This indicator allows to hide OBV (on all MT4 timeframes) from a date define by the user with a vertical line (Alone) or a panel (with "Hidden Candles"). Indicator Inputs: Apply To Information on "On Balance Volume" indicator is available here: https://www.metatrader4.com/en/trading-platform/help/analytics/tech_indicators/on_balance_volume ************************************************************* Hey traders!! Give me your feeds! We are a community here and we have the same objective....
FREE
Highly configurable Volume indicator.
Features: Highly customizable alert functions (at levels, crosses, direction changes via email, push, sound, popup) Multi timeframe ability Color customization (at levels, crosses, direction changes) Linear interpolation and histogram mode options Works on strategy tester in multi timeframe mode (at weekend without ticks also) Parameters:
Volume Timeframe: You can set the lower/higher timeframes for Volume. Volume Bar Shift: you can set the offset of the l
FREE

Please refer to full version: https://www.mql5.com/en/market/product/140908
Key Zone Detector Key Level Supply & Demand Zone Detector Overview A sophisticated supply and demand zone detection indicator that identifies and rates key price levels where significant market activity occurs. The indicator uses fractal analysis and multiple validation methods to detect and classify trading zones. Key Features Zone Detection Auto-detects support and resistance zones Uses dual fractal system (fast and
FREE

This indicator does not process the price chart data and does not provide trading signals. Instead, it is an application to compute and display the frequency response of many conventional indicators. Moving averages like the SMA, LWMA and EMA, and oscillators like the MACD, CCI, Awsome Osc, all have the form of digital filters. Electronic engineers use a special method to characterise the performance of these filters by studying their frequency response. Two important quantities of the freque
FREE

"Five Minute Drives" indicator that is designed to be used in the 5 minute timeframe. One of its most important advantages is that it shows the general trend in the upper time frames when looking at the 5-minute timeframe. Therefore, when opening positions in the 5 minute timeframe, when it is in line with the trends in the upper timeframes, you are less likely to be upside down. If you can evaluate breakout/breakdown opportunities between the curves on the graphic screen with your geometric per
FREE

AdvaneZigZag Indicator
Are you tired of the limitations of the traditional ZigZag indicator? Meet AdvaneZigZag, the ultimate tool to simplify your market structure analysis and enhance your trading strategies. Designed with flexibility and precision in mind, AdvaneZigZag brings you advanced features to navigate the market with confidence.
Key Features:
1. Enhanced Flexibility:
- While maintaining the familiar simplicity of the conventional ZigZag indicator, AdvaneZigZag offers superior a
FREE

Pullback Viewer is designed to show valid pullback points in a bearish or bullish trend.
What is considered a valid pullback?
A valid pullback needs to have a body close outside the previous candle high (in a bearish trend ) or previous candle low (in a bullish trend ). If the candle wicks out the previous candle, it's not a valid pullback.
Pullback must liquidate the previous candle with a clean candle body close.
When is this indicator useful?
It's useful to understand and
FREE

Этот индикатор был модифицирован согласно 'Пути черепахи'. Он формирует канал на основе цены открытия и значений ATR текущего бара. Turtle ATR Channel можно использовать для помощи при определении состояния перекупленности и перепроданности рынка.
Расчет Верхний канал = Open + r1*ATR Нижний канал = Open - r2*ATR Где: Open - цена открытия текущего бара. ATR - значение ATR текущего бара. r1, r2 - коэффициенты ATR.
Входные параметры ATR Period - период индикатора ATR, по умолчанию - 14. ATR Up Ra
FREE
Что такое Schaff Trend Cycle? Schaff Trend Cycle (STC) — это индикатор типа осциллятора, разработанный для своевременного выявления разворотов тренда. В отличие от традиционных индикаторов, таких как скользящие средние или MACD, он сочетает в себе циклические колебания и импульс для более точного определения начала и окончания тренда. Основные характеристики Четкие сигналы разворота тренда: линия цикла поднимается при восходящем тренде и опускается при нисходящем. Снижение шумов во флетовых рынк
FREE

Выделяет торговые сессии на графике Демо-версия работает только на графике AUDNZD !!! Полная версия продукта доступна по адресу: (*** будет добавлено ***) Trading Sessions Indicator (Индикатор торговых сессий) отображает начала и окончания четырех торговых сессий: тихоокеанской, азиатской, европейской и американской. возможностью пользовательской настройки начала/окончания сессий; возможность отображения только выбранных сессий; работает на M1-H2 таймфреймах;
В индикаторе можно настроить следую
FREE

Broken Trends - индикатор для скальперов и интрадейщиков. В режиме реального времени он подбирает и показывает на графике трендовые линии. Индикатор реагирует на импульсы цены: поиски трендов начинаются как только амплитуда импульса превысит порог, задаваемый специальным параметром. Также индикатор может подавать звуковые сигналы при пересечении ценой актуальной трендовой линии. В обычном режиме индикатор показывает только по одному (последнему найденному) восходящему и нисходящему тренду, но им
FREE
This indicator for MT4 automatically draws support and resistance levels based on fractals, highlighting key areas of the market where the price could reverse or slow down. Fractals are graphical structures that identify significant highs and lows, thus forming a dynamic system of support and resistance levels. The indicator allows you to visualize these levels directly on the chart, facilitating technical analysis and identifying potential entry or exit points in the market. It is an ideal too
FREE

You can see resistance and support levels with the Gann Square 9 calculator. You can adjust the sensitivity setting to suit your needs and the symbol. If you leave the sensitivity at 0, it will work with the default values. I recommend adjusting it to suit your needs and the symbol. Good luck.
I plan to improve the Gann Square 9 indicator and create signals in the next version. If you have any requests, please leave them in the comments. Thank you.
FREE
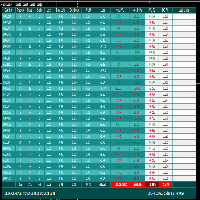
FCK Trade Report This indicator was developed by Fx Candle King. BEFORE CHOOSE CUSTOM PERIOD, GO TO TERMINAL WINDOW (ctrl+T), right click on ACCOUNT HISTORY and CHOOSE ALL HISTORY. This report searches the filtered data in your ACCOUNT CURRENT & HISTORY TRADE, Select your timespan for the report open and closed trades etc... Chose the report type - List only OPEN orders / List only CLOSED orders / List both OPEN and CLOSED orders
FREE

This is a trend indicator.
Timeframe: any Symbol: any Color meaning: blue: long trend, up trend red: short trend, down trend yellow: market trend is changing Feature: 1, very easy to use, obvious signal, profitable 2, suitable to work on charts of any timeframe 2, all type of alerts 3, standard data buffers, can be easily implanted into any EA program. 4, all color customizable.
wish you like it :)
FREE
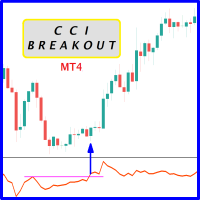
Probability emerges to record higher prices when CCi oscillator breaks out oscillator historical resistance level when exhibit overbought values. Since, oscillator breakout of support and resistance have similar effect as price breaks support and resistance levels, therefore, its highly advised to confirm price breakout with oscillator breakout; certainly, will have the same output in short trades. Concept is based on find swing levels which based on number of bars by each side of peak or trough
FREE
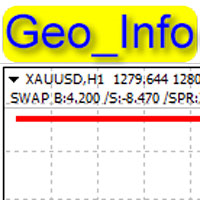
Geo_Info - один из наиболее информативных индикаторов, в компактном виде отображает основную информацию о торговом инструменте, открытых позициях, отображает НЕТТО-уровни. выводит в строку в левом верхнем углу графика в кратком виде информацию об основных параметрах инструмента: Своп для ордера Buy, своп для ордера Sell, текущий спред, залог (маржу), размер тика, уровень стопов, уровень заморозки ордеров . Информация выводится из расчета на один лот и в пунктах. Информация выводится в следующем
FREE

Pivot levels is indicator showing 7 pivot levels. It is adjusted for major use, including: all standard time frames
choice of periods to show three popular calculation formulas (typical, median, weighted) 9 level Camarilla pivot
pivot day shift choice of properties for lines and labels choice of showing alerts when crossing pivot lines Parameters: ----------Main parameters----------- Timeframe - time frame for pivot levels
Number of periods to show - displays pivot levels for number of periods
FREE

NOTE!: The trend vote and the buy sell option shall match to the same direction before you put a trade!!
Indicator that uses Kalman filters (same as used on autonomous vehicles for data fusion between different sensors / technologies such as RADAR, LIDAR and Camera with Artificial Intelligence for object detection) by using the high and low price in order to identify buy and sell signals as indicated on the graph.
This indicator can be used on any timeframe with any currency or symbol.
This i
FREE

Introducing the Pivot Point Selector Indicator: Your Ultimate Tool for Custom Pivot Levels Are you ready to take your trading to the next level? Say hello to the Pivot Point Selector Indicator, a game-changing tool that puts you in control of your pivot levels. This innovative indicator empowers you to choose three specific points that will determine the pivot level calculations, giving you unparalleled customization and precision in your trading strategy. Key Features and Benefits: Custom Pivo
FREE

ATSCStrategy is a versatile indicator designed for both binary options and forex markets. Empower your trading strategies with this dynamic tool, providing valuable insights for making informed decisions in the fast-paced world of binary options and forex trading.
-Forex Market
-Binary Option Market
-Binary use timeframe 1M - 5M
-Forex use timeframe M30 or high
FREE
Check out other great products from https://www.mql5.com/en/users/augustinekamatu/seller
This indicator is the best so far at estimating reversal points especially on high time frames. It does not repaint and is based on a combination of moving averages computed using custom functions. No inputs required, it is simple plug and play. The principles used ensure that it can be used on CFDs, Commodities and Stock with incredibly great results. With proper money management and portfolio balancing
FREE
The MACD 2 Line Indicator is a powerful, upgraded version of the classic Moving Average Convergence Divergence (MACD) indicator.
This tool is the embodiment of versatility and functionality, capable of delivering comprehensive market insights to both beginner and advanced traders. The MACD 2 Line Indicator for MQL4 offers a dynamic perspective of market momentum and direction, through clear, visually compelling charts and real-time analysis.
Metatrader5 Version | All Products | Contact
FREE

Индикатор анализирует все символы из окна "Обзор рынка" и выбирает подходящие для торговли. В работе использутся пять наиболее эффективных и популярных индикаторов: Скользящая средняя ADX RSI Parabolic SAR MACD Для анализа рассчитываются два бара. Для работы достаточно запустить индикатор на одном графике. После запуска на графике отображаются блоки с данными по каждому из символов. Если блок окрашивается в коралловый или синий цвет, это указывает на изменение тренда, достаточное для совершения
FREE

If you trade or wish to trade the popular HLHB Trend-Catcher System, then this indicator is for you! It detects when the HLHB system entry rules are met and sends out an alert in the form of notifications to your mobile phone and to your pc. By automatically sending you notifications, this indicator lessens your trading work load as you don't have to sit in from of your pc all day checking all the chats for when the entry rules are met. This indicator does all the dirty work for you. When the si
FREE

Three Bar Break основан на одном из методов торговли Линды Брэдфорд Рашке, который мне показался хорошим в определении потенциальной будущей волатильности цены. Индикатор ищет те моменты, когда High текущего бара ниже High второго бара, а также Low текущего бара выше Low второго бара. Это свидетельствует о возможности прорыва рынка на новый уровень в течение 2-3 следующих баров. Индикатор следует применять в основном на дневных графиках, чтобы помогать определять потенциальные движения в ближайш
FREE

Если вам нравится этот проект, оставьте 5-звездочный обзор. Как институционалы торгуют большими объемами, для них не должно пытаться
защищать свою позицию на определенных процентных уровнях. Эти уровни будут служить естественной поддержкой и устойчивостью, которую вы
можете использовать
либо войти в торговлю или быть в курсе возможных опасностей против вашей
позиции. Этот осциллятор покажет вам вариацию процент для: День. Неделя. Месяц. Квартал. Год. В подокте, где вы следите за своими опорами
FREE
Easily track and trade with the trend using this indicator. Uses a circle and line to indicate the trend direction. Excellent for channels. Features alert function.
Parameter TrendPeriod can be changed to your preference. How to use: Simply attach to any chart. Blue circle plus blue line cross below price = Buy. Red circle plus red line cross above price = Sell. Best results when taking higher time frames into consideration before entering a trade. (Hint: Wait for the radar/circle to appear on
FREE
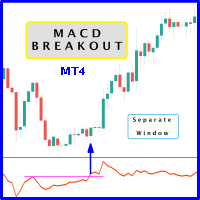
Probability emerges to record higher prices when MACD breaks out oscillator historical resistance level. It's encouraged to confirm price breakout with oscillator breakout since they have comparable effects to price breaking support and resistance levels; certainly, short trades will have the same perception. As advantage, many times oscillator breakout precedes price breakout as early alert to upcoming event as illustrated by second and third screenshot. Furthermore divergence is confirmed in c
FREE

This powerful tool helps you to easily access Fibonacci tools at different times and in different markets. This tool has the ability to send signals based on Fibonacci as well as setting alarms to be aware of broken Fibonacci levels. Among the capabilities of this tool are the following:
Identifies market trends Fibonacci auto design If Fibonacci levels are broken, it sends a message Send Fibonacci signal
Manuals: After selecting the target market, run the tool In the input settings according
FREE

The Multi-Timeframe High Low Points (MTF High Low Points) indicator is a powerful tool for traders using MetaTrader 4 (MT4) to analyze price movements across different timeframes. This versatile indicator helps traders identify significant support and resistance levels by displaying the highest and lowest price points within a specified number of bars on multiple timeframes simultaneously. Key Features: Multi-Timeframe Analysis: MTF High Low Points allows traders to monitor high and low price le
FREE

Индикатор определяет направление тренда и раскрашивает свечи на графике в соответствующий цвет. Позволяет входить в сделку в самом начале движения Максимально простая настройка индикатора Можно использовать на любых валютных парах, металлах и криптовалюте, а так же при работе с бинарными опционами
Отличительные особенности Показывает направление тренда Не перерисовывается; Простая и точная настройка; Работает на всех таймфреймах и на всех символах; Подходит для торговли валютами, металлами, опц
FREE

Индикатор предназначен для расчета стоимости пунктов в указанных размерах лота. Версия для MT5 здесь https://www.mql5.com/ru/market/product/29230 Построчное описание Строка 1 - валюта депозита. Строка 2 - размер лота (10 входных параметров) . Далее весь расчет стоимости ведется в столбец, под каждым лотом. Строка 3 - расчет стоимости для одного пункта. Строка 4 - расчет стоимости для спред. Все последующие строки - расчет стоимости для пунктов (20 входных параметров) . Все, что Вам нужно сделат
FREE

The Stochastic RSI indicator (StochRSI) is essentially an indicator of an indicator. It is used in technical analysis to provide a stochastic calculation to the RSI indicator. This means that it is a measure of RSI relative to its own high/low range over a user defined period of time. The Stochastic RSI is an oscillator that calculates a value between 0 and 1 which is then plotted as a line. This indicator is primarily used for identifying overbought and oversold conditions.
FREE

!!!The free version works only on "EURUSD"!!! WaPreviousCandleLevels MT4 shows the previous candle levels, it shows the previous candle Open High Low Close levels (OHLC Levels) in different time frame. It's designed to help the trader to analyse the market and pay attention to the previous candle levels in different time frame. We all know that the OHLC Levels in Monthly, Weekly and Daily are really strong and must of the time, the price strongly reacts at those levels. In the technical analys
FREE

ФТУ Корвус Индикатор для платформы mt4, можно использовать исключительно для торговли, лучше всего сочетать с другими индикаторами. Разработан с использованием различных индикаторов, таких как macd и adx, для рисования стрелки, указывающей на вход или изменение тренда. Этот индикатор похож на FTU Idioteque — см. другие мои индикаторы, такие как FTU Predictor. Посмотрите короткое вступительное видео на YouTube: https://youtu.be/n_nBa1AFG0I Функции: Продать и купить стрелки Визуальное и звуковое
FREE
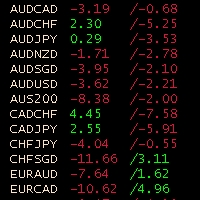
Obiforex Swaps Explore Obiforex Swaps, a robust tool that provides information on the swaps for both short (sell) and long (buy) positions. This indicator is particularly valuable when implementing the "triple swap" strategy, enhancing your trading capabilities. The program is specifically designed to support the first 75 currency pairs, offering a broad range of trading opportunities. We recommend using reputable brokers such as TITANFX and ICMARKETS for optimal performance. If your currency pa
FREE

Этот индикатор основан на практическом опыте.
Вставьте дату/время вашего топ/боттома.
Рассчитывает наиболее посещаемый уровень от вершины/нижнего уровня до текущего момента.
Обновляется автоматически с каждой новой свечой. Вы можете одновременно использовать несколько индикаторов для разных трендов и таймфреймов.
Длина всегда строится от начала вашего периода до настоящего момента.
Полезный PRO-инструмент.
Переведено с помощью DeepL.com (бесплатная версия)
FREE
ATT Support and Resistance— лёгкий индикатор для MetaTrader, который в реальном времени находит локальные максимумы и минимумы по фрактальному принципу и автоматически строит по ним значимые уровни поддержки и сопротивления. Убирает «шум» близко расположенных линий и обновляет зоны при каждом новом тике без лишней нагрузки на терминал.
Преимущества ATT Support and Resistance: Быстрое выявление ключевых ценовых зон на любом таймфрейме Автоматическая фильтрация близких уровней — только самые важ
FREE
Highly configurable MFI indicator. Features: Highly customizable alert functions (at levels, crosses, direction changes via email, push, sound, popup) Multi timeframe ability Color customization (at levels, crosses, direction changes) Linear interpolation and histogram mode options Works on strategy tester in multi timeframe mode (at weekend without ticks also) Adjustable Levels Parameters:
MFI Timeframe: You can set the current or a higher timeframes for MFI. MFI Bar Shift: you can set the
FREE

The indicator displays two Moving Average lines on the chart with parameters specified in the settings. It issues a signal in the form of arrows and a sound at the intersection of these Moving Average. In the indicator settings, you can set the period of fast Moving Average ( Fast MA Period ) and slow Moving Average ( Slow MA Period ). And also Shift, Applied Price, Method and Timeframe for two Moving Averages separately. Important:
The main difference from othe
FREE
Ultimate Signal Generator: Your Edge in the Market Are you tired of guessing your next move in the market? The Ultimate Signal Generator is here to change that. This powerful MQL4 indicator is designed to give you a clear trading advantage by providing reliable buy and sell signals. It's a smart, effective tool that helps you make confident decisions, so you can focus on your strategy, not on uncertainty. Key Advantages and Features Pinpoint Accuracy: Our indicator uses a unique blend of Bollin
FREE

Индикатор показывает точки входа с Risk-Reward-Ratio 1 к 5. Основной таймфрейм H1. Рабочие инструменты - все. Принцип работы - найти разворотный уровень, а потом отследить реакцию цены на этот уровень. В настройках не нуждается. Откладывает стандартно 5 уровней одинаковых тейк-профитов (красный/синий для селов и баев) и 1 уровень стоп-лосса - оранжевый.
ВНИМАНИЕ! Тестовая версия индикатора. Полноценно работает только на паре USDCAD! Полноценную версию можно купить здесь https://www.mql5.com
FREE

The Wave Rider Indicator: Your Key to Confident Trading Tired of trying to guess market movements? The Wave Rider indicator is your solution. It's an intelligent tool designed to help you spot profitable trends with ease and confidence. What makes it so powerful? See Trends Clearly : Wave Rider simplifies complex market data, so you can easily identify the direction of the trend and make smarter decisions. Get Timely Signals : It gives you clear buy and sell signals, helping you pinpoint the be
FREE
Multi-Timeframe EMA Momentum Filter — Version 1.0 This indicator is designed to help traders evaluate short-term EMA crossovers in the context of higher timeframe momentum. Its purpose is to reduce noise and highlight setups that align with the broader market trend. How it works: On the main chart, arrows appear when a fast EMA crosses a slow EMA on the current timeframe, provided that higher timeframe momentum confirms the direction. In the subwindow, a histogram displays the difference betwee
FREE

This simple indicator paints with a darker color on the volume bar when the quantity traded is above the average of select number of periods of the volume itself, highlighting the moments when there was a large volume of deals above the average. It is also possible to use a configuration of four colors where the color tone shows a candle volume strength. The indicator defaults to the simple average of 20 periods, but it is possible to change to other types of averages and periods. If you like t
FREE

GMMA indicator that looks like a cloud. The GMMA indicator is easy to read, but to make it even more visually pleasing, we made it look like an Ichimoku Chart cloud. Colors have been changed where short-term and long-term overlap.
My other products https://www.mql5.com/ja/users/studiotam/seller
Please reduce the character limit a bit. I have nothing more to write.
FREE

Average Price Plus is an essential indicator for day-to-day operations. With it, you can graphically check the average price between several open orders on your chart. The average price is the breakeven point between your orders. In addition to the average price, the indicator also shows you the number of pips and the financial value resulting from your open orders, the percentage gains, the number of lots in operation and the number of open orders. Negative values in "pips" or in financial val
FREE
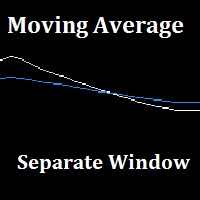
"Separate Moving Average" is a custom indicator made from the combination of 2 moving averages in a different window (the indicator window) for the goal of removing the clutter from the price chart, the indicator also has arrows to show the moving average cross either long or short. All the moving average parameters are customizable from the indicator input window.
FREE

Future prediction is something any trader would love to know, through this simple prediction algorithm can give a picture of the future. This algorithm is based on past data and the average prices of the data to simulate future candles. This is an indicator that will be redrawn. This indicator is completely free, can be used as a trend reference but absolutely do not use for trading.
FREE

This indicator is stand alone version from MP Pivot Levels (All in one) containing Woodie Pivots. Woodie’s pivot points are made up of multiple key levels, calculated from past price points, in order to frame trades in a simplistic manner. The key levels include the ‘pivot’ itself, and multiple support and resistance levels (usually up to three each). Traders use these levels as a guide for future price movements when setting up trades.
The pivot : (Previous high + previous low + 2 x previous
FREE
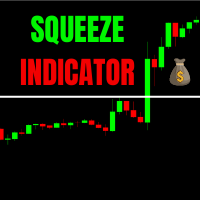
The one and only indicator that identifies Volatility Squeeze.
A Squeeze is a compression of volatility in the market.
If this compression of volatility reaches a certain percentage it means that the market could explode in moments.
I highly recommend using the indicator in conjunction with the economic calendar.
If there are important news and the indicator shows a BLUE HISTOGRAM on the exchange in question, a sign of a powerful compression of volatility.
Then get ready to grasp the next
FREE

Индикатор сглаженного Stochastic Oscillator (xStoh)
Входные параметры: xK Period - K период xD Period - D период xSlowing - замедление xMethod - метод усреднения (0-SMA | 1-EMA | 2-SMMA | 3 - LWMA) xPrice field - тип цены (0 - Low/High | 1 - Close/Close) Принцип работы
Индикатор перерассчитывает стандартный технический индикатор Stochastic Oscillator (дважды усредняет получаемые значения iStochastic).
FREE

Индикатор R Show Ticks для Metatrader 4 показывает тики вверх/вниз в режиме реального времени в главном торговом окне.
Ключевые выводы Белая стрелка — это рост. Красная стрелка — нисходящая галочка. Индикатор работает для любой валютной пары и таймфрейма по вашему выбору.
Характеристики индикатора Торговая платформа: разработана для Metatrader 4 (MT4)
Валютные пары: работает для любой пары
Таймфреймы: Работает для любого таймфрейма
Входные параметры: Входной символ, стиль, цвет.
Тип индик
FREE

Целью этой новой версии стандартного MT4 индикатора, входящего в поставку платформы, является отображение в подокне нескольких таймфреймах одного и того же индикатора. См. пример, приведенный на рисунке ниже. Однако индикатор отражается не как простой индикатор MTF. Это реальное отображение индикатора на его таймфрейме. Доступные настройки в индикаторе FFx: Выбор таймфрейма для отображения (от M1 до MN) Установка ширины (количество баров) для каждого окна таймфрейма Всплывающее оповещение/звуков
FREE

4 trendlines are given by 2 timeframes, defined by the zigzag indicator. It leverages the Zig Zag indicator to identify significant highs and lows across two configurable timeframes (default: M15 for short-term and H1 for medium-term), automatically plotting upward and downward trendlines for each. This helps visualize trend structures, reversals, and alignments between timeframes without switching charts, while adhering to trendline rules that contain the high and low points of the previous two
FREE
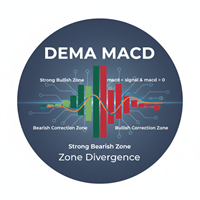
Indicator: The DEMA MACD Zone Divergence This is a powerful, multi-timeframe trend-following indicator based on the Moving Average Convergence Divergence (MACD) , but enhanced using Double Exponential Moving Averages (DEMA) for reduced lag. Its main function is to paint the background of the price chart with color-coded rectangular zones, clearly signaling the current momentum phase and potential shifts in market control (bullish or bearish). Core Purpose To visually map the strength and phas
FREE
Highly configurable RSI indicator. Features: Highly customizable alert functions (at levels, crosses, direction changes via email, push, sound, popup) Multi timeframe ability Color customization (at levels, crosses, direction changes) Linear interpolation and histogram mode options Works on strategy tester in multi timeframe mode (at weekend without ticks also) Adjustable Levels Parameters:
RSI Timeframe: You can set the current or a higher timeframes for RSI. RSI Bar Shift: you can set t
FREE

This indicator provides common shapes as drawing object options. The shapes are rotatable, resizable, draggable, and will keep their proportions (according to their handle trendline) across different chart scales. Multiple drawings are supported.
Shapes: Square Rhombus
Triangle (quadrilateral & isosceles) Circle (grid, overlapped grid, flexi grid, rotatable grid, concentric circles) Features: rays (all object edges will be rays) show/hide each individual drawing type, or all delete last drawn ob
FREE
MetaTrader Маркет предлагает каждому разработчику торговых программ простую и удобную площадку для их продажи.
Мы поможем вам с оформлением и подскажем, как подготовить описание продукта для Маркета. Все продаваемые через Маркет программы защищаются дополнительным шифрованием и могут запускаться только на компьютере покупателя. Незаконное копирование исключено.
Вы упускаете торговые возможности:
- Бесплатные приложения для трейдинга
- 8 000+ сигналов для копирования
- Экономические новости для анализа финансовых рынков
Регистрация
Вход
Если у вас нет учетной записи, зарегистрируйтесь
Для авторизации и пользования сайтом MQL5.com необходимо разрешить использование файлов Сookie.
Пожалуйста, включите в вашем браузере данную настройку, иначе вы не сможете авторизоваться.