Trend following
- Indicadores
- Versión: 1.10
- Actualizado: 2 febrero 2022

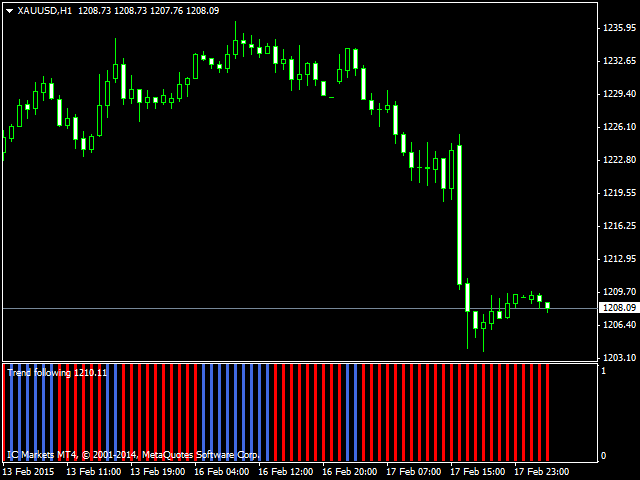
El EA en forma de histograma muestra las tendencias al alza y a la baja.
Se recomienda utilizar esta herramienta como filtro. Sus lecturas ayudarán a detectar el comienzo, el final y la continuación de una tendencia.
Esta herramienta adicional se adaptará a cualquier sistema de trading.
Parámetros
- Period - periodo del indicador;
- Barras - número de barras en el historial.

Как сигнальный, можно использовать, но обязательно с фильтрами.