WallStreet Pro Analyzer MT4
- Indicators
- Version: 1.0
- Activations: 20

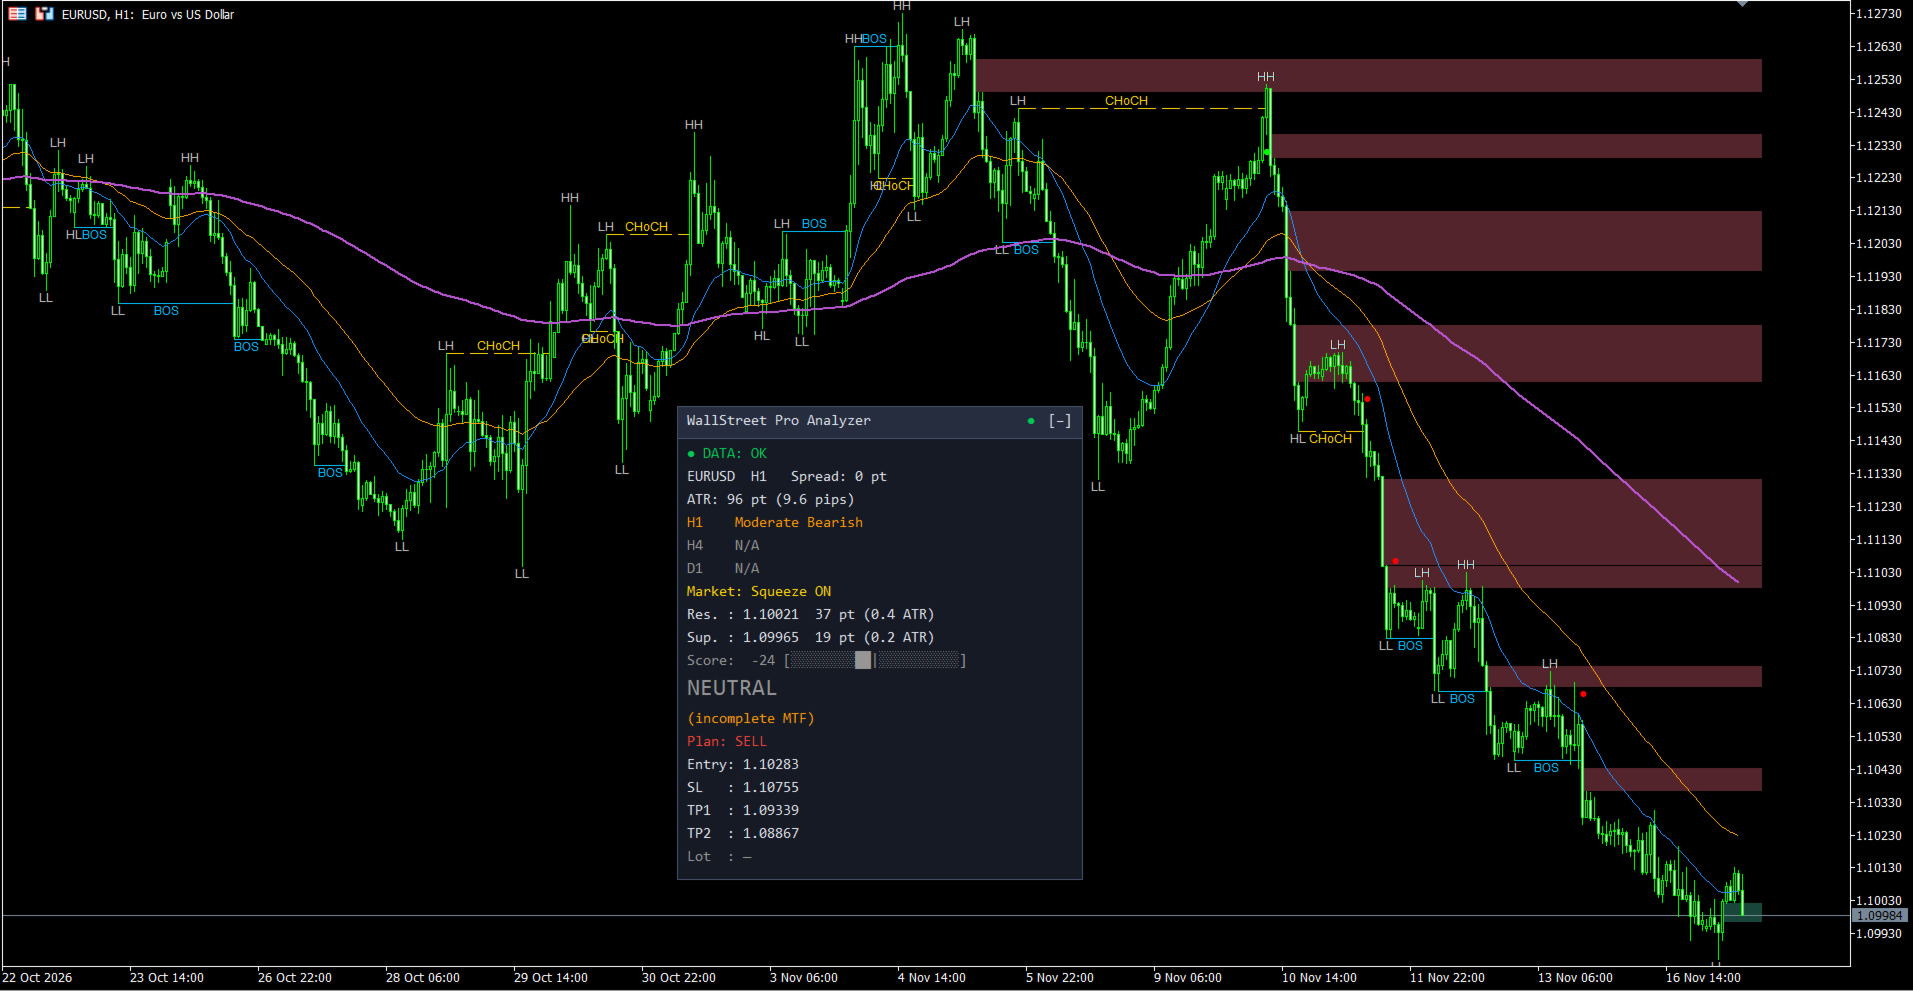
WallStreet Pro Analyzer is a MetaTrader 4 indicator that puts everything a trader usually checks by hand before a trade onto one chart: trend on three timeframes, market structure, imbalance zones, liquidity levels, momentum and volatility. All of it is reduced to a single score from -100 to +100, a clear verdict and a ready trade plan with entry, stop loss, two targets and lot size. The indicator does not repaint: every calculation uses closed bars only.
MetaTrader 5 version: https://www.mql5.com/en/market/product/209059
ATTENTION - GIFT! PLEASE CONTACT ME AFTER PURCHASE TO GET ANY OF MY INDICATORS FOR FREE!
How the indicator works
- Trend on three timeframes. The indicator rates the direction and strength of the trend on the current timeframe and two higher ones. Each gets a class: strong bullish, moderate bullish, flat, moderate bearish, strong bearish or mixed. Three EMA lines of the current timeframe can be shown on the chart.
- Market structure. Swing highs and lows are labelled HH, HL, LH, LL. A break in the direction of the structure is marked BOS, the first break against it is marked CHoCH.
- Imbalance zones (FVG). Price gaps left by fast moves are drawn as rectangles that extend to the right until price fills them.
- Liquidity levels. The previous day high and low (PDH, PDL) and the previous week high and low (PWH, PWL) are drawn as horizontal lines.
- Momentum and divergences. The indicator tracks momentum in the background and draws a line on the chart when price and momentum diverge.
- Squeeze. It detects volatility compression and the moment price breaks out of it, with the breakout direction.
- Score and signals. All blocks are combined into one Score. When the Score crosses the signal threshold, a Buy or Sell arrow appears on the closed bar. The strongest signals, where all three timeframes point the same way, get the A+ class.
- Data status. The indicator checks that history for all timeframes is loaded and shows the loading progress. It gives no signals on incomplete data unless you allow it.
How to use the indicator
- Attach the indicator to a chart and wait until the status line shows DATA: OK.
- Look at the three trend lines. If all timeframes point the same way, trade in that direction. If they disagree, be more careful.
- Check the Score and the verdict: STRONG BUY, BUY, NEUTRAL, SELL or STRONG SELL.
- When an arrow appears, the panel shows a trade plan: entry, stop loss, two targets and the lot size for your risk percent. Use it as is or as a reference.
- Use the nearest resistance and support to judge how much room price has to move.
- Turn on alerts to receive signals without watching the chart. By default only A+ signals are sent.
The indicator works on any symbol and timeframe. Expert Advisors can read the Score and the signal direction from two indicator buffers.
What the panel shows
| Panel line | What it means | What it is for |
|---|---|---|
| Data status | History readiness: OK, synchronizing, loading with progress, recalculating, low history, no data | Tells you whether the panel values can be trusted right now |
| Symbol, timeframe, Spread | Current symbol, chart period and spread in points | Helps you judge the cost of entry |
| ATR | Average candle size in points and pips | Shows current volatility and helps you size the stop |
| Three trend lines | Trend class on the current and two higher timeframes, colour-coded | Shows whether the timeframes agree on direction |
| Market | Market state: trend, flat, Squeeze ON or Squeeze fired with direction | Tells you the current regime: move, range or build-up before a breakout |
| Res. and Sup. | Nearest resistance and support: price, distance in points and in ATR | Shows where price may stop and how far away that is |
| Score | Overall score from -100 to +100 with a scale | One number for the balance between buyers and sellers |
| Verdict | STRONG BUY, BUY, NEUTRAL, SELL or STRONG SELL in large font | A quick conclusion without reading the other lines |
| Plan | Entry, SL, TP1, TP2, lot and the A+ mark while a signal is active | A ready trade plan with position size for your risk |
The panel can be dragged by its header and collapsed with the button in the header. Its position and state are remembered. Panel language: English or Russian.
Settings
Main Settings
- Max history bars to analyze - how many history bars the indicator processes.
- Minimum warm-up bars - how many bars each timeframe needs before calculations count as reliable.
- Data wait timeout (sec) - how long to wait for history before working with what is available.
- Allow signals on incomplete history - allows arrows and alerts when history is short.
- Show status when everything is OK - whether to show the status line when data is fine.
- Higher TF+1 (current = auto), Higher TF+2 (current = auto) - manual choice of the higher timeframes. By default they are picked automatically.
Trend Filters
- Fast EMA period, Middle EMA period, Slow EMA period - periods of the three moving averages.
- ADX period, ADX: strong trend threshold, ADX: flat threshold - trend strength period and the borders of a strong trend and a flat market.
- RSI period, MACD: fast EMA, MACD: slow EMA, MACD: signal line, ATR period - periods of the momentum and volatility blocks.
- Squeeze: BB / Keltner period, Squeeze: Bollinger deviation, Squeeze: Keltner ATR multiplier - sensitivity of squeeze detection.
- Block weight: MTF trend, position vs EMA, structure, zones, momentum - how much each block affects the Score.
- Score multiplier in flat market - how much the Score is reduced in a flat market.
- Verdict threshold STRONG BUY / STRONG SELL, Verdict threshold BUY / SELL - verdict borders.
- Score threshold for signal arrow, Score threshold for A+ signal - the Score at which an arrow appears and at which a signal gets the A+ class.
- Min ATR for signal, points (0 = off), Max ATR vs 50-bar average (multiplier) - filter for a market that is too quiet or too wild.
- Pause between signals, bars - minimum number of bars between arrows.
Smart Money and Levels
- Swing depth, bars - how many bars on each side confirm a swing. A larger value gives larger swings.
- Structure break: by close / by wick - count a break by bar close or by wick.
- BOS/CHoCH contribution decay, bars, Zones and sweep contribution decay, bars - how long an event keeps affecting the Score.
- Min FVG size, ATR fraction - minimum size of an FVG zone.
- FVG mitigation mode - when a zone counts as filled: full overlap by wick, body close beyond the edge, or 50% fill.
- Mitigated FVG: delete / gray - delete a filled zone or recolour it gray.
- FVG drawing lookback, candles - how far back zones are drawn on load.
- Max FVG on chart, Max structure labels (BOS/CHoCH), Max swing labels, Max divergence lines - limits for objects on the chart.
- Divergence: min bars between swings, Divergence: max bars between swings, Divergence: require RSI zone at 1st swing, RSI: overbought level, RSI: oversold level, Divergence stays active, bars - divergence search conditions and how long a divergence stays valid.
- Show PDH, Show PDL, Show PWH, Show PWL and their colours - switch and colour for each liquidity level.
Risk Management
- Stop-loss mode - how the stop is placed: by ATR, beyond the nearest swing, or the farther of the two.
- SL: ATR multiplier, SL: buffer beyond swing, ATR fraction - stop size and the margin beyond the swing.
- TP1: reward/risk ratio, TP2: reward/risk ratio - reward to risk for the two targets.
- Min RR to TP1 for A+ class (spread included) - minimum reward to risk for the A+ class.
- Risk calculation base - calculate risk from balance or from equity.
- Risk per trade, % - risk percent per trade used to calculate the lot.
Interface and Alerts
- Panel and alerts language - language of the panel and alerts.
- Show panel, Show EMA lines, Show signal arrows, Show swings (HH/HL/LH/LL), Show BOS / CHoCH, Show FVG, Show liquidity levels, Show divergences, Show Squeeze markers - a separate switch for each element.
- Panel anchor corner, Panel X offset, Panel Y offset, Panel scale, % - panel position and size.
- Panel theme and the dark and light theme colours - panel appearance.
- Colours of EMA lines, arrows, swing labels, BOS, CHoCH, FVG zones and divergences.
- Terminal alert, Push notification, Email - alert channels.
- Alert mode - alert on A+ signals only or on all signals.
Please subscribe to my channel so you do not miss new indicators and updates: https://www.mql5.com/en/channels/algotrader