AlgoTrade Pivot Points

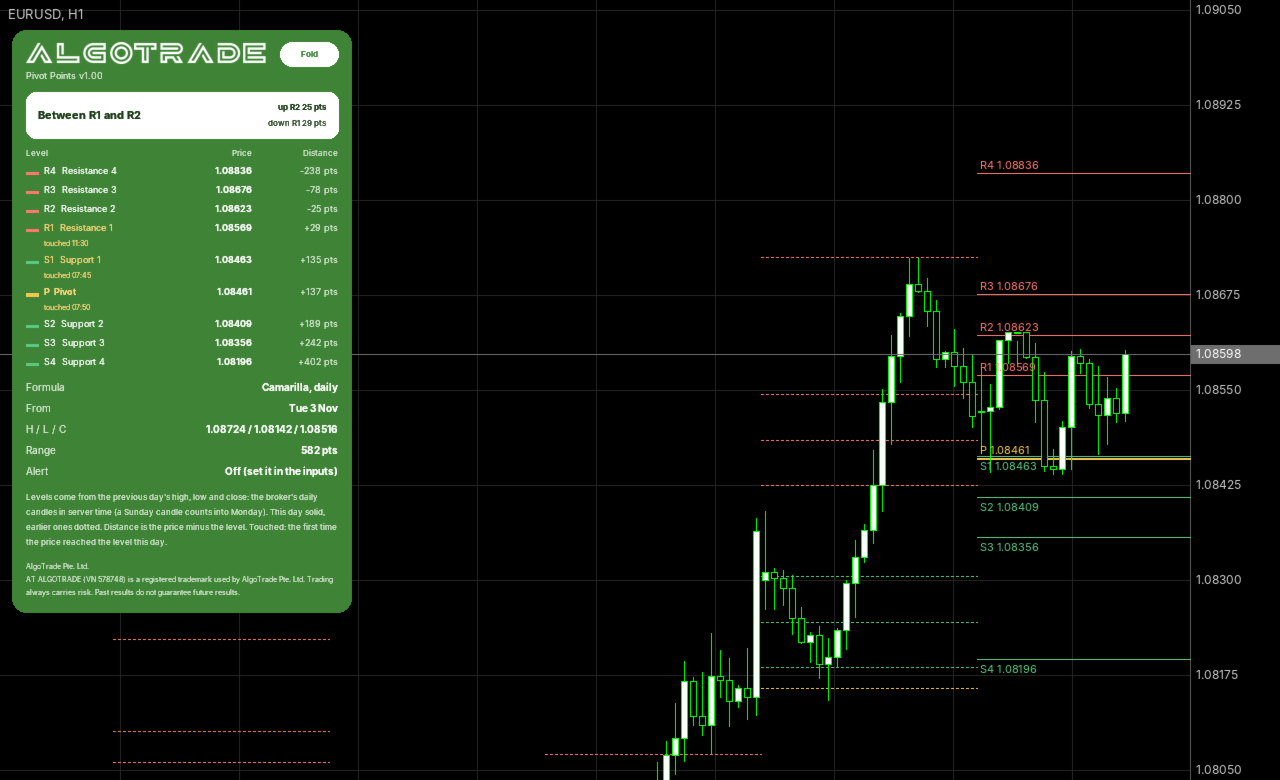
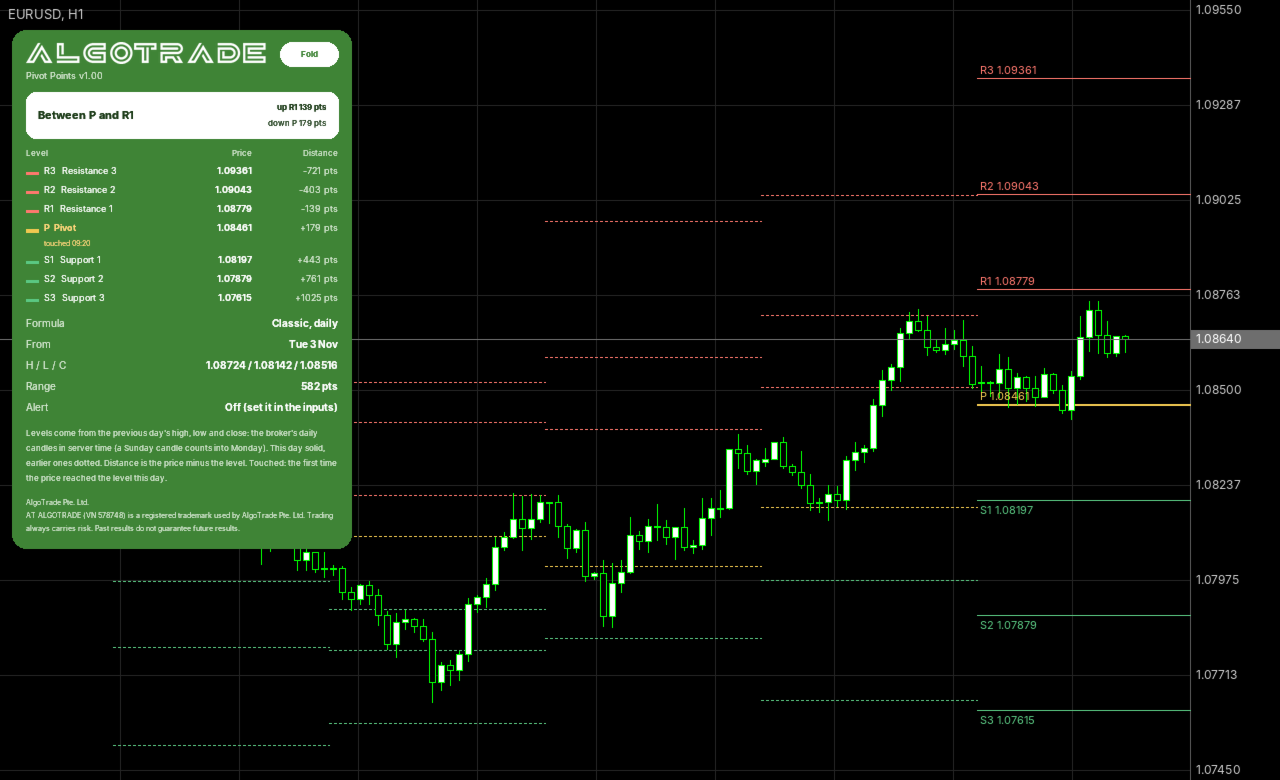
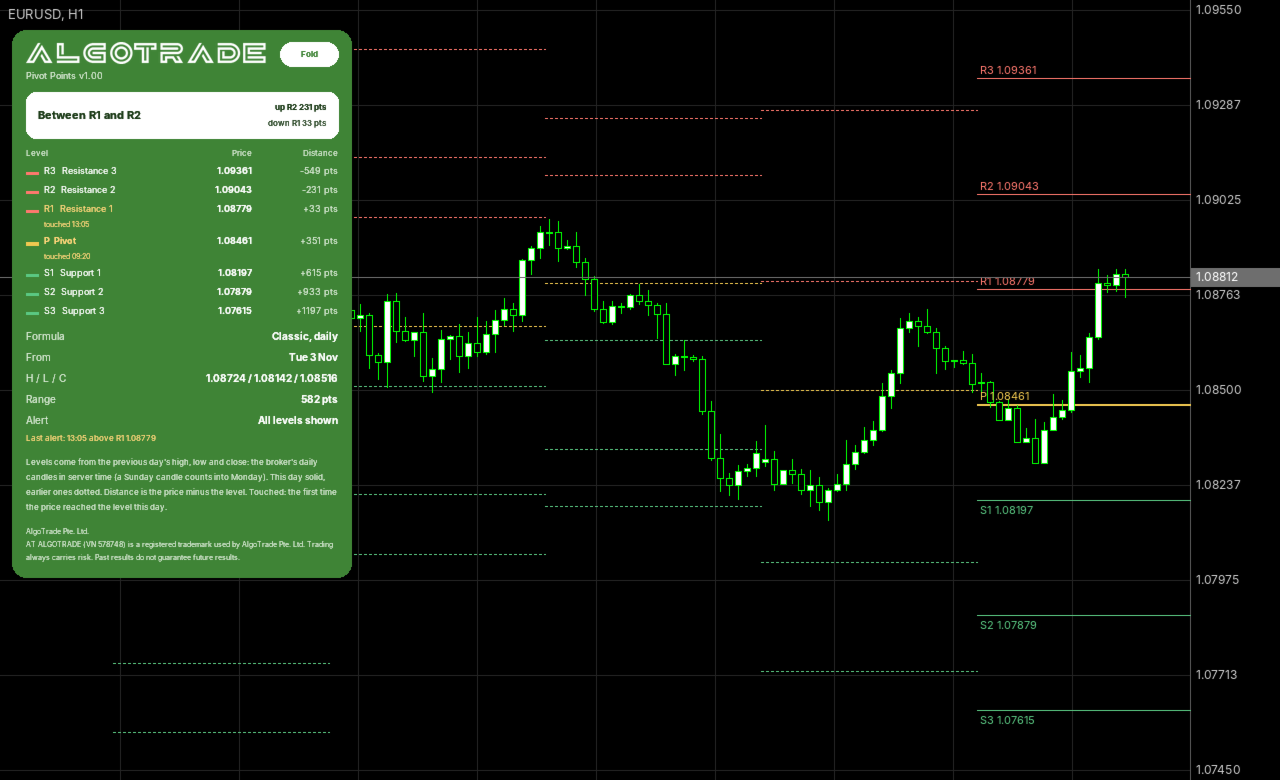
AlgoTrade Pivot Points draws the daily, weekly, or monthly pivot point, resistance, and support levels on the chart and shows the current price position on a card. It reads data only.

What it does

  • Five formulas: Classic, Fibonacci, Camarilla, Woodie and DeMark, based on the previous day's, week's or month's high, low and close (DeMark also uses the open).
  • Levels from R1 and S1 up to R3 and S3, or up to R4 and S4 with Camarilla.
  • Lines for the current period from its start, showing each level's name and price, with dotted lines for earlier periods (4 by default, up to 10). Colors fit a dark or light chart or can be set in the inputs.
  • A card that shows where the price is (for example, between P and R1), the nearest level above and below with the distance in points, and the price and distance for each level.
  • Shows which levels were touched in the current period and when the price first reached them.
  • Shows the period the levels come from, along with its high, low, close and range.
  • Optional alert when the price crosses the pivot or any level shown, with an optional push notification to your phone. Levels crossed by the same move come in one alert.

How to use

  • Attach the indicator to any chart. Choose the period, formula and number of levels to show in the inputs.
  • Days, weeks and months are the broker's daily, weekly and monthly candles in server time. On symbols that close for the weekend, a short Sunday candle is counted into Monday.
  • When the market is closed (a weekend or a holiday), the card shows the levels for the next day, week or month.
  • Click "Fold" to show a single line, or "Show" to display the full card. The card corner can be changed in the inputs.

Inputs: period, formula, levels shown, Sunday candle skipping, lines, earlier periods, line text, line colors, alerts and push notification, card corner.

Please read

  • This indicator reads data only and does not open, modify, or close trades.
  • For questions or feature requests, please post in the comments section on this page. Your reviews help us plan updates.

Made by AlgoTrade Pte. Ltd. Trading always carries risk. Past results do not guarantee future results.
Recommended products
Raymond Cloudy Day
The Hung Ngo
5 (3)
Raymond Cloudy Day Indicator for MT5 – Pivot-Based Reversal and Trend Levels Raymond Cloudy Day Indicator is a pivot-based level indicator for MetaTrader 5 (MT5). It was developed by Ngo The Hung based on Raymond’s original idea and is designed to give a structured view of potential reversal zones, trend extensions and support/resistance levels directly on the chart. The default settings are optimised for XAUUSD on the H1 timeframe, but the indicator can be tested and adjusted for other symbols
FREE
Pivot Points Classic and Camarilla draws Classic pivot levels (P, R1-R3, S1-S3) and Camarilla levels (H1-H4, L1-L4) directly on the chart. The levels are calculated from the High, Low and Close of the previous period of the timeframe you choose (D1 by default), and every period is drawn as a horizontal line over the period it applies to, so you can see how price reacted to the levels on previous days, weeks or months. Features Classic pivots - the central pivot P with three resistance (R1-R3) an
FREE
B2U Market State System Part of the B2U Market State System A professional indicator suite designed to analyze market structure, trend state, and momentum. B2U Market State System 의 구성 요소입니다. 시장 구조, 추세 상태, 모멘텀을 입체적으로 분석하기 위한 전문 인디케이터 시스템입니다. Highlights structurally validated reaction zones after FVG inversion. The New Generation of Inversion Fair Value Gaps B2U IFVG BOX & Zone visually analyzes market reaction zones formed after Fair Value Gap (FVG) inversion. 차세대 Inversion Fair Value Gaps FVG 반
FREE
RelicusRoad Daily Pivots is a daily pivot points indicator for MetaTrader 4 and MetaTrader 5 that divides the previous day's range into Fibonacci levels and extends them above and below it, from minus 100 to plus 200 percent. Instead of classic floor pivots, the previous completed range is treated as a scale where the low is 0% and the high is 100%. Nineteen levels are printed as compact colored markers at the right edge of the chart, so the size of today's move reads as a fraction or a multiple
FREE
AliPivot Points is a Meta Trader 5 Indicator that draws you the latest pivot points. You can choose from timeframes ranging from 1 Minute to 1 Month. Calculation methods for pivot points includes: Classic Pivot Points Camarilla Pivot Points Fibonacci Pivot Points Woodie Pivot Points You can personalize the line colors, style, and width to suit your preference. The indicator displays values on the right side of the chart. AliPivot Points values can also be utilized by developers for creating Expe
FREE
Daily Pivot Point Levels
Maria Luisa Aparecida Vicentim
Daily Pivot Point Levels Identify daily support and resistance levels with clarity, precision, and simplicity. Daily Pivot Point Levels is a customizable indicator for MetaTrader 5 that automatically calculates and displays the central Pivot Point (P), support levels (S), and resistance levels (R) using previous-day price data. Designed for traders who value objective price references, clean chart organization, and flexibility, the indicator offers different calculation methods and extensive vi
FREE
Important Lines
Terence Gronowski
4.88 (24)
This indicator displays Pivot-Lines, preday high and low, preday close and the minimum and maximum of the previous hour. You just have to put this single indicator to the chart to have all these important lines, no need to setup many single indicators. Why certain lines are important Preday high and low : These are watched by traders who trade in a daily chart. Very often, if price climbs over or falls under a preday low/high there is an acceleration in buying/selling. It is a breakout out of a
FREE
AlgoTrade Trading Sessions draws the Sydney, Tokyo, London and New York sessions as boxes on the chart from the high to the low of each session, and shows on a card which sessions are open, when the next one opens, and each session's range against its average. It reads data only. What it does Boxes for the sessions of recent days (5 by default) on charts up to H4, with the session name and its range in points. Colors fit a dark or a light chart, or can be set in the inputs. A card with each sess
FREE
Universal Box MT5
Sergey Ermolov
4.43 (7)
Dual Striker - a new Expert Advisor for Gold trading. Live signal +150% ->   Real Account No Martingale or averaging strategies Test it for free in your trading terminal:   Dual Striker Expert Advisor Universal Box   plots   price ranges   on the chart which can be used later to trade on a price range breakout. There are many strategies with which you can apply this indicator. The indicator is set by default to mark   Asian, European and American trading session   ranges on the chart. Ranges ar
FREE
Supertrend Premium Institutional Edition   is an advanced ATR-based trend-following indicator designed to identify market direction, generate entry signals, and provide real-time trading information. The indicator automatically detects   bullish and bearish trends , displays   buy and sell signals   when trend reversals occur, and includes a professional dashboard showing current trend status, ATR value, active trend band, and signal direction. Key features include: Automatic trend detection usi
FREE
An extended version of the indicator for visualizing the time ranges of key trading sessions: Asian, European and American. The main advantage of this indicator is the automatic construction of a price profile for a trading session. The indicator has the functionality to set the start and end time of each trading session, as well as automatically determine the time zone of the trading server. The indicators include the ability to work with minimal CPU usage and save RAM. In addition, the option
FREE
Get ALERTS for break of your TRENDLINES, SUPPORT LINES, RESISTANCE LINE, ANY LINE!! 1. Draw a line on the chart (Trend, support, resistance, whatever you like) and give it a name (e.g. MY EURUSD line) 2. Load the Indicator and input the Line Name the same name in Indicator INPUT so system knows the name of your line (= MY EURUSD line) 3. Get Alerts when Price breaks the line and closes Works on All Time frames and charts LEAVE A COMMENT AND IF THERE IS ENOUGH INTEREST I WILL WRITE AN EA WHICH W
FREE
Dynamic Key Levels
Rodrigo Ivan Ahumada Pena
Key Levels S/R — Dynamic Support & Resistance Structure Key Levels S/R is a precise and reliable indicator that identifies true Support and Resistance levels based on confirmed swing structure. Instead of guessing or repainting, it waits for market validation before marking any level — giving traders clean, trustworthy zones to work with. This tool is ideal for breakout traders, pullback traders, and anyone who uses pending orders at structurally meaningful price levels. How the Logic Works The
FREE
PivotForge
Alexandre Vincent Traber
Overview PivotForge calculates and plots Daily or Weekly Pivot Points directly on your chart, using either the Classic or Fibonacci method. Levels update automatically at the start of each new period, giving you clean, objective support/resistance zones without manual recalculation. How it works Selects the previous completed Daily or Weekly candle as the reference period Computes Pivot (PP), Resistance (R1-R3), and Support (S1-S3) using Classic or Fibonacci formulas Draws horizontal lines span
FREE
Pivot Points Buy Zones
Nils R M Peleman
4.83 (6)
Detailed Description: The   Pivot Points Indicator   is designed for traders who rely on pivot points, midpoints and support/resistance levels for their trading strategies. By automatically calculating and plotting these levels (based on   the   previous period's high, low, and close prices) , the indicator provides a clear, visual representation of critical price areas where the market may reverse or break out.The tool is particularly useful for day traders and swing traders looking to base th
FREE
Session High Low Boxes
Shanawaz Mohammed Nabi Rasool Pinjori
Session High Low draws the Asian, London and New York sessions on your chart as colored boxes, with the high and low of each session. Optional extension lines continue the session high and low after the session ends, which is useful for breakout and retest trading. Features Asian, London and New York boxes, each can be turned on or off Session high and low prices shown as labels Extension lines after the session end (hours adjustable, 0 = off) Ranges are built from M5 data, so the boxes are the
FREE
MacroStructure
Nathan Allane Philippe Keliby
*** 1 MONTH FREE *** MacroStructure puts market structure, liquidity, session levels and the macro context of MetaTrader 5 on one chart. It draws documented, rule-based elements (Break of Structure, Change of Character, Fair Value Gaps, Order Blocks, liquidity sweeps, Wyckoff events), reference levels, and a fundamental panel with a rebuilt dollar index and the MT5 economic calendar. It is a visual analysis tool: it places, modifies and closes no orders. WHY ONE INDICATOR Discretionary trad
FREE
Pivot MT5
Dmitrij Isaenko
The indicator draws daily support and resistance lines on the chart, as well as the Pivot level (reversal level). Adapted to work in MT5 The standard timeframe for calculating support and resistance levels is D1. You can choose other timeframes according to your strategy (for example, for M1-M15, the optimal timeframe for calculations is H1) The function for calculating support and resistance levels has been updated; in this calculation option, fibonacci levels are taken into account, respec
FREE
English VWAP Daily (Clean) is a simple and lightweight indicator that plots the classic Daily VWAP (Volume Weighted Average Price) directly on your MT5 chart. Features: Classic Daily VWAP calculation Supports real volume (if available) or tick volume Timezone offset option to match your broker’s server time Weekend merge option (merge Saturday/Sunday data into Friday) Clean version → no arrows, no alerts, only VWAP line VWAP is widely used by institutional traders to identify fair value, su
FREE
Professional Support & Resistance PRO Trade with Confidence. Let the Market Structure Guide You. Professional Support & Resistance PRO is an advanced MT5 indicator that automatically detects and plots high-probability Support and Resistance levels using intelligent price action analysis. Instead of cluttering your chart with unnecessary lines, it identifies the most significant levels where the market is most likely to react. Whether you're a scalper, day trader, swing trader, or position trader
FREE
This indicator is stand alone version from  MP Pivot Levels  (All in one) containing Woodie Pivots. Woodie’s pivot points are made up of multiple key levels, calculated from past price points, in order to frame trades in a simplistic manner. The key levels include the ‘pivot’ itself, and multiple support and resistance levels (usually up to three each). Traders use these levels as a guide for future price movements when setting up trades. The pivot : (Previous high + previous low + 2 x previous
FREE
AutoFibonacci draws Fibonacci retracement and extension levels automatically. It finds the significant swing high and low on the chart itself, so the levels appear without you drawing anything, and they update as new highs and lows form. Drawing Fibonacci by hand has a practical problem: you choose the swing. Two traders looking at the same chart pick different points and get different levels. This indicator removes that step. It works on any symbol and any timeframe. How the range is chosen Thr
FREE
Support and Resistance Levels with Breaks is a MetaTrader 5 indicator designed to detect important support and resistance levels based on pivot points and identify price breaks with volume confirmation. The indicator analyzes price movements around key market levels and highlights breakouts only when the volume condition is satisfied. This helps traders distinguish stronger price movements from low-volume level breaks. There are even better indicators—get them here. https://www.mql5.com/en/users
FREE
Smc Session Killzone and Breakout The Smc Session Killzone and Breakout indicator automates the institutional session trading model for MetaTrader 5. It draws the Asian, London, and New York session ranges as labelled boxes on the chart, detects when price sweeps beyond the Asian session high or low, and fires a non-repainting entry signal after a Market Structure Shift is confirmed. All signals are based on closed bars and do not repaint. The underlying model follows the sequence that institut
FREE
The Advanced Support and Resistance Indicator for MetaTrader 5 leverages sophisticated pivot point detection algorithms to autonomously identify and visualize critical price levels on the chart. Utilizing a configurable pivot period (default: 20 bars) and data source (High/Low or Open/Close), it intelligently scans historical price action within a user-defined loopback window (default: 290 bars) to pinpoint pivot highs and lows with strict validation criteria for enhanced precision. Pivots are d
FREE
Support Resistance Indicator The "Support Resistance" indicator is a versatile tool designed to help traders identify key support and resistance levels based on an underlying algorithm. These levels indicate price points where an asset historically experiences buying (support) or selling (resistance) pressure. The indicator allows traders to visualize these levels on their charts, making it easier to make informed decisions. All Products   |   Contact PARAMETERS: Timeframe : Users can select the
FREE
Automatic Trendlines
Pasi Hakamaki
4.69 (51)
The indicator draws trendlines on chart. This indicator has six inputs. User can specify alternative labels for both lines. If multiple instances of the indicator are used, the labels must differ. User can set width and color of the lines and depth which specifies what significant peaks should be used. For example, Depth=10 sets trendlines using the current peaks and valleys that have at least 10 bars to the right and to the left and that have highs/lows less/greater than the peak's high/low. In
FREE
Intraday Supply & Demand Free Supply and Demand Zone Indicator for MetaTrader 5 Intraday Supply & Demand automatically identifies potential Supply and Demand zones using confirmed price pivots and ATR-based price movements. The indicator helps traders visualize important price areas and track how many times each zone has been retested after confirmation. Key Features Demand Zones (Green): Potential buying support areas. Supply Zones (Red): Potential selling resistance areas. Touch Counter: Displ
FREE
Shadow Flare MT5
Kestutis Balciunas
Shadow Flare Indicator is a non-repainting trend & liquidity tool for MetaTrader 5. It runs a configurable moving-average baseline (HMA, EMA, SMA, or RMA) wrapped in an Average True Range envelope and produces a sticky trend state that only flips when price closes through the upper or lower band. The same trend engine drives an automatic supply/demand zone module that detects pivot highs and pivot lows, draws coloured boxes around them, and mitigates each zone the moment price closes through it.
FREE
My Candle Patterns
Francisco Gomes Da Silva
5 (1)
This indicator is a demo version of the complete My candle, which can be downloaded here: Candle Patterns Creator With the full version, you can create your own candle rules and modify a traditional candle pattern to be more accurate according to your strategy. The indicator includes several example candle rules, but here I will demonstrate only a few: Pattern Rule Candle Green C > O Candle Red C < O Doji C = O Hammer (C > O and (C-O) *2 < O-L and (C-O) *0.5 > H-C) or (C < O and (O-C) *2 < C-L a
FREE
Buyers of this product also purchase
Trend Sniper X
Sarvarbek Abduvoxobov
4.86 (43)
Trend Sniper X is a multi-timeframe trend-following indicator for MetaTrader 5 that helps traders identify trend direction and potential reversal points with clarity and precision. for MT4: https://www.mql5.com/en/market/product/193245 Price Information: The current price is promotional and is subject to change as upcoming updates and new features are released. Bonus Offer: To get the FREE Auto-Trade Assistant EA for this indicator, please message the author after purchasing. Code2Profit Channe
Smart Trend Trading System — MetaTrader 5 Message me on MQL5 after purchase to receive Smart Universal Expert Advisor for FREE, plus the online course, PDF manual, and private group access. STTS brings trend direction, entry and exit signals, reversal zones, and important price levels together on your chart. Follow the system manually, or connect a separate compatible EA for automated execution using your chosen settings. ONE SYSTEM. FOUR TRADING APPROACHES. STTS organizes its trading approaches
A new King in town - Indicator + Order management indications(tp1+tp2+tp3) + Optional Telegram Signal sender   INCLUDED (FREE) + Bonus EA Robot ( FULL TRADING  and SIGNAL SYSTEM ) Our best EA for Gold: Gold Slayer TRY > Reversion Queen  Expert advisor >JOIN Community Channel < NEW Free Automation EA link < click here ( disclaimer: this is new and still on testing and phase , use at your risk on demo) Free Telegram Bridge < click here  This indicator includes an advanced Strategy, a trading sys
Zoryk Gold
Reda El Koutbane
4.78 (18)
discount ends SOON next price 69 $ ZORYK — Advanced XAUUSD Signal System for MetaTrader 5 You know the feeling. You spend time analyzing gold. You wait for the entry. You finally open the trade, and price immediately moves against you. You close too early, move the Stop Loss or hesitate for a few seconds. Then the market reaches the exact destination you originally expected without you. The direction was not always the problem. The real problem was uncertainty. You did not know exactly where th
Ultra Indicator
Ihor Otkydach
5 (1)
ULTRA is a technical indicator that operates on an “all-in-one” basis—it independently analyzes the market, generates trading signals, displays levels for setting stop-loss orders, and suggests when to close trades to lock in profits or minimize losses. In other words, it doesn't matter if you don't know how to analyze the market, determine levels—where to set your stop-loss—or struggle with money management. ULTRA will do all of that for you! BUYER BONUS: After purchasing the ULTRA indicator, s
M5 Sniper
MeanFX
5 (3)
Get your trading edge in the line of sight M5 Sniper   is a new indicator by MeanFX. It combines   precise trading signals   with   adaptive TP/SL levels   - creating best possible statistical trades as a result! The price increases every 5 purchases, the next price is 79$ Message me after purchase to receive tips/guide and bonus EA Auto Optimisation only works on LIVE chart , needs data feed >JOIN Community Channel < What makes it stand out?   Proven statistical performance   on Gold XAUUSD
In 2019 I showed the whole world what this indicator can do. I traded its signals by hand, on a real account, in the open — the account was monitored live on Myfxbook, and I covered my experiment in detail on Facebook. The result: $10,000 became $941,411 in four months. The risk was deliberately extreme — the drawdown reached 54%, because in our profession profit and risk always go hand in hand. The Myfxbook screenshot is the first picture in the gallery. Looks like congratulations are in order:
SuperScalp Pro
Van Minh Nguyen
4.54 (37)
SuperScalp Pro - Professional Multi-Layer Confluence Scalping System SuperScalp Pro is an advanced scalping indicator that upgrades the classic Supertrend with multiple intelligent confirmation filters. It helps you identify higher-probability Buy/Sell opportunities while significantly reducing false signals. Clear Buy and Sell arrows appear directly on the chart, along with automatic ATR-based Stop Loss and Take Profit levels calculated in real time. After purchase, please message me on MQL5 to
Gann Made Easy   is a professional and easy to use Forex trading system which is based on the best principles of trading using the theory of W.D. Gann. The indicator provides accurate BUY and SELL signals including Stop Loss and Take Profit levels. You can trade even on the go using PUSH notifications. PLEASE CONTACT ME AFTER PURCHASE TO GET TRADING  INSTRUCTIONS   AND GREAT EXTRA INDICATORS  FOR FREE! Probably you already heard about the Gann trading methods before. Usually the Gann theory is a
SMC Intraday Formula
VividMind Digital Solutions
5 (26)
Secure the Lowest Price Today. After purchase, contact via   MQL5 inbox   to receive your buyer kit and bonus. Let's be honest first. No indicator will make you profitable on its own. If someone tells you otherwise, they're selling you a dream. Every indicator that shows perfect buy/sell arrows can be made to look flawless — just zoom into the right window of history and screenshot the winners. We won't do that. SMC Intraday Formula is a tool. It reads the market structure for you, maps the hig
M1 Sniper MT5
Oleg Rodin
5 (7)
M1 SNIPER  is an easy to use trading indicator system. It is an arrow indicator which is designed for M1 time frame. The indicator can be used as a standalone system for scalping on M1 time frame and it can be used as a part of your existing trading system. Though this trading system was designed specifically for short-term trading, it still can be helpful for all traders. This trading system can be used with any forex pair and time frame, though lower time frames are recommended from M1 up to M
GoldenX Entry MT5
VividMind Digital Solutions
5 (17)
Price will increase by $20 every 10 buyers to maintain premium value. After purchase, contact via   MQL5 inbox   to receive your buyer kit and bonus. You have probably tested dozens of indicators before. But we are not here to be “just another signals indicator.” Behind GoldenX Entry is intensive research & development focused on building sophisticated algorithms designed to adapt to the real behavior of every instrument — not generic signals recycled everywhere else. From advanced Auto Optim
Gold Entry Sniper
Tahir Mehmood
5 (21)
Gold Entry Sniper – Professional Multi-Timeframe ATR Dashboard for Gold Scalping & Swing Trading Gold Entry Sniper is a cutting-edge MetaTrader 5 indicator designed to give traders precise buy/sell signals for XAUUSD and other symbols, powered by ATR Trailing Stop logic and a multi-timeframe analysis dashboard . Built for both scalpers and swing traders, it combines real-time market direction , dynamic stop levels , and professional visual dashboards to help you identify high-probability gold en
Gold Trend Coach MT5
Cristhian Alexander Gaibor Cuasquer
5 (4)
Gold Trend Coach is a gold (XAUUSD) trend indicator for MetaTrader 5 with buy and sell signals, stop loss and three take profit targets confirmed on candle close (no repaint), a coach that guides you from the entry to TP3, a multi-timeframe dashboard and alerts to your phone and Telegram. Built for M1 and M5 scalping and M15 intraday during the London and New York sessions. BONUS: FREE Auto-Trade EA for Gold Trend Coach. Message me after purchase and I send you the EA that trades the indicator s
Next Update — Version 2.52 Coming Soon! [NEW] Get Ready for 4 Major New Features Designed to Enhance Your Market Analysis and Trading Workflow We’re taking market analysis to the next level with 4   new features designed to meet your trading needs. Introducing: TRADE OVERVIEW DASHBOARD CONFLUENCE AT ZONE STRONG & WEAK HIGH/LOW OPTIMAL TRADE ENTRY  —   OTE 1. TADE OVERVIEW DASHBOARD  A dashboard that helps you understand the overall market picture more easily, providing guidance to support yo
Atomic Analyst MT5
Issam Kassas
4.5 (64)
Atomic Analyst — MetaTrader 5 Message me on MQL5 after purchase to receive Smart Universal Expert Advisor for FREE, plus the online course, PDF manual, and private group access. Atomic Analyst brings price action, trend direction, entry and exit signals, Stop Loss and multiple Take Profit levels together on your chart. SEE THE SIGNAL. UNDERSTAND THE SETUP. Atomic Analyst organizes its analysis into clear visual information: • Buy and sell arrows to identify potential entries. • Stop Loss and mul
Adaptive Price Action Engine Buy Indicator- Get EA Based on it for FREE. Self-Optimizing Multi-Timeframe Trend & Candlestick Intelligence Markets do not behave the same way all the time—and not every price-action pattern has the same value in every market regime. Adaptive Price Action Engine is designed to adapt to changing market conditions by combining trend structure, multi-timeframe analysis, candlestick patterns, and statistical optimization into one analytical framework. Two Adaptive Mode
ARICoins
Temirlan Kdyrkhan
ARICoin is a powerful trading companion designed to generate high-probability entry signals with dynamic TP/SL/DP levels based on volatility. Built-in performance tracking shows win/loss stats, PP1/PP2 hits, and success rates all updated live. Key Features: Buy/Sell signals with adaptive volatility bands Real-time TP/SL/DP levels based on ATR Built-in MA Filter with optional ATR/StdDev volatility Performance stats panel (Success, Profit/Loss, PP1/PP2) Alerts via popup, sound, push, or email Cust
Boba Analysis Suite
Trade Ready Solutions LLC
5 (2)
Boba Analysis Suite Boba Analysis Suite is an analytical indicator for MetaTrader 5. It brings market structure, relevant price zones and broader market context together in a single chart view. Developed through practical experience as a trader and trading coach, it supports a structured analysis process: assessing market direction, identifying important levels and considering multiple timeframes together. Analysis in Context Individual signals gain meaning through context. Boba Analysis Suite h
ScalpPoint
Temirlan Kdyrkhan
ScalpPoint is a powerful trading companion designed to generate high-probability entry signals with dynamic TP/SL/DP levels based on volatility. Built-in performance tracking shows win/loss stats, PP1/PP2 hits, and success rates — all updated live. Key Features: Buy/Sell signals with adaptive volatility bands Real-time TP/SL/DP levels based on ATR Built-in MA Filter with optional ATR/StdDev volatility Performance stats panel (Success, Profit/Loss, PP1/PP2) Alerts via popup, sound, push, or emai
Auto Optimized SpeedAngle is an institutional-grade momentum vectoring system that eliminates curve-fitting through continuous Walk-Forward Optimization (WFO). Rather than relying on static inputs that degrade when market regimes shift, the indicator dynamically recalibrates its parameters using Out-of-Sample (OOS) validation, ensuring the displayed signals represent genuine statistical edges rather than historical anomalies. By shifting the focus from subjective visual angles to normalized, qua
Zain Gold Scalping
Ahmed Gamal Abdel Nasser Mohamed
A complete price-action analysis tool built around dual independent entry logic, each confirmed against a volatility band, combined with a configurable set of nine optional confirmation filters that let you shape exactly how conservative or aggressive the tool's signals behave. Core Strategy Two independent entry setups, each triggering only when price moves outside a dynamic volatility band — giving two distinct ways to spot potential reversal points, which can be used together or separately.
Tokyo mt5 Indicator
Vasiliy Strukov
5 (14)
Tokyo Indicator provides a clear visual overview of trend direction, potential trading signals, and market conditions. Its colour-coded, stepped trend line distinguishes bullish phases in blue from bearish phases in magenta. Matching directional arrows highlight potential buying and selling opportunities when the displayed trend changes. An integrated dashboard brings together the current signal, market bias, momentum, volatility, and signal quality in one convenient view. This allows traders t
Azimuth Pro
Ottaviano De Cicco
5 (7)
Azimuth Pro V2: Synthetic Fractal Structure and Confirmed Entries for MT5 Overview Azimuth Pro is a multi-level swing structure indicator by Merkava Labs . Four nested swing layers, swing-anchored VWAP, ABC pattern detection, three-timeframe structural filtering, and closed-bar confirmed entries — one chart, one workflow from micro-swings to macro-cycles. This is not a blind signal product. It is a structure-first workflow for traders who care about location, context, and timing. Halloween P
Superhero
Ihor Otkydach
5 (3)
The SUPERHERO indicator is a multi-currency trading system designed on an "all-inclusive" basis. The indicator independently analyzes the market and provides signals on when to open and close trades. It uses Stop Loss and Take Profit orders. The R:R ratio is 1:1. This system can send push notifications to your smartphone, so you can place trades "on the go" without needing to be tied to a PC. It's perfect for proprietary trading firms. A BONUS FOR EVERY CUSTOMER: Every buyer of this indicator wi
Multi Currency Strength and Momentum Indicator MT5 Dynamic Forex28 Navigator is the evolution of our long-time, popular indicators, combining the power of three into one: Advanced Currency Strength28 Indicator (700 reviews) Advanced Currency IMPULSE with ALERT (530 reviews) CS28 Combo Signals (recent Bonus) The two predecessor indicators together have received more than 1,200 reviews on the MQL5 Market and have been a staple in the MT4 community since 2016. Dynamic Forex28 Navigator MT5 carries
Volatility Master for MetaTrader is a real-time dashboard tool that scans up to  50 symbols  to identify high-volatility , trending markets instantly. With bullish/bearish signals, customizable alerts, and a user-friendly interface, it helps you avoid range-bound conditions and focus on high-probability trades. Clarity leads to confidence. Trade confidently and protect your capital effectively with this powerful dashboard. We don't offer free or bonus indicators in exchange of reviews from you.
Apex Patterns PRO Buy Indicator - Get Expert Advisor Based on it for FREE. Self-Optimizing Chart Pattern & Breakout Intelligence Traditional pattern scanners rely on fixed inputs, often underperforming when market volatility and structures shift. Apex Patterns PRO is designed to adapt to changing market conditions by combining structural chart pattern recognition, momentum filtering, and statistical self-optimization into one analytical framework. Adaptive Scanning Engine Self-Optimizing Patter
Neuro Poseidon MT5
Daria Rezueva
4.68 (53)
Neuro Poseidon is a new indicator by Daria Rezueva. It combines precise trading signals with adaptive TP/SL levels - creating best possible trades as a result! Message me and get  Neuro Poseidon Assistant  as a gift to automize your trading process! What makes it stand out? 1. Proven profitability on all assets and timeframes 2. Only confirmed BUY and SELL signals present on the chart 3. Adaptive TP & SL levels generated by the software for each trade 4. Easy to understand - suitable for al
Break and Retest Hunter is a powerful MetaTrader 5 indicator designed to automatically identify support and resistance levels, breakout structures, and potential retest opportunities in real time. Bonus Indicator: After purchasing Break and Retest Hunter , contact me to receive Trade Indicator Assistant EA completely free as a bonus utility. $65 for the next 10 copies . Next price is $120.  Combining adaptive market analysis, clear BUY/SELL signals, Fibonacci-based profit targets, and a premiu
More from author
AlgoTrade Margin Call Levels shows the prices where your broker's margin call and stop out would start for open positions on the active chart symbol. It draws horizontal lines at each level and shows the distance to them. What it shows The current margin level, used margin and free margin. The margin call price and stop out price for the symbol, based on the account settings from your broker. The distance to each level in points, percentage and average daily ranges. The potential loss before rea
FREE
AlgoTrade Gold Range Meter shows how far the price has moved today compared with an average day. It is made for XAUUSD and works on any symbol. What it shows The average daily range of the last 20 closed days (high minus low; weekend bars and flat bars are left out). Today's range so far and the percentage of an average day it has reached, with a bar marked at 100% and 150%. Two dotted lines: today's low plus the average range, and today's high minus the average range. Today becomes an average-s
FREE
AlgoTrade Position Size Panel works out the lot size for the risk you choose. Drag three lines on the chart (entry, stop loss and take profit) and the panel shows the result at once. What it shows Lot size for a risk in percent of balance, percent of equity or a fixed amount in the account currency, rounded down to the broker lot step so the loss stays within your risk. Loss at the stop and profit at the target, in money and in percent of the balance. Reward to risk, margin needed and free margi
FREE
AlgoTrade News on Chart displays the MetaTrader 5 economic calendar directly on your chart. It draws vertical lines for events affecting the currencies of the chart symbol and lists upcoming events on a compact card, including forecast, previous, and actual values. What it shows A dotted vertical line at each event: red for high importance, orange for medium importance, and grey for low importance. Hover over a line to view the event name, time, and values. The next high-importance event with a
FREE
AlgoTrade ATR Stop Levels displays the average true range (ATR) of the chart symbol and the stop distance: ATR times a multiplier. It draws the stop for a buy and the stop for a sell on the chart, and shows the ATR on four timeframes on a card. It reads data only. What it does The ATR of the last closed bars (14 by default), on the chart timeframe or on M15, H1, H4 or D1. Stop distance equals ATR times the multiplier (1.5 by default), rounded up to whole ticks. Two dashed lines from the newest b
FREE
AlgoTrade News Impact Statistics shows how your closed trades performed around economic news. It runs on any chart and reads account data only. What it shows Trades opened near news: an event of the symbol's currencies within 30 minutes before or after entry (1 to 240 minutes). Trades held through news: an event occurring later while the trade was open. Trades away from news. For each group: the number of trades, the share of winning trades, the net result, and the average trade. The net result
FREE
AlgoTrade Basket Manager treats your open trades as one basket. It shows the net result of the basket and closes all of its trades at the net profit or the net loss you choose. It never opens a trade. What it shows The net result of the basket: floating profit, swaps and the commission paid when the trades were opened. The number of buy trades and sell trades and their lots. The break-even price of the trades on the chart symbol, drawn as a line on the chart. The prices where the basket would cl
FREE
AlgoTrade Round Number Levels draws round price levels around the price and shows on a card the levels just above and below, the distance to each, and how many times the price visited each one today. It reads data only. What it does Major levels: 100 pips on forex pairs, or a step of about 1% of the price on other symbols (for example 50 on gold). You can also set the step yourself. Minor levels: 50 pips on forex, or a smaller step such as 10 on gold. Quarter levels (25 and 75 pips) can be turne
FREE
AlgoTrade Currency Strength Meter shows the strength of each of the 8 major currencies (USD, EUR, GBP, JPY, CHF, CAD, AUD, NZD) against the other 7, ranked on a card with the strongest and the weakest. It reads data only. What it does Strength is the average move of each currency against the other 7 across the 28 pairs: since the open of today's, this week's, or this month's candle in server time, or over the last hours (4 by default). Displays a ranked list with a bar for each currency, stronge
FREE
AlgoTrade Previous Day High Low draws the previous day's high, low, and close, today's open, and the previous week's and month's high and low on the chart, displaying the price position relative to these levels on a card. It reads data only. What it does Lines for each level from the start of the current day, week, or month, showing the level's name and price. Colors adapt to dark or light charts or can be set in the inputs. A card showing the price position relative to yesterday's range (above
FREE
AlgoTrade Line Alerts monitors the lines drawn on the chart and alerts you when the price crosses a line or when a vertical line's time is reached. A card lists each line with its level, distance from the price, and alert status. It reads data only and does not modify your lines. What it does Works with horizontal, trend, and vertical lines. Draw them as usual from Insert > Objects > Lines; each new line is watched immediately. Alerts when the chart price crosses or touches a horizontal or trend
FREE
AlgoTrade Spread and Slippage Monitor displays the chart symbol spread and fill slippage on the chart. It runs on any chart and reads account data only. What it shows Current spread in points, along with the average and widest spread since the indicator started, updated on every new tick. Today's average and widest spread based on 1-minute bars. Hourly spread over the last 7 days (1 to 60 days), showing the widest hour, narrowest hour, and usual spread for the current hour. Slippage in points: t
FREE
AlgoTrade Trading Sessions draws the Sydney, Tokyo, London and New York sessions as boxes on the chart from the high to the low of each session, and shows on a card which sessions are open, when the next one opens, and each session's range against its average. It reads data only. What it does Boxes for the sessions of recent days (5 by default) on charts up to H4, with the session name and its range in points. Colors fit a dark or a light chart, or can be set in the inputs. A card with each sess
FREE
AlgoTrade Swap and Commission Tracker shows what your trades paid in commission, swap and fees, and what the next rollover may cost your open positions. It runs on any chart and reads account data only. What it shows Four periods with one click: today (from 00:00 server time), the last 7 days, the last 30 days and all history. For the period: the price result of closed trades, commission, swap, fees and charges, the net result, the number of closing deals and lots, and the cost per closed lot. T
FREE
AlgoTrade Loss Streak Guard helps you take a break after losing trades. It monitors your closed trades and pauses trading according to your rules. A trade opened during a pause is closed immediately or only reported, depending on your settings. The rules A wait after every losing trade (5 minutes by default). A longer pause after a specified number of losing trades in a row (3 losses and 1 hour by default). Each subsequent loss restarts the pause until a winning trade occurs. An optional stop fo
FREE
AlgoTrade Prop Guard watches the loss limits of your prop firm account in real time and shows them in one table: the limit, where you are now, a bar and the result. It warns you near a limit (70% by default). At the level you choose (90% by default) it closes all positions, deletes pending orders and keeps trading paused. What it checks Daily loss: from the balance at the daily reset, or from the higher of balance and equity. The limit is a % of the account size or of the start-of-day value. Max
AlgoTrade Drawdown Recovery Planner shows how far your account is below its high-water mark and the gain needed to recover. It runs on any chart and reads account data only. What it shows The high-water mark: the highest balance in the account history or the highest equity seen while the indicator runs, adjusted for deposits and withdrawals. You can also enter a custom value. Current equity, the drawdown in money and percentage, and the gain needed to return to the mark. A plan based on your inp
FREE
AlgoTrade Trading Hours Heatmap shows how your closed trades performed by the weekday and hour they were opened. It runs on any chart and reads account data only. What it shows A grid of weekdays and hours (broker server time). Saturday and Sunday rows appear when they have trades. Three measures with one click: net result, share of winning trades, and number of trades. All symbols or only the chart symbol, for the last 30 days, 90 days, 1 year or all history. The number of closed trades, the sh
FREE
AlgoTrade Account Statistics displays closed trade statistics on the chart. It runs on any chart and reads account data only. What it shows The net result of closed trades and the gain as a percentage of the starting balance. The number of closed trades, trades per week, the share of winning trades, and the profit factor. The average win, average loss, average trade, best trade, and worst trade. The longest runs of winning and losing trades. The deepest drop in closed-trade results, in money and
FREE
AlgoTrade Trade Journal records your trades automatically without manual typing. It runs on any chart and reads account data only. What it does Writes one row to a CSV file for every trade open, addition, partial close, close, and reversal. Each row includes the time, symbol, side, volume, price, stop loss, take profit, deal result, total trade result on close, magic number, reason (manual, Expert Advisor, stop loss, take profit), and comment. Takes a screenshot of the trade's symbol chart when
FREE
AlgoTrade Multi-Account Monitor shows all your MT5 accounts on one panel. Run it in each MetaTrader 5 terminal on the same computer: every copy shares its own account and shows all of them. It reads account data only. What it does Shows each account's equity and currency, floating result, margin level, today's closed result, and number of open positions. A headline at the top states "All accounts OK" or indicates how many accounts need attention. Warns when the margin level is below your limit,
FREE
AlgoTrade Weekly Trading Review displays a weekly summary of your closed trades directly on the chart, comparing the current or previous week to the preceding one alongside notes on notable patterns. It also saves each week as an HTML report. It reads account data only. What it does Displays the week's net result, number of closed trades, winning share, average win, average loss, profit factor, best day, and worst day, alongside the same metrics for the prior week. Provides notes based on your t
FREE
AlgoTrade Candle Timer displays the time remaining for the current candle next to the price, and on a card showing candles from M1 to monthly, the spread, server time, and when the symbol's market opens or closes. It reads data only. What it does Displays the time remaining for this chart's candle next to the latest candle in your chosen color and size. Shows "closed" when the market is closed. A card displaying the time remaining for M1, M5, M15, M30, H1, H4, daily, weekly, and monthly candles,
FREE
AlgoTrade Correlation Matrix shows how the symbols of your list move together, as a colored matrix on a card, with the symbols that move most with and most against the chart symbol. It reads data only. What it does Up to 10 symbols from a comma separated list (by default EURUSD, GBPUSD, USDJPY, AUDUSD, USDCAD, USDCHF, NZDUSD, XAUUSD). The chart symbol is added when it is not in the list. Finds each symbol at your broker, with the chart symbol's prefix and suffix (for example EURUSD.pc). Tabs for
FREE
Filter:
No reviews
Reply to review