AlgoTrade Pivot Points

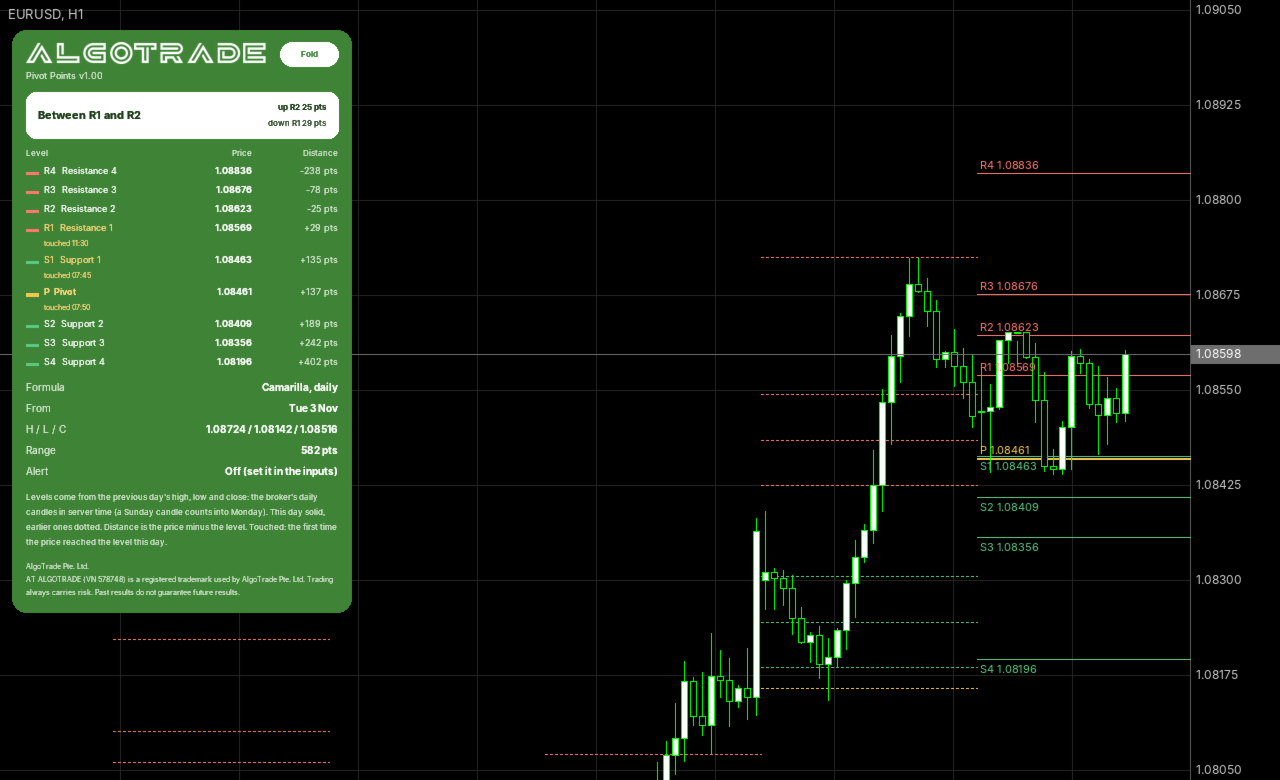
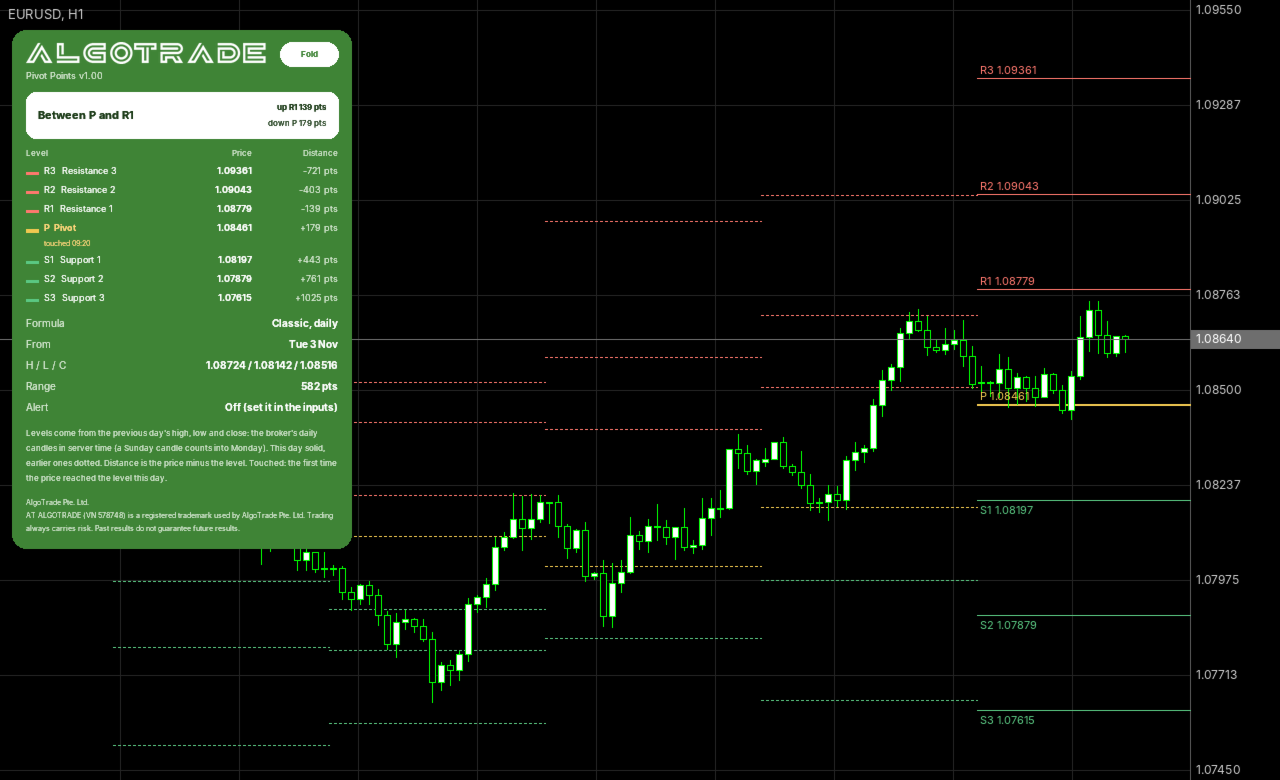
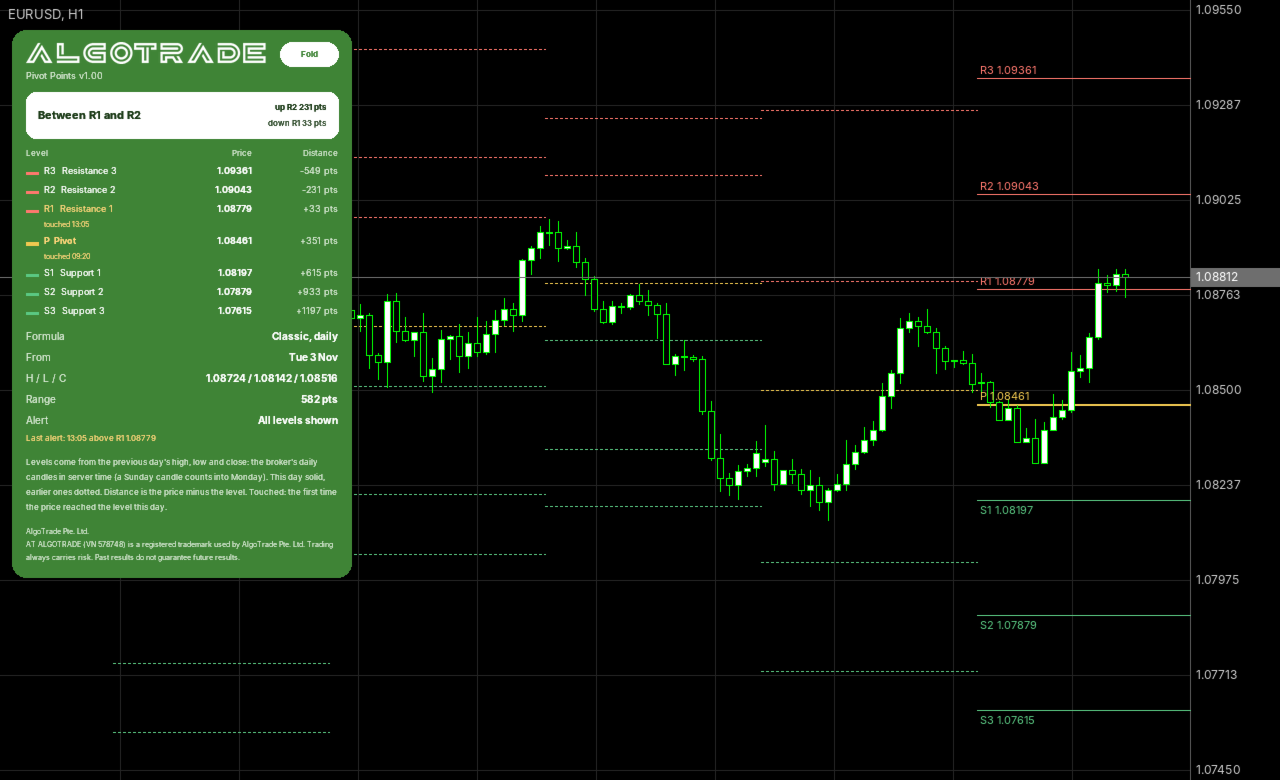
AlgoTrade Pivot Points draws the daily, weekly, or monthly pivot point, resistance, and support levels on the chart and shows the current price position on a card. It reads data only.

What it does

  • Five formulas: Classic, Fibonacci, Camarilla, Woodie and DeMark, based on the previous day's, week's or month's high, low and close (DeMark also uses the open).
  • Levels from R1 and S1 up to R3 and S3, or up to R4 and S4 with Camarilla.
  • Lines for the current period from its start, showing each level's name and price, with dotted lines for earlier periods (4 by default, up to 10). Colors fit a dark or light chart or can be set in the inputs.
  • A card that shows where the price is (for example, between P and R1), the nearest level above and below with the distance in points, and the price and distance for each level.
  • Shows which levels were touched in the current period and when the price first reached them.
  • Shows the period the levels come from, along with its high, low, close and range.
  • Optional alert when the price crosses the pivot or any level shown, with an optional push notification to your phone. Levels crossed by the same move come in one alert.

How to use

  • Attach the indicator to any chart. Choose the period, formula and number of levels to show in the inputs.
  • Days, weeks and months are the broker's daily, weekly and monthly candles in server time. On symbols that close for the weekend, a short Sunday candle is counted into Monday.
  • When the market is closed (a weekend or a holiday), the card shows the levels for the next day, week or month.
  • Click "Fold" to show a single line, or "Show" to display the full card. The card corner can be changed in the inputs.

Inputs: period, formula, levels shown, Sunday candle skipping, lines, earlier periods, line text, line colors, alerts and push notification, card corner.

Please read

  • This indicator reads data only and does not open, modify, or close trades.
  • For questions or feature requests, please post in the comments section on this page. Your reviews help us plan updates.

Made by AlgoTrade Pte. Ltd. Trading always carries risk. Past results do not guarantee future results.
제작자의 제품 더 보기
AlgoTrade Margin Call Levels shows the prices where your broker's margin call and stop out would start for open positions on the active chart symbol. It draws horizontal lines at each level and shows the distance to them. What it shows The current margin level, used margin and free margin. The margin call price and stop out price for the symbol, based on the account settings from your broker. The distance to each level in points, percentage and average daily ranges. The potential loss before rea
FREE
AlgoTrade Position Size Panel works out the lot size for the risk you choose. Drag three lines on the chart (entry, stop loss and take profit) and the panel shows the result at once. What it shows Lot size for a risk in percent of balance, percent of equity or a fixed amount in the account currency, rounded down to the broker lot step so the loss stays within your risk. Loss at the stop and profit at the target, in money and in percent of the balance. Reward to risk, margin needed and free margi
FREE
AlgoTrade News on Chart displays the MetaTrader 5 economic calendar directly on your chart. It draws vertical lines for events affecting the currencies of the chart symbol and lists upcoming events on a compact card, including forecast, previous, and actual values. What it shows A dotted vertical line at each event: red for high importance, orange for medium importance, and grey for low importance. Hover over a line to view the event name, time, and values. The next high-importance event with a
FREE
AlgoTrade Basket Manager treats your open trades as one basket. It shows the net result of the basket and closes all of its trades at the net profit or the net loss you choose. It never opens a trade. What it shows The net result of the basket: floating profit, swaps and the commission paid when the trades were opened. The number of buy trades and sell trades and their lots. The break-even price of the trades on the chart symbol, drawn as a line on the chart. The prices where the basket would cl
FREE
AlgoTrade Loss Streak Guard helps you take a break after losing trades. It monitors your closed trades and pauses trading according to your rules. A trade opened during a pause is closed immediately or only reported, depending on your settings. The rules A wait after every losing trade (5 minutes by default). A longer pause after a specified number of losing trades in a row (3 losses and 1 hour by default). Each subsequent loss restarts the pause until a winning trade occurs. An optional stop fo
FREE
AlgoTrade Prop Guard watches the loss limits of your prop firm account in real time and shows them in one table: the limit, where you are now, a bar and the result. It warns you near a limit (70% by default). At the level you choose (90% by default) it closes all positions, deletes pending orders and keeps trading paused. What it checks Daily loss: from the balance at the daily reset, or from the higher of balance and equity. The limit is a % of the account size or of the start-of-day value. Max
AlgoTrade Gold Range Meter shows how far the price has moved today compared with an average day. It is made for XAUUSD and works on any symbol. What it shows The average daily range of the last 20 closed days (high minus low; weekend bars and flat bars are left out). Today's range so far and the percentage of an average day it has reached, with a bar marked at 100% and 150%. Two dotted lines: today's low plus the average range, and today's high minus the average range. Today becomes an average-s
FREE
AlgoTrade Drawdown Recovery Planner shows how far your account is below its high-water mark and the gain needed to recover. It runs on any chart and reads account data only. What it shows The high-water mark: the highest balance in the account history or the highest equity seen while the indicator runs, adjusted for deposits and withdrawals. You can also enter a custom value. Current equity, the drawdown in money and percentage, and the gain needed to return to the mark. A plan based on your inp
FREE
AlgoTrade Swap and Commission Tracker shows what your trades paid in commission, swap and fees, and what the next rollover may cost your open positions. It runs on any chart and reads account data only. What it shows Four periods with one click: today (from 00:00 server time), the last 7 days, the last 30 days and all history. For the period: the price result of closed trades, commission, swap, fees and charges, the net result, the number of closing deals and lots, and the cost per closed lot. T
FREE
AlgoTrade Trading Hours Heatmap shows how your closed trades performed by the weekday and hour they were opened. It runs on any chart and reads account data only. What it shows A grid of weekdays and hours (broker server time). Saturday and Sunday rows appear when they have trades. Three measures with one click: net result, share of winning trades, and number of trades. All symbols or only the chart symbol, for the last 30 days, 90 days, 1 year or all history. The number of closed trades, the sh
FREE
AlgoTrade Account Statistics displays closed trade statistics on the chart. It runs on any chart and reads account data only. What it shows The net result of closed trades and the gain as a percentage of the starting balance. The number of closed trades, trades per week, the share of winning trades, and the profit factor. The average win, average loss, average trade, best trade, and worst trade. The longest runs of winning and losing trades. The deepest drop in closed-trade results, in money and
FREE
AlgoTrade Spread and Slippage Monitor displays the chart symbol spread and fill slippage on the chart. It runs on any chart and reads account data only. What it shows Current spread in points, along with the average and widest spread since the indicator started, updated on every new tick. Today's average and widest spread based on 1-minute bars. Hourly spread over the last 7 days (1 to 60 days), showing the widest hour, narrowest hour, and usual spread for the current hour. Slippage in points: t
FREE
AlgoTrade News Impact Statistics shows how your closed trades performed around economic news. It runs on any chart and reads account data only. What it shows Trades opened near news: an event of the symbol's currencies within 30 minutes before or after entry (1 to 240 minutes). Trades held through news: an event occurring later while the trade was open. Trades away from news. For each group: the number of trades, the share of winning trades, the net result, and the average trade. The net result
FREE
AlgoTrade Trade Journal records your trades automatically without manual typing. It runs on any chart and reads account data only. What it does Writes one row to a CSV file for every trade open, addition, partial close, close, and reversal. Each row includes the time, symbol, side, volume, price, stop loss, take profit, deal result, total trade result on close, magic number, reason (manual, Expert Advisor, stop loss, take profit), and comment. Takes a screenshot of the trade's symbol chart when
FREE
AlgoTrade Multi-Account Monitor shows all your MT5 accounts on one panel. Run it in each MetaTrader 5 terminal on the same computer: every copy shares its own account and shows all of them. It reads account data only. What it does Shows each account's equity and currency, floating result, margin level, today's closed result, and number of open positions. A headline at the top states "All accounts OK" or indicates how many accounts need attention. Warns when the margin level is below your limit,
FREE
AlgoTrade Weekly Trading Review displays a weekly summary of your closed trades directly on the chart, comparing the current or previous week to the preceding one alongside notes on notable patterns. It also saves each week as an HTML report. It reads account data only. What it does Displays the week's net result, number of closed trades, winning share, average win, average loss, profit factor, best day, and worst day, alongside the same metrics for the prior week. Provides notes based on your t
FREE
AlgoTrade Candle Timer displays the time remaining for the current candle next to the price, and on a card showing candles from M1 to monthly, the spread, server time, and when the symbol's market opens or closes. It reads data only. What it does Displays the time remaining for this chart's candle next to the latest candle in your chosen color and size. Shows "closed" when the market is closed. A card displaying the time remaining for M1, M5, M15, M30, H1, H4, daily, weekly, and monthly candles,
FREE
AlgoTrade Trading Sessions draws the Sydney, Tokyo, London and New York sessions as boxes on the chart from the high to the low of each session, and shows on a card which sessions are open, when the next one opens, and each session's range against its average. It reads data only. What it does Boxes for the sessions of recent days (5 by default) on charts up to H4, with the session name and its range in points. Colors fit a dark or a light chart, or can be set in the inputs. A card with each sess
FREE
AlgoTrade Previous Day High Low draws the previous day's high, low, and close, today's open, and the previous week's and month's high and low on the chart, displaying the price position relative to these levels on a card. It reads data only. What it does Lines for each level from the start of the current day, week, or month, showing the level's name and price. Colors adapt to dark or light charts or can be set in the inputs. A card showing the price position relative to yesterday's range (above
FREE
AlgoTrade Currency Strength Meter shows the strength of each of the 8 major currencies (USD, EUR, GBP, JPY, CHF, CAD, AUD, NZD) against the other 7, ranked on a card with the strongest and the weakest. It reads data only. What it does Strength is the average move of each currency against the other 7 across the 28 pairs: since the open of today's, this week's, or this month's candle in server time, or over the last hours (4 by default). Displays a ranked list with a bar for each currency, stronge
FREE
AlgoTrade Correlation Matrix shows how the symbols of your list move together, as a colored matrix on a card, with the symbols that move most with and most against the chart symbol. It reads data only. What it does Up to 10 symbols from a comma separated list (by default EURUSD, GBPUSD, USDJPY, AUDUSD, USDCAD, USDCHF, NZDUSD, XAUUSD). The chart symbol is added when it is not in the list. Finds each symbol at your broker, with the chart symbol's prefix and suffix (for example EURUSD.pc). Tabs for
FREE
AlgoTrade ATR Stop Levels displays the average true range (ATR) of the chart symbol and the stop distance: ATR times a multiplier. It draws the stop for a buy and the stop for a sell on the chart, and shows the ATR on four timeframes on a card. It reads data only. What it does The ATR of the last closed bars (14 by default), on the chart timeframe or on M15, H1, H4 or D1. Stop distance equals ATR times the multiplier (1.5 by default), rounded up to whole ticks. Two dashed lines from the newest b
FREE
AlgoTrade Round Number Levels draws round price levels around the price and shows on a card the levels just above and below, the distance to each, and how many times the price visited each one today. It reads data only. What it does Major levels: 100 pips on forex pairs, or a step of about 1% of the price on other symbols (for example 50 on gold). You can also set the step yourself. Minor levels: 50 pips on forex, or a smaller step such as 10 on gold. Quarter levels (25 and 75 pips) can be turne
FREE
AlgoTrade Line Alerts monitors the lines drawn on the chart and alerts you when the price crosses a line or when a vertical line's time is reached. A card lists each line with its level, distance from the price, and alert status. It reads data only and does not modify your lines. What it does Works with horizontal, trend, and vertical lines. Draw them as usual from Insert > Objects > Lines; each new line is watched immediately. Alerts when the chart price crosses or touches a horizontal or trend
FREE
필터:
리뷰 없음
리뷰 답변