Big MACD MT5
- Indicators
-
Evgeniy Zhdan
 🚀 Products for MT4 & MT5. Only the best and truly useful tools for traders: https://www.mql5.com/en/users/trendhunter/seller
➖➖➖➖➖➖➖➖➖➖➖➖➖➖➖➖➖➖➖➖➖➖ - Version: 2.10
- Activations: 5
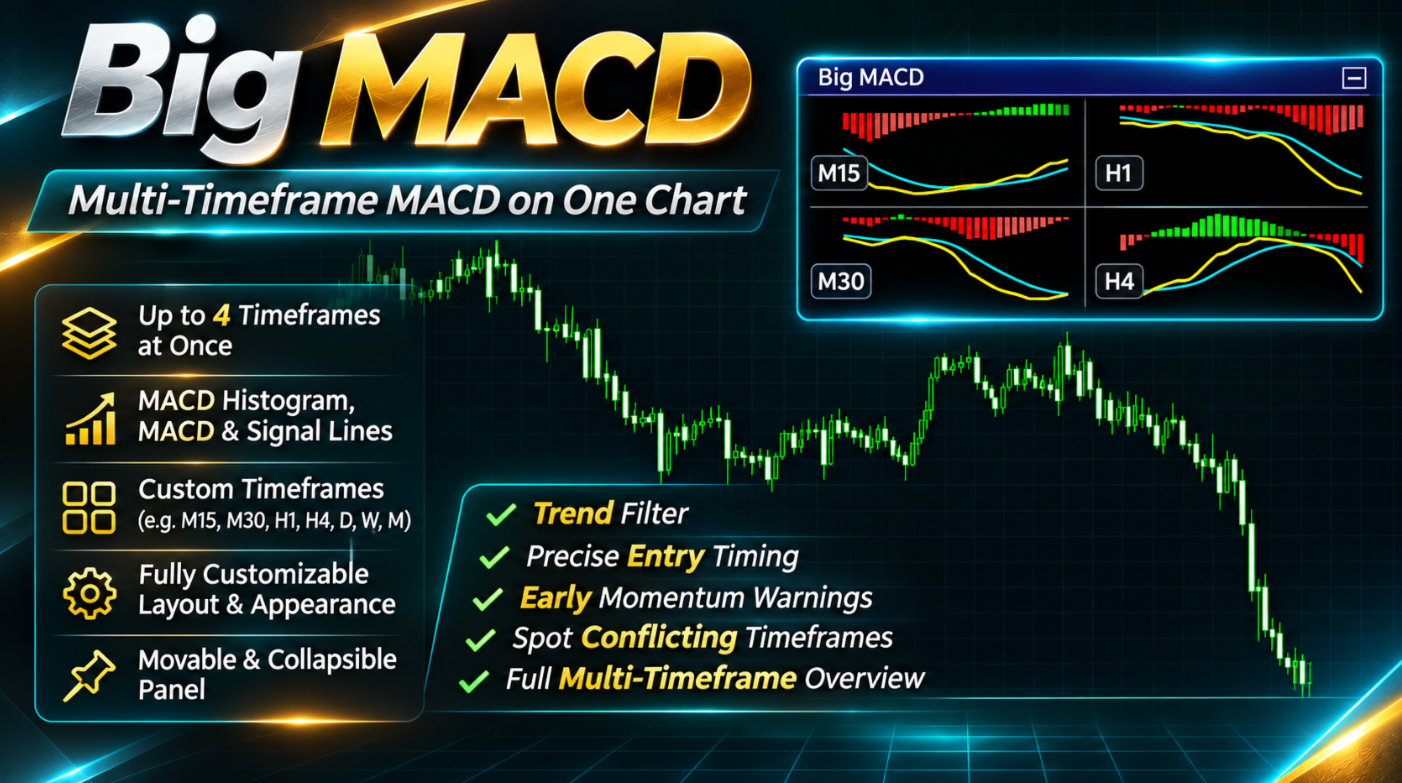
Big MACD displays the MACD indicator for up to four timeframes at once, in compact panels placed directly on the price chart. You can watch the market on M15, M30, H1, H4 or any other timeframes you choose without switching charts, and make decisions with the full multi-timeframe picture in front of you.
MT4-version: https://www.mql5.com/en/market/product/205527
What you see on the chart
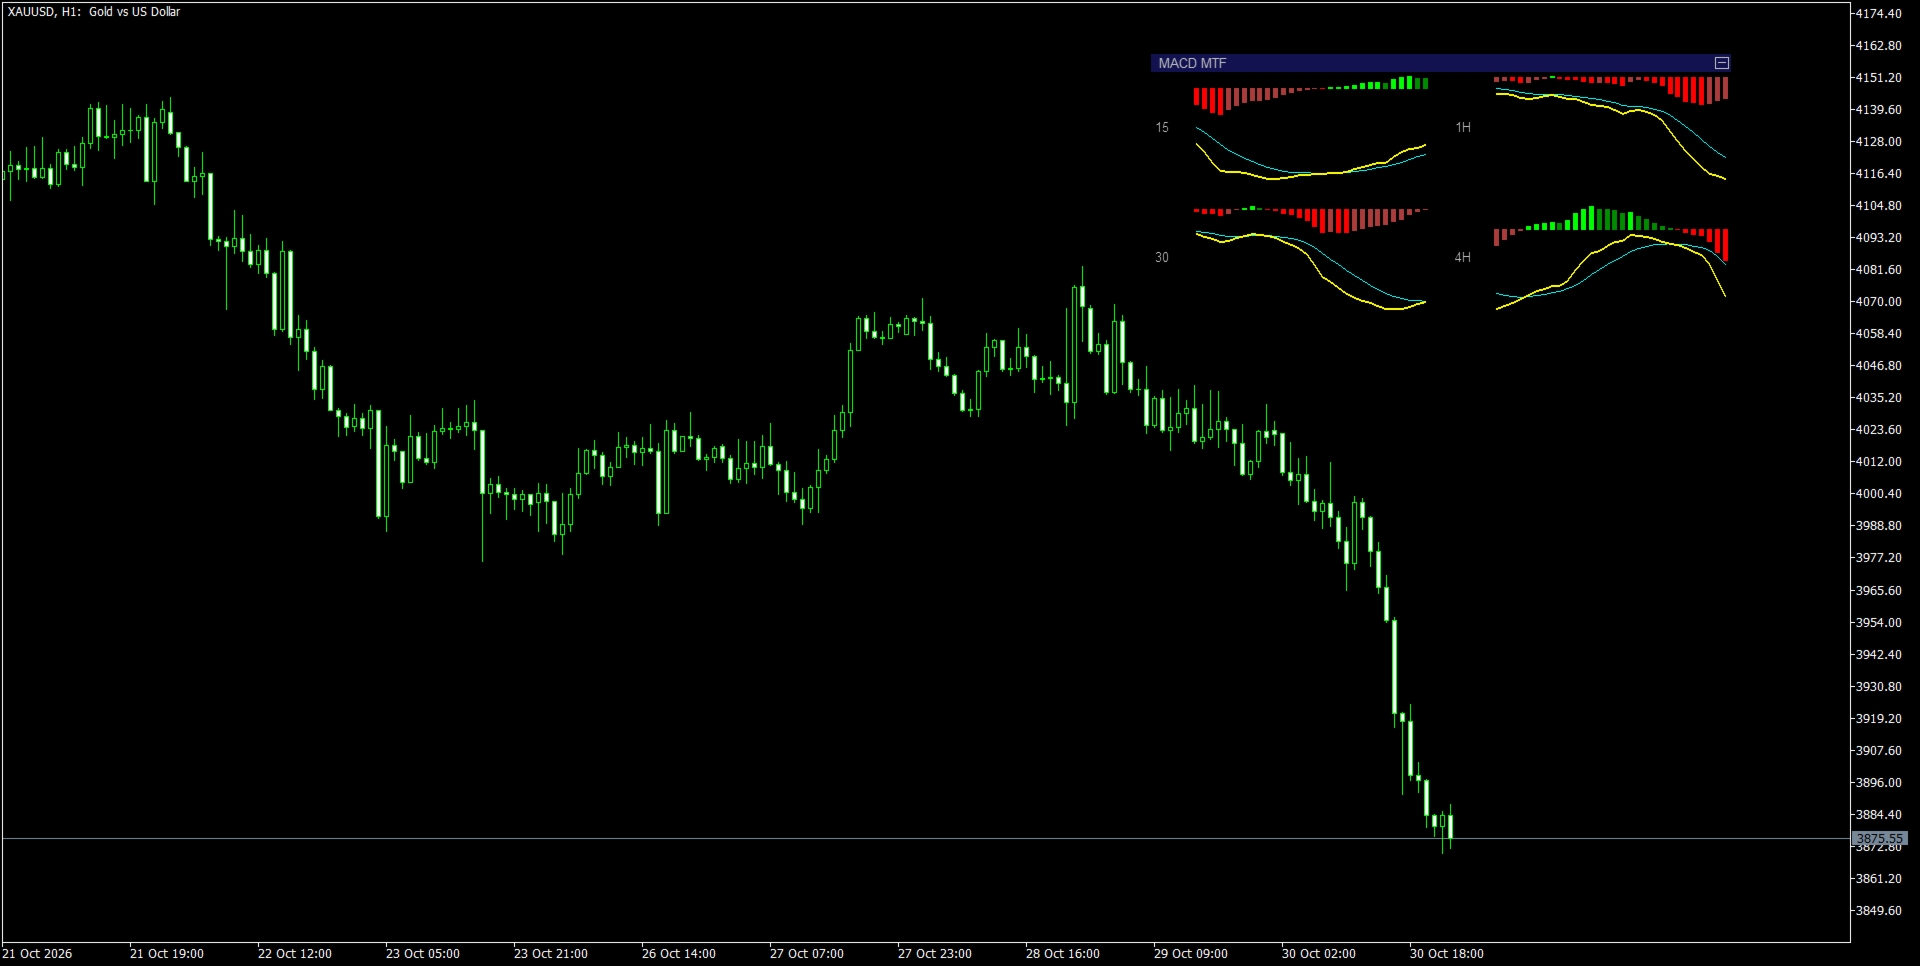
Control strip. A thin strip sits above the panels. Drag it with the mouse to move the whole block anywhere on the chart. The button at the right end of the strip collapses the panels so that only the strip remains, and expands them again. The position and the collapsed state are remembered separately for each chart.
Panels. Each panel belongs to one timeframe, and its name is shown on the left (15, 30, 1H, 4H, D, W, M). With four panels enabled they are arranged in a 2x2 grid; with fewer panels they are stacked in a single column.
Contents of a panel:
- Histogram: columns showing the gap between the MACD line and the signal line.
- MACD line: the main line (yellow by default, thicker).
- Signal line: the smoothed line (aqua by default, thinner).
- Candles (optional): candles of the same timeframe in the background.
Every panel is scaled independently to its own recent bars. Compare shape, direction, colors and line crossings between panels, not absolute values. The right edge of each panel corresponds to the current, still forming bar of that timeframe.
How to read the panel data
- Histogram. Columns grow from the zero level. Above zero, bullish momentum prevails; below zero, bearish momentum.
- Column color (default colors):
- above zero and rising (bright green): bullish momentum is strengthening;
- above zero and falling (dark green): bullish momentum is fading;
- below zero and rising (muted red): selling pressure is easing;
- below zero and falling (bright red): bearish momentum is strengthening.
- Line crossings. When the MACD line crosses the signal line from below, momentum turns up; from above, it turns down. At that moment the histogram crosses zero and changes sign.
- Distance between the lines. The wider the gap (the taller the columns), the stronger the move. A narrowing gap means the move is running out of steam.
- Timeframe name on the left shows which timeframe the panel data belongs to.
How a trader can use it
- Trend filter. Trade in the direction the higher-timeframe panels point to. For example, when H1 and H4 are both in the green zone, buying has priority.
- Entry timing. The higher timeframe sets the direction, while a histogram color change or a line crossing on the lower timeframe serves as the entry trigger.
- Early warning. A histogram shifting from a bright color to a dark one means momentum is weakening before the lines cross. It is a reason to tighten a stop or hold off on new positions.
- Conflicting timeframes. When panels show opposite states, the market is usually in a pullback or a range. You can wait for the timeframes to align.
- Compact overview. The indicator works on any symbol and does not depend on the chart timeframe: you can trade on M1-M5 and keep control of the bigger picture through the higher timeframes.
Settings
Position & size (pixels)
- Initial offset from the right edge: starting distance of the block from the right edge of the chart, in pixels. Used on the first launch; afterwards the position is saved when you drag the block.
- Initial offset from the top: starting distance of the block from the top edge of the chart, in pixels.
- Panel width: width of one panel in pixels.
- Panel height: height of one panel in pixels.
- Gap between panels: distance between the panels.
- Bars per panel: how many recent bars of the timeframe are shown in each panel. More bars give a longer history but a finer drawing.
Appearance
- Show panel titles: show timeframe names to the left of the panels.
- Show histogram: show the histogram.
- Show MACD line: show the MACD line.
- Show Signal line: show the signal line.
- Show candles in panels: show candles of the corresponding timeframe in the background.
- Candle transparency (%): transparency of the candles. The higher the value, the paler the candles and the clearer the lines.
- Bull candle: color of rising candles.
- Bear candle: color of falling candles.
- MACD line color: color of the MACD line.
- Signal line color: color of the signal line.
- Histogram above zero, rising: column color above zero while it is growing.
- Histogram above zero, falling: column color above zero while it is shrinking.
- Histogram below zero, rising: column color below zero while it is growing (pressure is easing).
- Histogram below zero, falling: column color below zero while it is shrinking.
- Text color: color of the timeframe names and the text on the control strip.
Timeframe 1, Timeframe 2, Timeframe 3, Timeframe 4
Each of the four panels has its own settings. M15, M30, H1 and H4 are enabled by default.
- Show timeframe 1 (2, 3, 4): turns the panel on or off.
- Timeframe: timeframe of the panel. Any timeframe can be chosen; it does not have to be higher than the chart timeframe.
- Fast Length: period of the fast component of MACD (12 by default). A lower value reacts faster but gives more false signals.
- Slow Length: period of the slow component of MACD (26 by default).
- Signal Smoothing: smoothing of the signal line (9 by default). A lower value gives more frequent crossings.
Because the parameters are set per panel, different timeframes can use different MACD settings.
Additional notes
- The indicator does not change the chart style or chart settings.
- When the indicator is removed, all of its objects are cleared from the chart.