Simba Position Manager
- Indicators
-
Emmanuel Ndacyayisenga
 NDACYAYISENGA Emmanuel is a quantitative trader and MQL5 Expert Advisor developer focused on transforming practical trading concepts into systematic and automated trading solutions.
- Version: 3.10
- Activations: 10
Trade Your Setup. Understand Your Position.
You found the setup.
You opened the trade.
Now what?
This is where many traders struggle.
Finding an entry is only one part of trading. Once a position is open, you still need to understand whether the trade is progressing, how much risk remains, when the position reaches important R-multiples, whether momentum is strengthening or weakening, and whether market conditions continue to support the trade.
SIMBA Position Manager is designed to help with that part of the trading process.
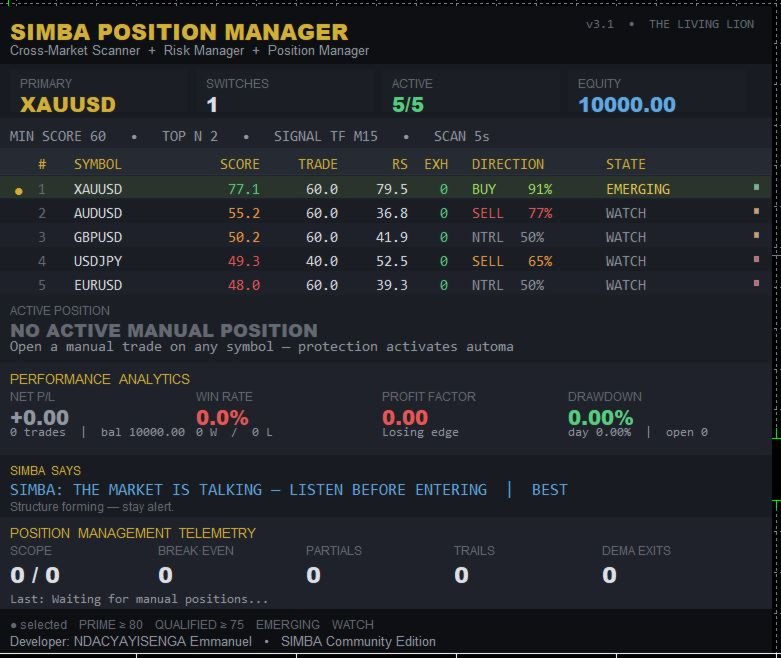
It is an MT5 monitoring and analysis indicator with a professional dashboard designed to analyze open positions, market conditions and potential management levels.
SIMBA does not open, close, modify or manage trades.
You remain in control of every trade. SIMBA provides the information and analysis to help you make better management decisions.
WHAT DOES SIMBA DO?SIMBA continuously analyzes the market and your open positions and presents the information through a structured dashboard.
The indicator combines concepts such as:
-
R-multiples
-
ATR
-
PSAR
-
DEMA
-
Fibonacci levels
-
Market direction
-
Momentum
-
Volatility
-
Multi-timeframe conditions
-
Risk and reward
-
Position progress
Instead of constantly calculating these conditions manually, SIMBA brings them together into one workspace.
The core philosophy is:
MONITOR → ANALYZE → PROTECT → MANAGE → DECIDE
SIMBA provides the analysis.
You make the decision.
IMPORTANT: SIMBA DOES NOT MODIFY TRADESSIMBA Position Manager is an analysis and monitoring indicator.
It does not:
-
Open trades
-
Close trades
-
Modify Stop Loss
-
Modify Take Profit
-
Move positions to Break-Even
-
Execute partial profits
-
Trail positions
-
Change your lot size
-
Send trade-management orders
The indicator simply monitors and analyzes the position and displays management information, levels and conditions on the dashboard.
This means you can use SIMBA alongside your existing trading strategy while maintaining complete manual control. if your want the indicator which can do all that check Simba Position Manager Pro
YOUR TRADE. YOUR DECISION.Many traders know how to find entries.
The difficult part often comes afterward.
You may ask:
Is my trade progressing normally?
How much have I made in R?
Where is my potential break-even level?
Has the market reached a meaningful profit area?
Is momentum still supporting the position?
Is the trend becoming exhausted?
Should I protect more profit?
Should I allow the trade to continue?
SIMBA is designed to help answer these questions through live market analysis.
R-BASED POSITION ANALYSISSIMBA uses the initial risk of the position as a reference point.
Your initial risk represents:
1R
From there, the dashboard can help you understand the position's progress through stages such as:
INITIAL → +1R → +2R → +3R → RUNNER
For example, the dashboard can help identify when a position has reached:
-
+1R
-
+2R
-
+3R
-
Other configured R-multiples
This allows you to evaluate the trade based on its original risk rather than simply looking at raw currency profit.
Instead of thinking:
"I am up $150."
You can think:
"The position has reached +2R."
That provides a more consistent framework for comparing trades.
POSITION PROTECTION ANALYSISSIMBA can calculate and display potential protection levels based on its analytical logic.
Depending on the configuration and market conditions, the dashboard can reference:
-
ATR
-
PSAR
-
Initial risk
-
Entry price
-
Current price
-
R-multiple
-
Market structure
-
Fibonacci levels
These levels are presented as analysis and reference information.
The trader decides whether to manually apply any change to the position.
This keeps the trader in control while reducing the amount of calculation required during a live trade.
BREAK-EVEN ANALYSISMoving a trade to break-even is an important decision.
Move too early and normal market noise may remove a potentially good trade.
Move too late and an already profitable trade may return toward its original risk.
SIMBA monitors the position's progress and can identify when predefined R-based conditions have been reached.
The dashboard can therefore show when a position has reached a potential break-even management stage.
SIMBA informs. You decide.
PARTIAL PROFIT ANALYSISOne of the biggest challenges in trading is knowing what to do with a profitable position.
Close everything too early and the market may continue much further.
Hold everything without a plan and a profitable trade may give back a significant portion of its gains.
SIMBA can display R-based and market-based management levels that can help traders evaluate potential partial-profit opportunities.
The trader can then decide whether to:
SECURE → HOLD → REDUCE → CONTINUE
No automatic order is executed.
RUNNER ANALYSISSometimes the best part of a trade happens after the first profit target.
SIMBA helps traders identify when a position has moved sufficiently into profit to consider allowing part of the position to continue.
The dashboard can monitor:
-
Current R
-
Trend direction
-
Momentum
-
PSAR
-
DEMA
-
Volatility
-
Potential target areas
-
Market exhaustion
This gives the trader more information when deciding whether a profitable position should continue running.
Secure information. Protect decisions. Give strong trades room when conditions allow.
R-BASED TRAILING ANALYSISSIMBA can calculate and display potential R-based trailing references.
As the position moves further into profit, the trader can see how different protection levels could affect the trade.
For example:
+1R → Protection Zone
+2R → Profit Protection Zone
+3R → Extended Protection Zone
These are analytical references rather than automatic trading commands.
You decide whether and when to adjust your actual Stop Loss.
PSAR MARKET ANALYSISParabolic SAR provides a dynamic view of market direction and trend movement.
SIMBA can use PSAR information to help evaluate whether market conditions continue to support the direction of an open position.
The dashboard can show whether PSAR is:
SUPPORTING
or
CONTRADICTING
the current position direction.
This gives traders another layer of information when deciding whether to continue holding, protect profit or reconsider the position.
DEMA + PSAR ANALYSISA single indicator should not always determine what happens to a trade.
For example, a DEMA crossover against a position does not necessarily mean that the entire trend has ended.
SIMBA therefore combines DEMA and PSAR conditions to provide a broader analytical picture.
A potential DEMA change can be evaluated together with PSAR conditions.
The dashboard can help identify situations such as:
DEMA CHANGE + PSAR SUPPORT
The trend may still have strength.
Or:
DEMA CHANGE + PSAR CONTRADICTION
The position may require closer attention.
SIMBA does not make the final decision.
It gives the trader more information before making it.
FIBONACCI MARKET LEVELSSIMBA can also use Fibonacci-based calculations as reference points for trade analysis.
These levels can help traders evaluate:
-
Potential profit zones
-
Retracement areas
-
Extension levels
-
Market reaction areas
-
Potential target locations
Fibonacci levels are presented as analytical references and should be interpreted together with the broader market conditions.
PROFESSIONAL LIVE DASHBOARDThe heart of SIMBA Position Manager is its dashboard.
Instead of manually checking multiple calculations, the trader can see important information in one workspace.
The dashboard can display information such as:
-
Open position
-
Direction
-
Entry price
-
Current price
-
Current profit/loss
-
Current R
-
Initial risk
-
Potential management levels
-
Market direction
-
Market strength
-
Momentum
-
PSAR condition
-
DEMA condition
-
ATR information
-
Fibonacci levels
-
Market state
-
Position status
The objective is simple:
Less calculation. More awareness. Better decisions.
SIMBA MARKET STATUSSIMBA can also monitor the broader market environment.
The dashboard can communicate different market states such as:
PRIME
The monitored market currently meets stronger internal conditions.
WATCH
The market is being monitored but does not currently meet the stronger conditions.
DECAYING
The market is showing signs of weakening, exhaustion or deteriorating conditions.
WAIT
Additional confirmation may be required.
PROTECTED
The position has reached a condition where profit protection may deserve attention.
These states are designed to make complex market information easier to understand at a glance.
MARKET SCANNERSIMBA can monitor multiple markets from one dashboard.
Instead of manually switching between charts, traders can compare the monitored instruments and see which markets currently deserve attention.
The analysis can consider factors such as:
-
Trend
-
Momentum
-
Volatility
-
Multi-timeframe alignment
-
Market strength
-
Tradeability
-
Exhaustion
-
Risk/reward conditions
-
Setup quality
The result is a ranked view of the markets being monitored.
SCAN → SCORE → FILTER → RANK → ANALYZE
MULTI-TIMEFRAME ANALYSISMarkets can look bullish on one timeframe and bearish on another.
SIMBA helps traders see these relationships more clearly.
The dashboard can compare conditions across multiple timeframes to help identify:
-
Higher-timeframe direction
-
Intermediate trend
-
Entry-timeframe conditions
-
Momentum alignment
-
Potential conflicts
This helps answer an important question:
Is my position moving with the broader market or against it?
BUILT FOR MANUAL TRADERSSIMBA Position Manager is designed for traders who want analytical assistance without giving up control.
DISCRETIONARY TRADERS
You choose the setup.
You choose the entry.
SIMBA helps you monitor what happens afterward.
DAY TRADERS
Monitor several positions and markets without repeatedly performing the same calculations.
SCALPERS
Use the dashboard to quickly understand position progress and changing market conditions.
SWING TRADERS
Continue monitoring positions while keeping important management information visible.
PROP FIRM TRADERS
Use the analytical framework to monitor R, position progress and market conditions while following your own firm's risk rules.
Always verify your firm's current rules before using any trading-management workflow.
WHAT MAKES SIMBA DIFFERENT?SIMBA is not designed to replace your trading strategy.
It does not tell you that every market must be traded.
It does not claim to predict the future.
It does not promise profitable trades.
Instead, it focuses on something that is often overlooked:
WHAT HAPPENS AFTER THE ENTRY?
SIMBA brings together:
MARKET AWARENESS
Understand the current condition of the market.
POSITION AWARENESS
Understand what is happening to your open position.
RISK AWARENESS
Understand how far the position has moved relative to its initial risk.
MANAGEMENT AWARENESS
Identify potential protection, profit and trailing reference levels.
All inside one dashboard.
SIMBA IS YOUR SECOND SET OF EYESYou do not need another indicator telling you simply:
BUY
or
SELL
You need information that helps you understand what is happening after you have made the decision to trade.
SIMBA can help you see:
-
Is the position profitable?
-
How many R have I achieved?
-
Has the position reached a management milestone?
-
Is momentum still supporting the trade?
-
Is PSAR supporting the direction?
-
What is DEMA showing?
-
Where are potential protection levels?
-
Where are potential profit areas?
-
Is the market becoming exhausted?
-
Should I pay closer attention?
The final decision remains yours.
KEY FEATURES| Feature | Purpose |
|---|---|
| Live Position Monitoring | Monitor open positions in real time |
| R-Multiple Analysis | Measure position performance relative to initial risk |
| Break-Even Reference | Identify potential break-even management stages |
| Partial-Profit Analysis | Highlight potential profit-management areas |
| Runner Analysis | Help evaluate whether a position may have room to continue |
| R-Based Trailing Analysis | Display potential R-based protection references |
| PSAR Analysis | Monitor dynamic market direction |
| DEMA Analysis | Monitor trend and momentum changes |
| DEMA + PSAR Logic | Combine conditions for deeper analysis |
| ATR Analysis | Evaluate volatility and potential protection references |
| Fibonacci Analysis | Display potential retracement and extension areas |
| Market Scanner | Monitor multiple instruments |
| Multi-Timeframe Analysis | Compare conditions across timeframes |
| Market Ranking | Identify markets meeting stronger analytical conditions |
| Market State | Quickly understand current market conditions |
| Live Dashboard | Bring market and position information together |
| Manual Control | Trader remains responsible for all trading actions |
SIMBA Position Manager is intentionally designed as a monitoring and analysis indicator.
It does not:
❌ Open trades
❌ Close trades
❌ Modify existing trades
❌ Move Stop Loss automatically
❌ Move Take Profit automatically
❌ Execute partial closes
❌ Automatically trail positions
❌ Automatically change lot sizes
❌ Guarantee profitable trades
❌ Predict the market
The indicator provides information and analytical references. check Simba Position Manager Pro
The trader makes the final decision and executes any desired trade action manually.
WHY MANUAL CONTROL MATTERSTrading is not only about calculations.
It is also about context.
A technical calculation can identify a potential level, but the trader may have additional information about:
-
News
-
Session conditions
-
Liquidity
-
Market structure
-
Correlation
-
Account exposure
-
Personal risk tolerance
-
Trading plan
-
Prop-firm restrictions
SIMBA therefore does not attempt to take control away from the trader.
Instead:
SIMBA calculates.
SIMBA monitors.
SIMBA displays.
YOU DECIDE.
WHO SHOULD USE SIMBA?SIMBA Position Manager may be suitable for traders who:
-
Already have their own trading strategy
-
Prefer manual entries
-
Want better post-entry analysis
-
Trade multiple markets
-
Want R-based position monitoring
-
Want to understand trade progress more clearly
-
Want potential management levels displayed automatically
-
Want market conditions and positions in one dashboard
-
Want to reduce repetitive calculations
-
Want more structured decision-making
It may not be suitable for traders looking for a simple buy/sell signal or a fully automated trading system.
GETTING STARTED-
Install SIMBA Position Manager on MetaTrader 5.
-
Attach the indicator to your preferred chart.
-
Configure the markets and analytical settings.
-
Open your trade using your own strategy.
-
Allow SIMBA to monitor the position.
-
Review the dashboard as the market develops.
-
Use the displayed information to evaluate your management decisions.
-
Execute any desired trade adjustment manually through MT5.
SIMBA does not take control of your account.
You remain the trader.
THE SIMBA APPROACHSCAN THE MARKET.
UNDERSTAND THE CONDITION.
ENTER WITH YOUR STRATEGY.
MONITOR THE POSITION.
MEASURE THE TRADE IN R.
IDENTIFY PROTECTION LEVELS.
WATCH MOMENTUM AND TREND.
SECURE PROFIT WHEN YOUR PLAN SAYS SO.
LET STRONG TRADES DEVELOP WHEN CONDITIONS ALLOW.
Trading will always involve uncertainty.
SIMBA cannot remove that uncertainty.
What it can do is help transform post-entry monitoring from a collection of manual calculations into a structured visual process.
YOU BRING THE STRATEGY.
YOU MAKE THE ENTRY.
SIMBA MONITORS THE POSITION.
YOU MAKE THE FINAL DECISION.
SIMBA POSITION MANAGERMonitor. Analyze. Decide.
PRODUCT IDENTITY
Developed by: ShieldNexus
Developer: NDACYAYISENGA Emmanuel
Trading Engine: SIMBA Trading Engine
Product Edition: SIMBA Community EditionSIMBA Position Manager
Powered by the SIMBA Trading Engine© NDACYAYISENGA Emmanuel / ShieldNexus
Product version and features may be updated over time.
Risk Warning: Trading financial markets involves substantial risk. Past or simulated performance does not guarantee future results. Use appropriate risk management and test the EA on a demo account before live deployment.